[ View menu ]

July 21, 2009

Score with scoring rules

Filed in Encyclopedia ,Ideas ,R ,Research News ,Tools
Subscribe to Decision Science News by Email (one email per week, easy unsubscribe)

INCENTIVES TO STATE PROBABILITIES OF BELIEF TRUTHFULLY

We have all been there. You are running an experiment in which you would like participants to tell you what they believe. In particular, you’d like them to tell you what they believe to be the probability that an event will occur.

Normally, you would ask them. But come on, this is 2009. Are you going to leave yourself exposed to the slings and arrows of experimental economists? You need to give your participants an incentive to tell you what they really believe, right?

Enter the scoring rule. You pay off the subjects based on the accuracy of the probabilities they state. You do this by observing some outcome (let’s say “rain”) and you pay a lot of money to the people who assigned a high probability to it raining and you pay a little money (or even impose a fine upon) those who assigned a low probability to it raining. A so-called “proper” scoring rule is one in which people will do the best for themselves if they state what they truly believe to be the case.

Three popular proper scoring rules are the Spherical, Quadratic, and Logarithmic. Let’s see how they work.

Suppose in your experimental task you give people the title of a movie, and they have to guess what year the movie was released.  You tell them at the outset that the movie was released between 1980 and 1999: that’s 20 years. So you have these 20 categories (years) and you want people to assign a probability to each year. Afterwards, you will pay them out based on the actual year the movie was released and the probability they assigned to that year.

Let r be the vector of 20 probabilities, and r_1 could be the probability they assign to 1980 being the year of release, and r_2 the probability that it was 1981, so on through r_20 for 1999’s probability. Naturally, all the r’s add up to one, as probabilities like to do. Now, let r_i be the probability they assign to the year which turns out to be correct.

Under the Spherical scoring rule, their payout would be r_i / (r*r)^.5

Under the Quadratic scoring rule, the payout would be 2*r_i – r*r

Under the Logarithmic scoring rule, the payout would be ln(r_i)

In the movie above, the top row shows various sets of probabilities someone might assign to the 20 years. (Imagine the categories along the x-axis are the years 1980 to 1999).  Each bar in the graphs in the bottom three rows shows the person’s payout if that year turns out to be correct, based on the probabilities assigned to each year in the top row.

As you can see, when they assign a high probability to a category and it turns out to be correct, their payout is high. When they assign a low payout to a category and it turns out to be correct, their payout is low.

You’ll notice that the Logarithmic scoring rule goes right off the bottom of the page. This is because the log of small probabilities are negative numbers far beneath zero, and the log of 0 is negative infinity!

While I was at Stanford I heard that decision scientist extraordinaire Ron Howard (no relation) used to make students assign probabilities to the alternatives (A, B, C or D) on the multiple choice items on the final exam. The score for each question was the log of the probability they assigned to the correct answer. This means, of course, that if you assign a probability of 0 to alternative “B” and alternative “B” turns out to be correct, your score on that question is negative infinity. I always wondered if you got a negative infinity on one question if it meant you got negative infinity on the exam, or if there was some mercy clause.

But the main reason I am writing this post is because I wonder what experimental economists and psychologists are supposed to do when implementing log scoring rules in the lab. Naturally, you can endow the participant with cash at the beginning of the experiment and have them draw down with each question, but what do you do if they score a negative infinity? Take their life savings?

Winkler (1971) decided that he would treat probabilities less than .001 as .001 when it came time to imposing the penalty. Does anyone know of other methods?

REFERENCE

Robert L. Winkler (1971)  Probabilistic Prediction: Some Experimental Results, Journal of the American Statistical Association, Vol. 66, No. 336.  pp. 675-685.

NOTE

To make this simulation, I’ve drawn on the top row various beta distributions of differing modes between two fixed endpoints. This is akin to having a min and a max guess for the year of release, then entertaining various years between those two endpoints as most likely.

July 13, 2009

Ariely on Decision Making at TED

Filed in Conferences ,Research News
Subscribe to Decision Science News by Email (one email per week, easy unsubscribe)

ARE WE IN CONTROL OF OUR OWN DECISIONS?

da

Society for Judgment and Decision Making president Dan Ariely gave a TED talk on decision making, which they recently posted on their site. The decision making society president gives a talk on decision making: What could be more relevant for Decision Science News, which, after all is a website about decision research in Marketing, Psychology, Economics, Medicine, Law, Management, Public Policy, Statistics, Computer Science & Interaction Design.

Note the bit on organ donation at the five minute mark, it’s another favorite topic here at DSN.

If you are not familiar with the TED site, it’s a great source of mind-expanding lectures. Attending the TED conference costs a small fortune, but fortunately the content on their website is free. (You can even download copies to your own computer.)

July 6, 2009

Dance with chance

Filed in Books
Subscribe to Decision Science News by Email (one email per week, easy unsubscribe)

MAKING LUCK WORK FOR YOU

dwc

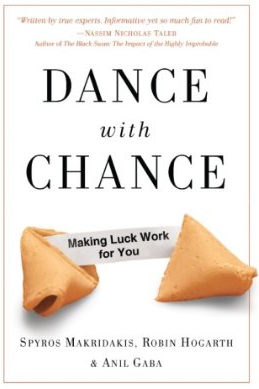
Decision Science News was just at the ESMT Annual Forum in Berlin where we spoke in a session with Martin Weber, Gerd Gigerenzer, Stephan Meier, Luc Wathieu and Robin Hogarth and suddenly remembered that Hogarth, along with INSEAD’s Spyros Makridakis and Anil Gaba, has a new book out called Dance with Chance: Making Luck Work for You.

The book’s Web site has a number of excerpts for free download:

  • Preface (pdf)
  • The illusion of control from Chapter 1: Three Wishes from a Genie
  • Some national puzzles from Chapter 2: The Ills of Pills
  • Mind over medicine from Chapter 3: Getting the Right Medicine
  • The power of luck from Chapter 5: Watering Your Money Plant
  • Mediocrity and failure from Chapter 6: Lessons from Gurus
  • The creative destruction of copper from Chapter 7: Creative Destruction
  • Take a chance on me from Chapter 8: Does God Play Dice?
  • The statistician who ate humble pie from Chapter 9: Past or Future
  • A black Monday and a black swan from Chapter 10: Of Subways and Coconuts – Two Types of Uncertainty
  • Blinking marvelous from Chapter 11: Genius or Fallible?
  • Predicting marital happiness from Chapter 12: The Inevitability of Decisions
  • Increasing the sum of human happiness from Chapter 13: Happiness, Happiness, Happiness

Also fun is this video of the authors chatting with Nassim Taleb. Anil Gaba makes a point in the video which, coincidentally, was Decision Science News’ thesis in our ESMT Annual Forum talk on navigating turbulent times.

“I think one thing that is very, very key is to remove this unwarranted respect for sophisticated models where you get taken in by the technical wizardry and you forget the assumptions”

June 29, 2009

Why are there more women than men in Eastern US cities?

Filed in Ideas
Subscribe to Decision Science News by Email (one email per week, easy unsubscribe)

AND WHY ARE THERE MORE MEN THAN WOMEN IN WESTERN US CITIES?

singles_map

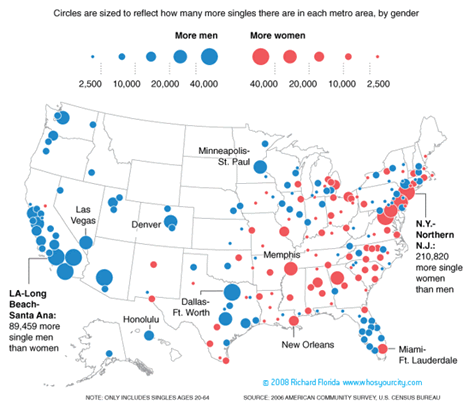
Since seeing this map, Decision Science News can’t quite figure it out. Why do the surpluses of men and women look as they do? What’s up with California?

Source of map:

http://creativeclass.com/whos_your_city/maps/#The_Singles_Map

June 24, 2009

The .12 second search that saves hours at the airport

Filed in Tools
Subscribe to Decision Science News by Email (one email per week, easy unsubscribe)

INFORMATION THAT AIDS TRAVEL DECISION-MAKING

to

If you type the name of an airline and flight number into Google, it tells you the flight status information:

For example, if one types “jetblue 301”, one gets

Track status of B6 301 from Washington (IAD) to Fort Lauderdale (FLL)
24 Jun 2009 – On schedule
Departed: 8:02 AM, Estimated arrival: 10:32 AM

If one types “aa 59”, one gets:

Track status of AA 59 from New York (JFK) to San Francisco (SFO)
24 Jun 2009 – 28 minutes late
Departed: 8:06 AM, Estimated arrival: 10:46 AM

The flight stats information seems to be pulled from http://www.flightstats.com

Who loves you? Decision Science News does!

Photo credit: http://www.flickr.com/photos/fotopakismo/396388128/

June 15, 2009

Postduke

Filed in Jobs
Subscribe to Decision Science News by Email (one email per week, easy unsubscribe)

POSTDOC IN DECISION MAKING AT DUKE FUQUA SCHOOL OF BUSINESS

coverweb

Since the job market for business school profs may be lousy this year, grad students might want to take note of this posdoctoral opportunity at Duke.

Duke University’s Fuqua School of Business invites applications for a two year Postdoctoral Fellowship in the area of Behavioral Decision Making. The postdoctoral fellow will work with Dr. John Payne, Dr. Jim Bettman and Dr. Mary Frances Luce on work related to the impact of emotion on decision making. Planned projects include experimental laboratory research addressing the interaction of different forms and sources of emotion with features of decision task environments. Opportunities will exist to apply this research within medical and financial domains, depending in part on the interests of the applicant. Applicants should have training in experimental construction, design, and analysis as well as a high-quality, ongoing research stream. The position will provide opportunities to interact with faculty across the business school and allied departments at Duke University. Salary and teaching obligations are negotiable; the post doc will have access to health, dental and retirement benefits. Review of applications will begin immediately and will continue until the position is filled. If interested, please email CV to mluce@duke.edu.

June 9, 2009

SJDM 2009 Boston. November 20-23, 2009.

Filed in SJDM ,SJDM-Conferences
Subscribe to Decision Science News by Email (one email per week, easy unsubscribe)

2009 MEETING OF THE SOCIETY FOR JUDGMENT AND DECISION MAKING

sb

LOCATION, DATES, AND PROGRAM
SJDM’s annual conference will be held at the Sheraton Boston Hotel in Boston, MA during November 21-23, 2009. Early registration and welcome reception will take place the evening of Friday, November 20. Hotel reservations at the $175 Psychonomic convention rate can be made by clicking here.Conference fees are yet to be determined. Last year’s fees were $330 for members ($170 for students). Fees this year are anticipated to be the same or (possibly) lower.

2009 CALL FOR ABSTRACTS

The Society for Judgment and Decision Making (SJDM) invites abstracts for symposia, oral presentations, and posters on any interesting topic related to judgment and decision making. Completed manuscripts are not required.

SUBMISSIONS: The deadline for submissions is July 1, 2009. Submissions for symposia, oral presentations, and posters should be made through the SJDM website at http://sql.sjdm.org. Technical questions can be addressed to the webmaster, Jon Baron, at www@sjdm.org. All other questions can be addressed to the program chair, Craig McKenzie, at cmckenzie@ucsd.edu.

ELIGIBILITY: At least one author of each presentation must be a member of SJDM. Joining at the time of submission will satisfy this requirement. A membership form may be downloaded from the SJDM website athttp://www.sjdm.org/jdm-member.html. An individual may give only one talk (podium presentation) and present only one poster, but may be a co-author on multiple talks and/or posters.

AWARDS

The Best Student Poster Award is given for the best poster presentation whose first author is a student member of SJDM.

The Hillel Einhorn New Investigator Award is intended to encourage outstanding work by new researchers. Applications are due July 1, 2009. Further details are available at http://www.sjdm.org.

The Jane Beattie Memorial Fund subsidizes travel to North America for a foreign scholar in pursuits related to judgment and decision research, including attendance at the annual SJDM meeting. Further details will be available at http://www.sjdm.org.

PROGRAM COMMITTEE
Craig McKenzie (Chair), Alan Schwartz, Wandi Bruine de Bruin, Melissa Finucane, Nathan Novemsky, Michel Regenwetter, Ulf Reips, Gal Zauberman, Dan Ariely (SJDM president), Julie Downs (Conference Coordinator).

June 4, 2009

Should we teach statistical rules of thumb?

Filed in Ideas
Subscribe to Decision Science News by Email (one email per week, easy unsubscribe)

THE PROS AND CONS OF TEACHING HEURISTICS FOR STATISTICS

roth

All smart statisticians use rules of thumb. DSN has noticed that as soon as one statistician codifies or pronounces a rule of thumb, smart alecs come along with special cases that violates the rule thereby “proving” the rule and the person who articulated it “wrong”. (Smart alecs love to pretend that those who impart rules of thumb are so dumb as to believe that the rules work in all circumstances).

DSN has noticed that Intro Stats students are hungry for rules of thumb. For instance, they want rules relating the number of predictors to the number of observations in multiple regression. A quick search on the internet finds:

* observations should be at least 10-20 times the number of predictors.
* observations should be 6-10 times the number of predictors
* observations should be the number of predictors plus 104 (I’m not making this up … might be a typo)
* 30 observations for one predictor, then add 10 per predictor
* observations should be > predictors (duh)
* 10 observations per predictor but you can get by with fewer if pairwise correlation between predictors is low
* 10 – 15 observations per predictor

When students ask for a rule of thumb, should we give them one?
Should we not give the rule and explain the tradeoffs they are making?
Should we give the rule and the explanation both? This sounds ideal, but let’s face it, most intro stats students are likely to remember the rule and forget the explanation.

If we don’t impart the rule, we’re not teaching them the practices that we ourselves apply.
If we do, we’re setting them up for the attack of the smart alecs.

What to do?

Photo credit: http://www.flickr.com/photos/boichat/281332467/

May 25, 2009

Update on the job market for Marketing professors

Filed in Jobs
Subscribe to Decision Science News by Email (one email per week, easy unsubscribe)

SURVEY RESULTS ON MARKETING PROFESSOR HIRING FOR THE 2010-2011 ACADEMIC YEAR

mjm

Decision Science News loves Marketing (the academic discipline). Chris Janiszewski and Geeta Menon have continued the wonderful tradition (previously carried out by Peter Dickson) of surveying the world’s marketing departments and finding out how many candidates are on the market, how many schools are hiring, etc. How cool is that? Read Janiszewski and Menon’s survey on the Marketing job market.

The not so wonderful news is that it isn’t a great year to be a job candidate, with a record-setting 3.35 rookies per position. DSN readers can improve their chances by reading Decision Science News’ advice for the marketing job market.

Thank you for participating in the 2009 Marketing Academia Labor Market Survey. We realize there is a lot of uncertainty in the market this year, so we are particularly grateful to you for having responded speedily to this survey to enable us to compile the data before June.

Attached is our summary of the results. Please forward this document to colleagues in your department, your recruiting committee, PhD program coordinators, any PhD students who are on the job market, and to anyone else you think may benefit from this information. Please note that we are only sending this report to one person in each school, so please distribute as you deem fit.

This was our first year conducting this survey; a huge debt of gratitude to Peter Dickson who conducted it for the past 17 years. If you have any questions, please feel free to e-mail either one of us.

Regards,

Chris Janiszewski & Geeta Menon

May 18, 2009

Get to know the Society for Medical Decision Making

Filed in Conferences ,SJDM ,SJDM-Conferences
Subscribe to Decision Science News by Email (one email per week, easy unsubscribe)

AN INTRO TO SMDM

smd

This week, Alan Schwartz and Valerie Reyna provide a bit of information to Decision Science News readers, and people familiar with the Society for Judgment and Decision Making (SJDM) about the Society for Medical Decision Making (SMDM).

As a result of strengthening ties between the Society for Judgment and Decision Making and the Society for Medical Decision Making, SJDM members with interests in decisions around health and health care are encouraged to attend (and submit presentations for) the SMDM annual meeting (for 2009, it’ll be at the Renaissance Hollywood Hotel in Hollywood, CA, USA, October 18-21). This “travel guide” highlights some of the differences between the meetings that you should expect.

About SMDM and its meeting
The Society for Medical Decision Making’s mission is to better understand medical decision making, and to improve health outcomes through the advancement of proactive systematic approaches to clinical decision making and policy-formation in health care by providing a scholarly forum that connects and educates researchers, providers, policy-makers, and the public. Its members include physicians, economists, psychologists, decision analysts, and other decision researchers. Its annual meeting is one year older than SJDM. The two societies had about 50 members in common in 2008.

Meeting format – what’s similar?
Like the SJDM meeting, SMDM features poster sessions, concurrent oral presentation sessions with question and answer time, and symposia. There is a presidential address, a keynote address, an awards presentation, and a social event.

Meeting format – what’s different?
Both SMDM and its meeting are somewhat larger than SMDM. A typical SMDM meeting sees about 560 attendees to SJDM’s 490.

SMDM oral presentations are 15 minutes long (including questions), rather than SJDM’s 20 minutes. Presentation sessions are usually chaired by a society member who is not speaking in the session, and is
responsible for timekeeping.

The SMDM symposium differs from the SJDM symposium. In SMDM, a symposium is usually held as the only session in its time slot, and is organized by the symposium chairs for the meeting. Most often, the chairs seek external funding (e.g., from one of the National Institutes of Health) to support a panel of presenters around a focused theme. In this, they resemble panel-based keynotes.

SMDM also offers (at extra cost) an extensive set of half-day and full-day short courses during the day before the meeting. These courses feature instruction by experts in a variety of methodological and content areas and vary in the level of background required; it is common for senior SMDM members to take short courses as students. Although the catalog of short courses for 2009 is already fixed, SJDM members might enjoy developing and teaching a short course at a future meeting; if that interests you, it’s wise to take a course this year to get familiar with the format.

Cultural notes
Like SJDM, SMDM is considered a very friendly meeting, and encourages presentations by students and trainees as well as more senior researchers. The keen observer of scientific cultures will, however, find several intriguing differences between SJDM and SMDM which reflect the different traditions of social science and medical meetings:

SMDM presidential addresses traditionally tackle broad themes about the Society and its role in health care scholarship, policy, and education, unlike the traditionally data-heavy research talks based on the work of the president at SJDM.

SMDM has a higher registration fee ($410 for members and $560 for non-members in 2008) meeting elements are often supported by external funding. The hotels are often more expensive, concurrent oral sessions provide microphones for the audience, and laptops are provided by the hotel for presenters.
When asking a question of a presenter at SMDM, it is customary to go to the microphone, state your name and institution, and, if possible, offer some brief encouraging words about the value of the research before asking the question. You may also hear people begin their question with “I’m confused”, in tribute to founding (and still highly active) SMDM member Steve Pauker, for whom this has become a trademark phrase. The dress code at SMDM is, on average, slightly less casual. The SMDM social event often involves renting out a museum, aquarium, or other artistic or scientifically-oriented institution, and providing a catered reception with opportunities for discussion that conclude considerably earlier than SJDM’s typical post-midnight last round. (There have been notable exceptions, however, such as the 1997 Houston meeting’s rodeo event complete with barbeque and a cow-chip throwing contest). In 2009, to avoid Los Angeles traffic, the social event will take over the upscale bowling alley next door to the hotel.

Key phrases you may hear at the SMDM meeting

Time-tradeoff and standard gamble: Two common methods for assessing the health-related utility for a person in a given state of health. In time-tradeoff, respondents identify the indifference point between living their full life expectancy in an impaired health state and living a shorter life in perfect health. In standard gamble, respondents identify the indifference point between an impaired health state for sure and a gamble with some probability of perfect health, otherwise death.

Quality-adjusted life year (QALY): A common metric for evaluating the impacts of changing health states on health-related utility over a life time. One QALY is one year of life spent in perfect health (or two years spent in a health state assessed as having utility 0.5, etc.)

Cost-effectiveness analysis: A decision analysis which seeks to minimize the ratio between the cost of a strategy (e.g., a treatment program for a disease) and its health benefit (“effectiveness”), typically measured in $/QALY or €/QALY. Conventionally, interventions with ratios lower than $50,000-$100,000/QALY are deemed “cost-effective”.

The International Patient Decision Aid Standards (IPDAS): A developing international set of criteria to determine the quality of patient decision aids, tools that attempt to improve decision quality by helping patients understand complex information and clarify their own preferences.

For more information about SMDM, including its call for papers, visit http://www.smdm.org

In 2009, there is also a special opportunity for three SJDM members to have travel supported to present their work in collaboration with SMDM members. This has a deadline of May 30, 2009; see http://decision.cybermango.org