Filed in
Ideas ,
R
 Subscribe
 to Decision Science News by Email (one email per week, easy unsubscribe)
BATTING AND AGING
With baseball’s World Series drawing to a close, we thought we’d get in one last 2014 post on the US national pastime.
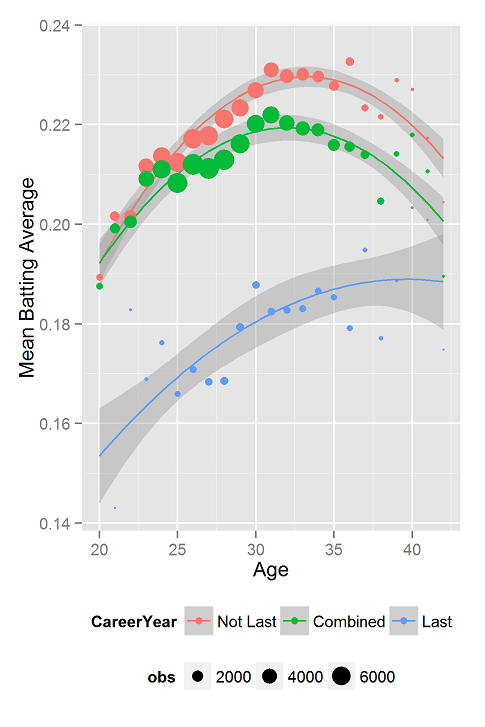
Keeping up with our aging theme, we’ll look at what happens to players’ batting averages as they age. We use the Lahman package in R, which has data from 1871 to 2013. We take the set of players who played in the majors for at least two years and look at the mean batting average at every age.
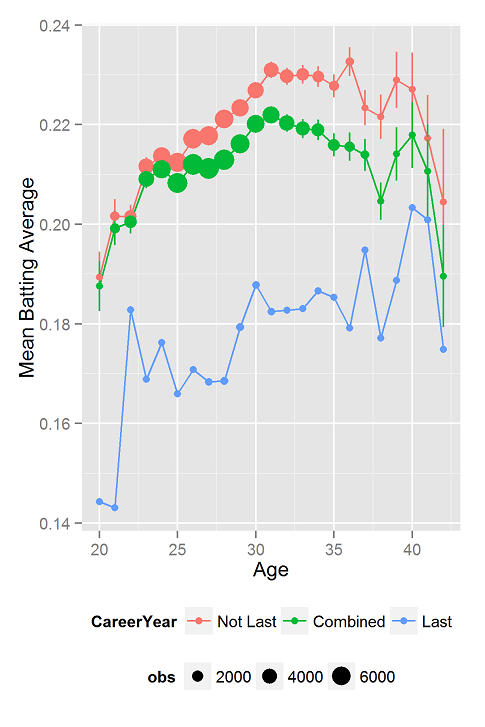
The green line (above, with smoothed plots, below with raw results with standard error bars) shows this basic result. Pro baseball players have their highest averages just over age 30. The area of the circles is proportional to the number of observations in that point.
When you look at results like those in the green line, however, you must stop to consider that the players who show up in the graph only tell part of the story. At a given age, there were other players who are not plotted because they were cut from the team years before (often due to their poor batting performance).
To illustrate this, at each age, I plot in the blue line the batting average of players who are in their last year of major league play. As one would expect, batting averages are low the year before players disappear from the major leagues. In the red line, we see the performance at each age of players who are not in their last year. For this subset of the data, peak batting average occurs at age 36 and the maximum is a bit flatter.
What is up with the increase in the blue line? The increasing trend is present even if you exclude the first two unusually low points. We are no experts on baseball (or sports of any kind) and are open to suggestions.
One thing to keep in mind is that people whose last year was at age 20 probably only played 2 years (I only considered players who played at least 2 years), while people whose last year was age 40 probably played about 20 years.
As usual, those who want to reproduce this in R are welcome to do so.
SOCIETY FOR JUDGMENT AND DECISION MAKING NEWSLETTER

The quarterly Society for Judgment and Decision Making newsletter is ready for download from the SJDM site.
http://sjdm.org/newsletters/
This issue includes the 2014 conference program.
While we have your attention
- Don’t forget to vote in the 2014 SJDM elections. Polls close on October 26.
- Don’t forget to register for the conference, which takes place November 21-24th in Long Beach, CA! Information at http://sjdm.org
Enjoy!
Dan Goldstein
Your Decision Science News / SJDM Newsletter Editor
HEURISTICS FOR ESTIMATING LIFE EXPECTANCY
Life expectancy: The predicted average number of years remaining in a person’s life.
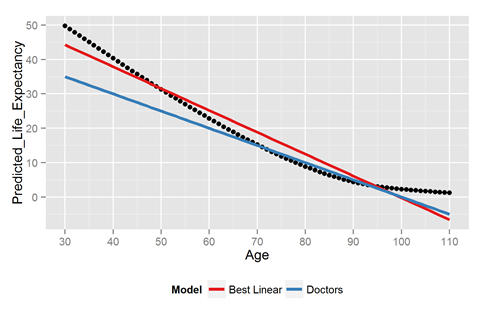
We once learned from a doctor a rule of thumb for predicting how much longer a person will live (i.e., the life expectancy). The doctor’s heuristic was:
(100 minus the patient’s age) divided by 2
We wanted to see how accurate this rule was, so we downloaded life expectancy data from the US government and plotted the model’s predictions against the official estimates of life expectancy. See above. The black dots are the government’s calculated life expectancies at every age from 30 to 110. The doctor’s model is in blue. It’s pretty good in the 65 to 95 age range. The doctor worked in a nursing home. The heuristic fit the environment.That said, the doctor’s rule lousy outside that age range. And of course it assumes people will die by 100.
The doctor’s heuristic is a simple linear model. How well does simple linear regression do? We solved for it and plotted it in red above. We’ll see later how they compare in error, but it’s safe to say they’re both pretty lousy.
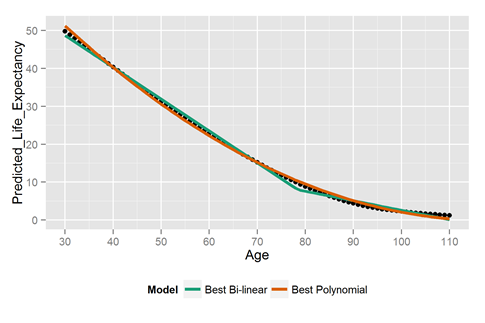
Let’s fit some better models. Forget survival models. Too hard for mortals to apply. Looking at the life expectancy curve, it seems like a polynomial and a two-part linear function would do a good job. They do.
However, our goal is to get something that someone could do in their head. Something like the doctor’s heuristic, but smarter.
We came up with two candidates.
1) The heuristic bi-linear model. We made this by making the best bi-linear model a bit simpler to apply.
It goes:
If you’re under 85, your life expectancy is 72 minus 80% of your age.
Otherwise it’s 22 minus 20% of your age
2) The 50-15-5 model. This one asks you to remember some key values and then to interpolate between those values. It goes:
The life expectancies of 30, 70, 90 and 110 year olds are about 50, 15, 5, and 0.
Go forth and interpolate!
Here is the performance of the heuristic models:
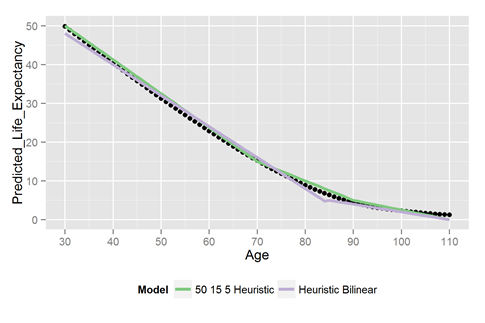
Pretty awesome!
It’s not a horserace without some measure of accuracy. Below we plot the mean absolute deviation for all the models. Except for the linear models, the heuristics make estimates that are off by less than one year on average. That said, one needs to understand that one’s life expectancy is just the best guess, but there’s a lot of variation around that best guess. The 90% confidence interval around my estimated age at death spans roughly 40 years!
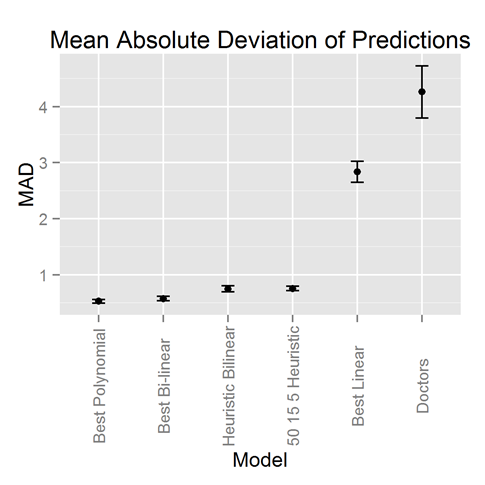
The lesson is, linear fits to life expectancy are bad. Everything else we tested was pretty good. The heuristic bi-linear is especially easy to remember and do in your head.
Can you come up with better heuristics? Here’s some R code to see if you can:
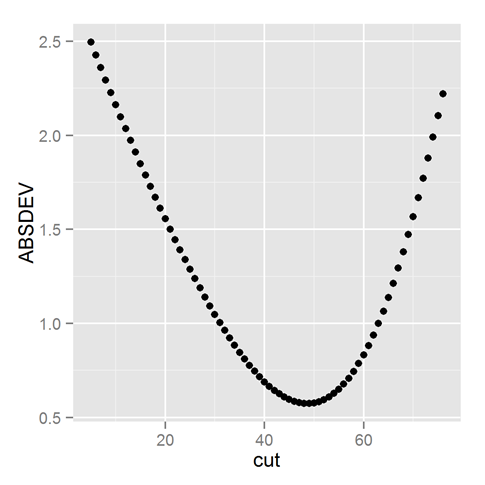
For fun, check out this sweet plot of how the mean absolute error changes as you vary the cut point in the best bi-linear model. The cut point is 30+”cut” in the graph, so we cut around age 80.
ADDENDUM: Dean Foster just stopped by my desk and promoted
Filed in
R ,
SJDM
Subscribe to Decision Science News by Email (one email per week, easy unsubscribe)
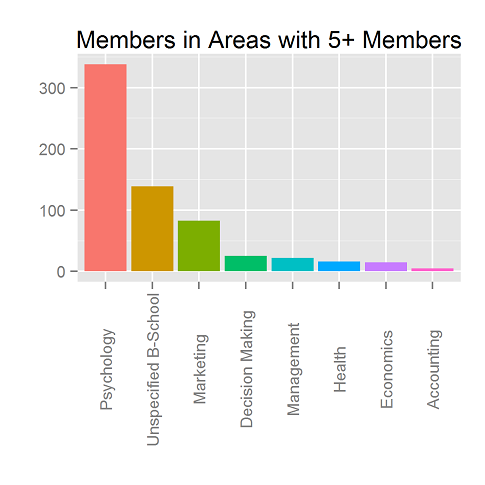
WHERE THE SJDM MEMBERS ARE FROM IN THE WORLD
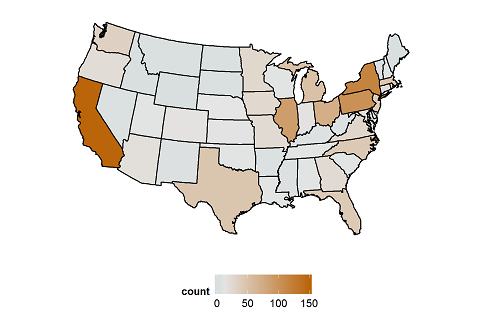
Last week, we looked at where the Society for Judgment and Decision Making members were from in terms of academic areas. This week we look at where they’re from geographically.
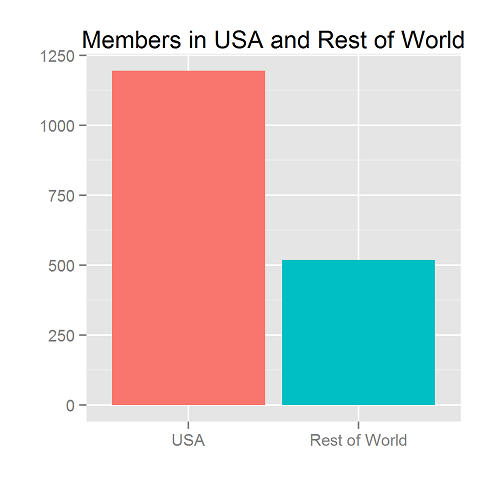
To start, we note that most members (1195/1714 or 70%) are from the USA.
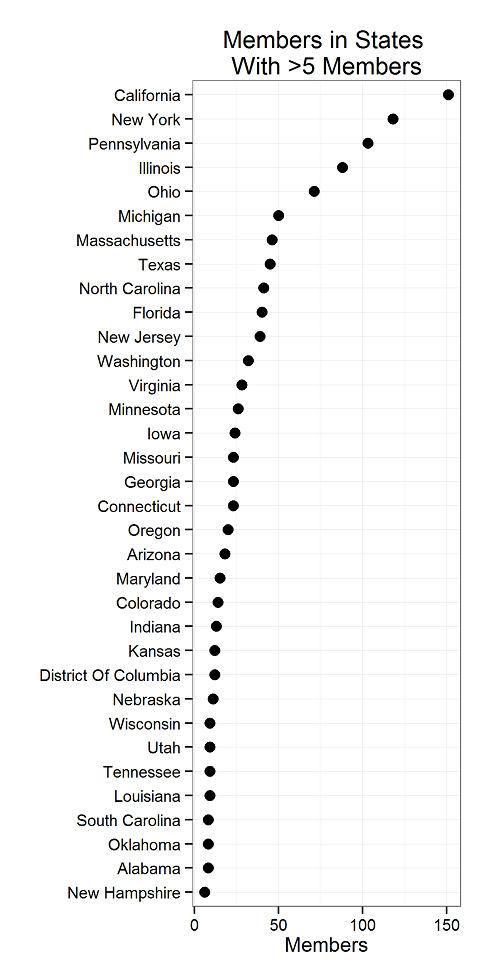
Inside the USA, there are members in 45 states, as seen at the top of the page. The states with more than 5 members are these:
Outside the US, we have members in North America, Europe, Asia, Oceania, South America and Africa.
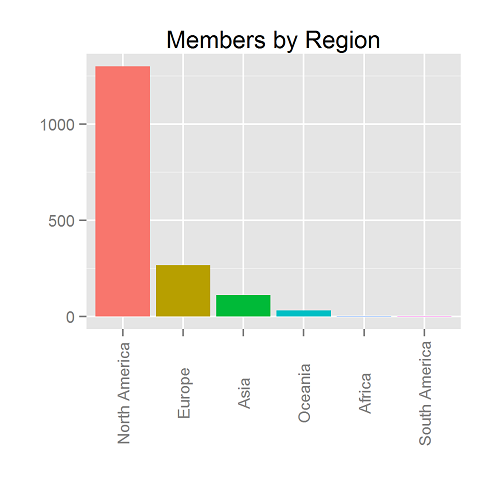
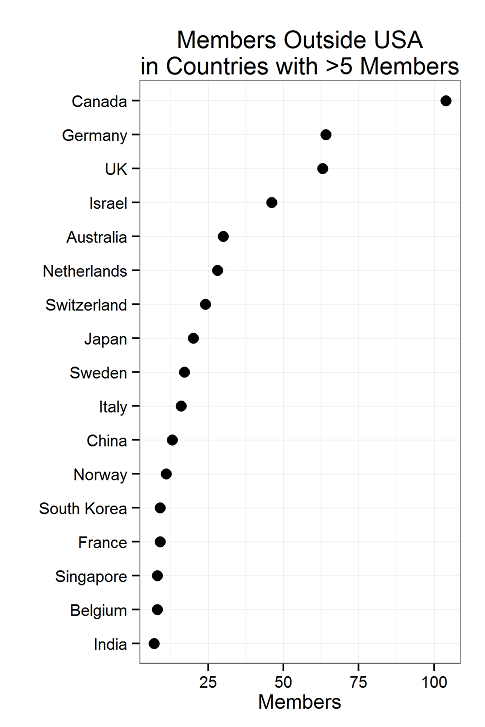
And those regions comprise 39 countries. Here are the countries with more than 5 members.
Now, you’re probably wanting to reproduce these graphs. Or, if you’re like most people, you aren’t.
You’ll need directory.csv.gz, state_table.csv.gz, and regions.csv.gz. And the code below.
H/T to @winston_chang’s R Graphics Cookbook, from which I borrowed a code snippet or two.
Filed in
R ,
SJDM
Subscribe to Decision Science News by Email (one email per week, easy unsubscribe)
ANALYSIS OF SJDM MEMBERS’ DEPARTMENTS
Over the next two posts, we’ll look at the membership of SJDM, the Society for Judgment and Decision Making.
Next week, we’ll break down the membership by region, country, and state.
This week, we look at where our members come from in terms of departments. To make the plot above, we had to do a fair amount of recoding, so results are approximate.
R code is below. You can download some anonymized member information here. Save it to your R working directory to proceed.
R CODE TO REPRODUCE THIS FIGURE
Filed in
Books
Subscribe to Decision Science News by Email (one email per week, easy unsubscribe)
WHAT WE LOOK FOR WHEN WE DECIDE
We have attended hundreds of academic conferences over the years.
We’ve seen all kinds of formats.
We’ve heard many opinions about what’s good and bad.
Here’s what we look for in an academic conference.
- Small – Fewer than 400 attendees is ideal. At large conferences, people get overwhelmed, retreat into their cliques and tend not to meet anyone new. At smaller conferences, people get to know the other attendees. After attending a small conference for a few years, you get to know a substantial proportion of the attendees. Of course, our choosing to attend small conferences only makes them bigger, but we can’t be bothered to think that many steps ahead.
- Few parallel sessions – We look for conferences that have at most 3 parallel sessions. If you sit in the back of the room at a big conference and look on, you’ll notice that people spend amazing amount of time looking through the program trying to decide what to go to next. Big conferences suffer from the cable TV problem: 57 channels and nothing on. With three tracks of quality content, people will spend less time choosing and will tend to choose well even if they choose arbitrarily (like following the person you were talking to at the coffee break).
- Selective – Selectivity predicts quality. Life’s too short to sit through bad talks. We find that conferences with acceptance rates under 30% tend to be better. Organizers should use poster sessions to enable people to come even if their presentations are not accepted.
- Short talks – With short talks, those who are interested in the research can always get more info later, and those who aren’t interested in the research don’t have to suffer. We like the 20-20-3 model: 20-minute talks (at maximum), 20 talks per track (at maximum), and three tracks (at maximum).
- Plenary and Presidential addresses take priority – If deciding whether to accept more talks or have more plenary / presidential addresses, go for the later. The big talks often have the big ideas, and give all the attendees a common experience to talk about during the conference. Having fewer talk slots will increase the average quality of the talks you do accept and will help keep the conference small.
- No presentations during meals – We don’t talk when others have the stage, but we understand why other people do. Conference are rare opportunities to connect with far-away friends and collaborators. It’s kind of cruel not to let people catch up during meals. Presidents deserve a separate session to get their ideas across. They should not have to compete with the clanking of forks and people talking. In banquet halls, half the audience can’t see the speaker anyway.
- Better yet, more meals on your own – Letting people choose where they eat keeps conference costs down and allows each attendee to spend according to his or her preferences. It’s also nice to see more of a city than just a convention hotel.
- Avoid social events that people can’t walk out of – H/T Eric Johnson. Attendees face a lot of constraints. Some are dead tired from international travel. Others need to juggle catching up with family and various groups of people in the city. The social event shouldn’t keep the attendees captive.
- Centrality – Keep in mind that the location of the conference matters when people decide to submit. Don’t forget the Europeans.
Those are our preferences. We’re open for suggestions!
By the way, registration is now open for the 2014 SJDM conference, which will be held November 21-24 in Long Beach. Early-registration (through Nov. 10) is $225 for members, $260for non-members, and $100 for students. Information on the conference can be found at www.sjdm.org — to register, visit www.sjdm.org/join.html.
Our favorite conference, the Society for Judgment and Decision Making (SJDM) Conference, is coming up soon. Our other favorite conference Behavioral Decision in Research Management (BDRM), just went down splendidly in London over the summer. We often hear people say that the SJDM and BDRM conferences are better than other psychology, decision science, consumer behavior, marketing, policy, and behavioral economics conferences. Perhaps this is due to homophily–SJDM is our favorite conference and we tend to hang out with similar others. But perhaps it is due to characteristics. We don’t have data for BDRM, but we can talk about the JDM conference. Here’s what we observe.
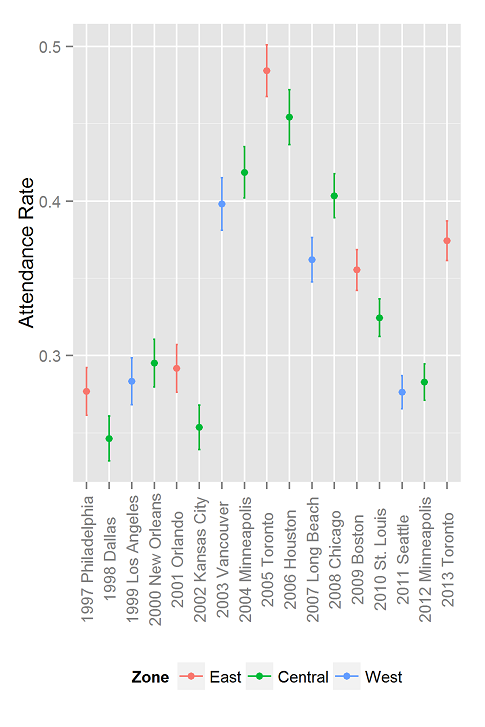
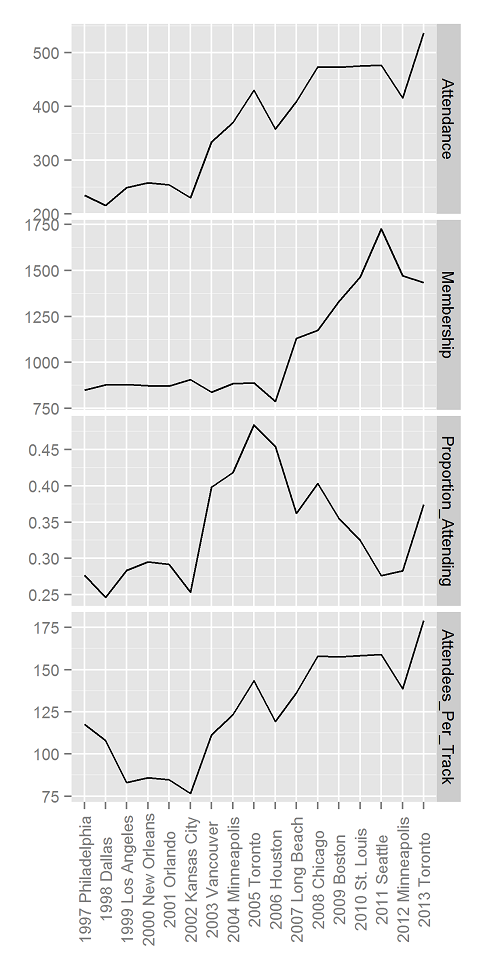
- JDM is small – We have put together some data on JDM attendance over the years (below). Until last year, the conference had fewer than 500 attendees. Pretty sure BDRM has always been similarly small. The Membership panel shows the number of people in the society. Attendance picked up ahead of membership in 2003. Perhaps this has something to do with Kahneman’s Nobel Prize in 2002? Correlation is not causation. We simply remember that around 2005, every grad student in Marketing started saying that they were “doing JDM”.
Click to Enlarge
- JDM has few parallel sessions – We went from two tracks to three in 1999. I will fight to keep it that way.
- JDM is selective – JDM routinely has acceptance rates of less than 30%, despite being a rather specialized and self-selected group of researchers. It also tends to favor people who were not accepted in the previous year. And it has a limit on the number of submissions on which someone can list themselves as a presenter. This keeps people from dominating the program.
- JDM has short talks – 20 minutes is the norm.
- JDM usually has separate Presidential and Plenary talks – Dan Ariely’s talk was the first we remember in which the President didn’t have to compete with a meal.
- JDM has meals on your own – This makes JDM an incredible value for the money. Over the last 5 years, full price registration was $200 on average, and student registration was $98! (Exclamation, not factorial.)
- JDM social events tend to be those people can walk out of – And they tend to be pretty simple. Music, dancing, drinks, done.
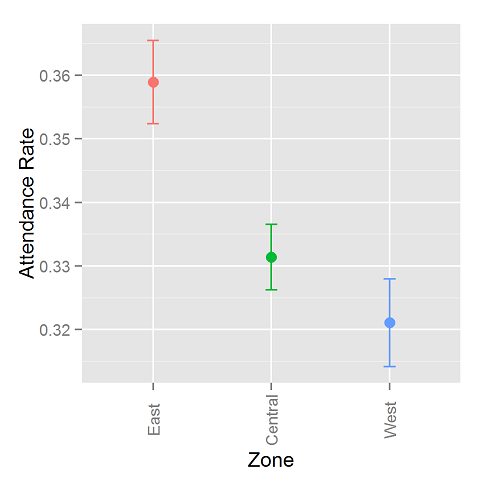
- JDM and location – Because JDM follows the Psychonomics Conference around, it tends to be located in major hubs that are easy to get to. The decision as to whether to break with Psychonomics comes up from time to time, but we always decide to stay. I think it’s a good move. It gives attendees the chance to attend the decision-making sessions at Psychonomics, and it saves the society the decision-making costs of figuring out where to have the conference. Yep, real decision experts consider the decision costs. Psychonomics has a policy of moving like a pendulum across the USA: East, Central, West, Central, East, …. The location does seem to affect attendance. See below and the graph at the top of this post. We think that the high attendance in Canada was because it was easier for many Europeans to get to. The estimated changes in probabilities of attending aren’t that great, so it’s probably not too bad to keep following Psychonomics around.
TO DO YOU OWN ANALYSES IN R
Filed in
Ideas ,
R
Subscribe to Decision Science News by Email (one email per week, easy unsubscribe)
SIMPLY COUNTING OVER 44 YEARS OF DATA
We have a father-in-law who likes baseball. Occasionally, he asks us to figure out things, which we are more than happy to do. The last request was to figure out:
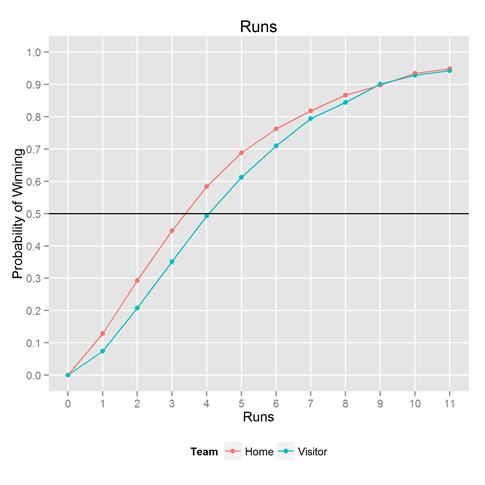
If a team scores X runs, what’s the probability it will win the game?
Luckily, we had the data to solve this problem (as mentioned in past posts). Looking back over 44 years of baseball games, we looked at how often a home team scored 1 run, and counted how often the home team won. We then looked at 2, 3, 4 runs, up to 11 runs. We stop at 11 runs because we only wanted to compute relative frequencies when there’s a decent amount of data. In all our analyses here, we cut the x-axis when there are fewer than 500 observations per bin. We analyzed the visiting team’s scores separately, to see the effect of the home team advantage.
The result is shown above. If you consistently score 3-4 runs a game, you’re winning about half the games. It’s simply not good enough. Going from 2 runs a game to 6 runs a game means going from winning 25% of the time to winning 75% of the time–all the difference in the world.
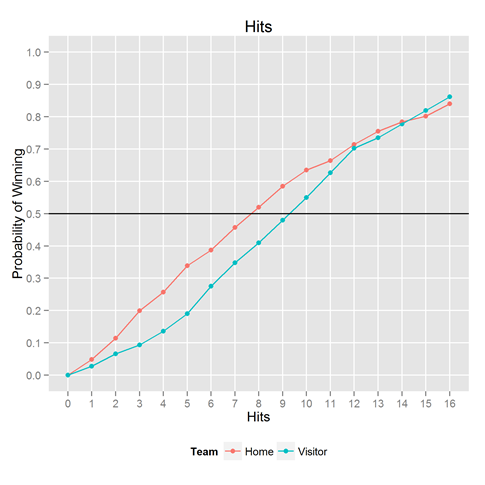
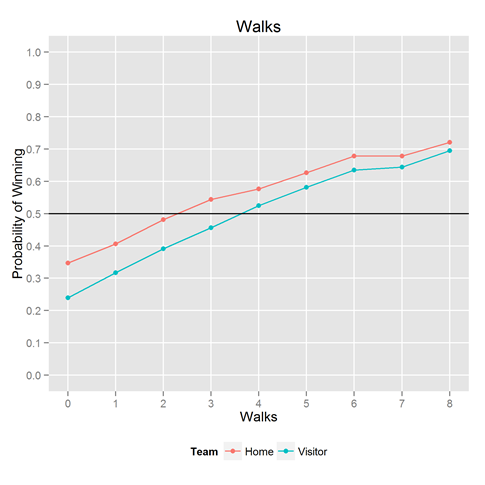
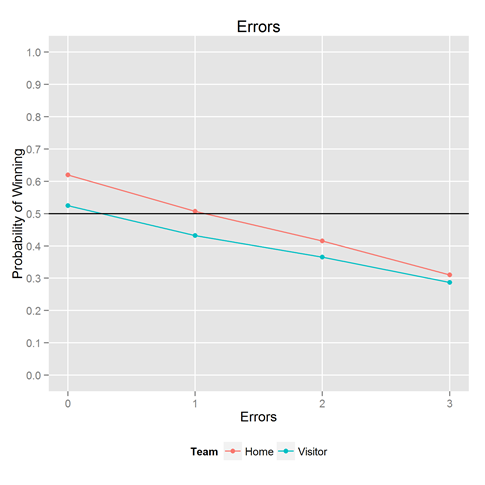
Because we had the data handy, we couldn’t help but looking at the same thing for the other key statistics: hits, walks, and errors. Results below.
Want to play with it yourself? The R / ggplot2 code that made this plot is below. ggplot and dplyr are Hadley Wickham creations.
THE OPTIMAL DECISION SCIENCE FOOD
The question often arises: What is the best decision science food?
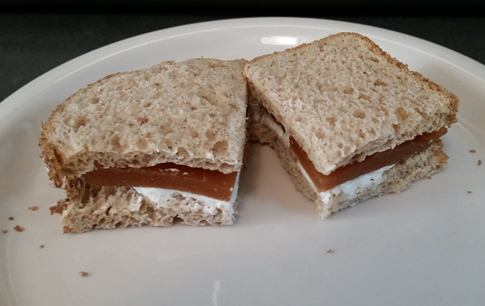
The answer is quite simple. It’s the Romeo and Juliet sandwich, which is an adaptation of the popular Brazilian desert “Romeu e Julieta”. We came across this delicacy quite accidentally last year and noticed a sudden reinvigoration of our decision science faculties. We then modified it slightly to make it easier for those shopping in North America and Europe by substituting cream cheese for Minas cheese. We also turned it into a sandwich, for portability.
Why is the Romeo and Juliet sandwich the perfect decision science food?
Decision science requires concentration, so its practitioners don’t want something that will put them into a food coma. As Benjamin Franklin said “Eat not to dullness“.
Decision science requires long hours at the computer, so its practitioners want something they can eat neatly at their desks.
Decision science requires satisfying multiple objectives, so its practitioners want something that delivers sweet and salty tastes at once.
Ingredients:
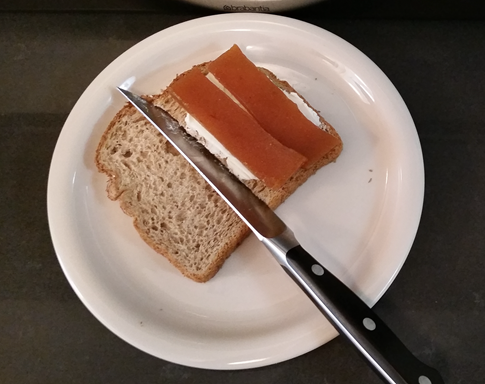
- 1 piece of bread
- White cheese (e.g., queso fresco, canastra, minas cheese, cream cheese)
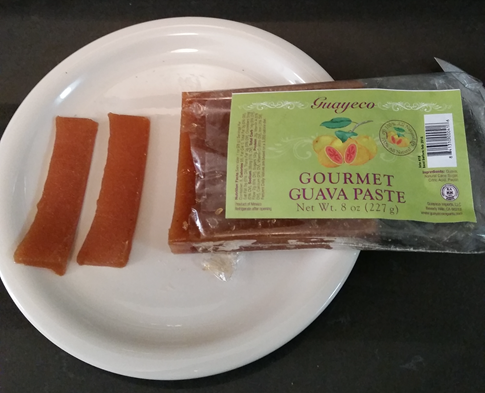
- Guava paste (goiabada)
Directions:
1) Slice off enough guava paste to cover half a piece of bread
2) Cover half the piece of bread with white cheese and lay the guava paste on top of it. Cut the piece of bread in half.
3) Place the remainder bread atop the sandwich. Cut again.
4) Enjoy!
Bonus points:
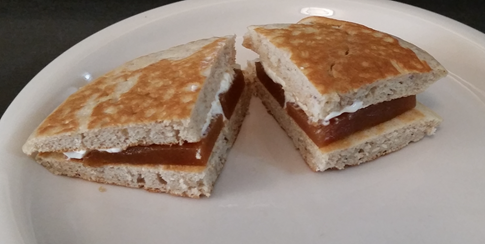
1) Use an almond flour pancake instead of a piece of bread
One of our offspring, despite sharing a name with Romeo and Juliet, refuses to eat the Romeo and Juliet sandwich. The reason given is a dislike of guava paste, which the child has never eaten. Neophobia, or fear of the new, has been used to characterize rats’ preferences for foods (p. 76) and childrens’ preferences for babysitters (p. 87). But please don’t let it stand in the way of your doing better decision science.
HOT COHEN’S D EFFECT SIZE VISUALIZER
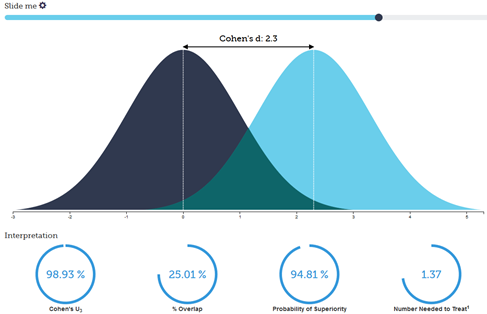
Visualization by Kristoffer Magnusson (@RPsychologist)
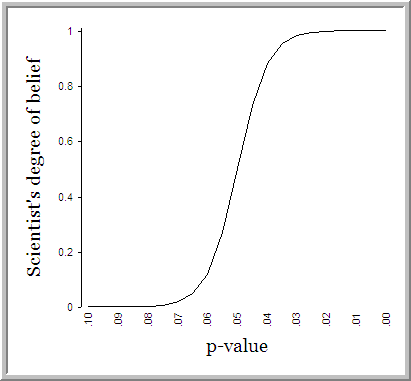
Social science research puts the p-value on a pedestal. The p value, or probability of the data given the null hypothesis is true, is seen as the gateway to publication, giving authors an incentive to “p hack“, or use various tricks to get p-values down below .05. And they do this despite the lord loving the .06 as much as the .05. We have written on this before:
Cartoon by Decision Science News
One gripe with the p-value is that statistical significance is cheap. Most plausible hypotheses become statistically significant when the sample size is large enough. Among other things, statistical significance is a function of sample size. In the age of mTurk-scale data, attaining statistical significance is easier than ever. We have heard it said that that if you draw a line anywhere through the belly of the United States, you’ll find a significant different in height on opposite sides of the line because of the massive sample size. But it may be a puny difference.
Enter the concept of effect size. Effect size gives one a way to think about the magnitude of effects, not just the probability of the data given the null hypothesis (aka, the p-value). One popular measure of effect size, Cohen’s D, is discussed along with in the beautiful visualization pictured above. Learn more from the article It’s The Effect Size, Stupid, from which this post gets its name. And learn why you need lots of data to estimate effect sizes from our friends at Data Colada.