When did same-sex marriage laws become effective by state?

CORRELATION WITH REPUBLICAN VOTING IN THE 2012 PRESIDENTIAL ELECTION
Click to see a larger, stripped down version
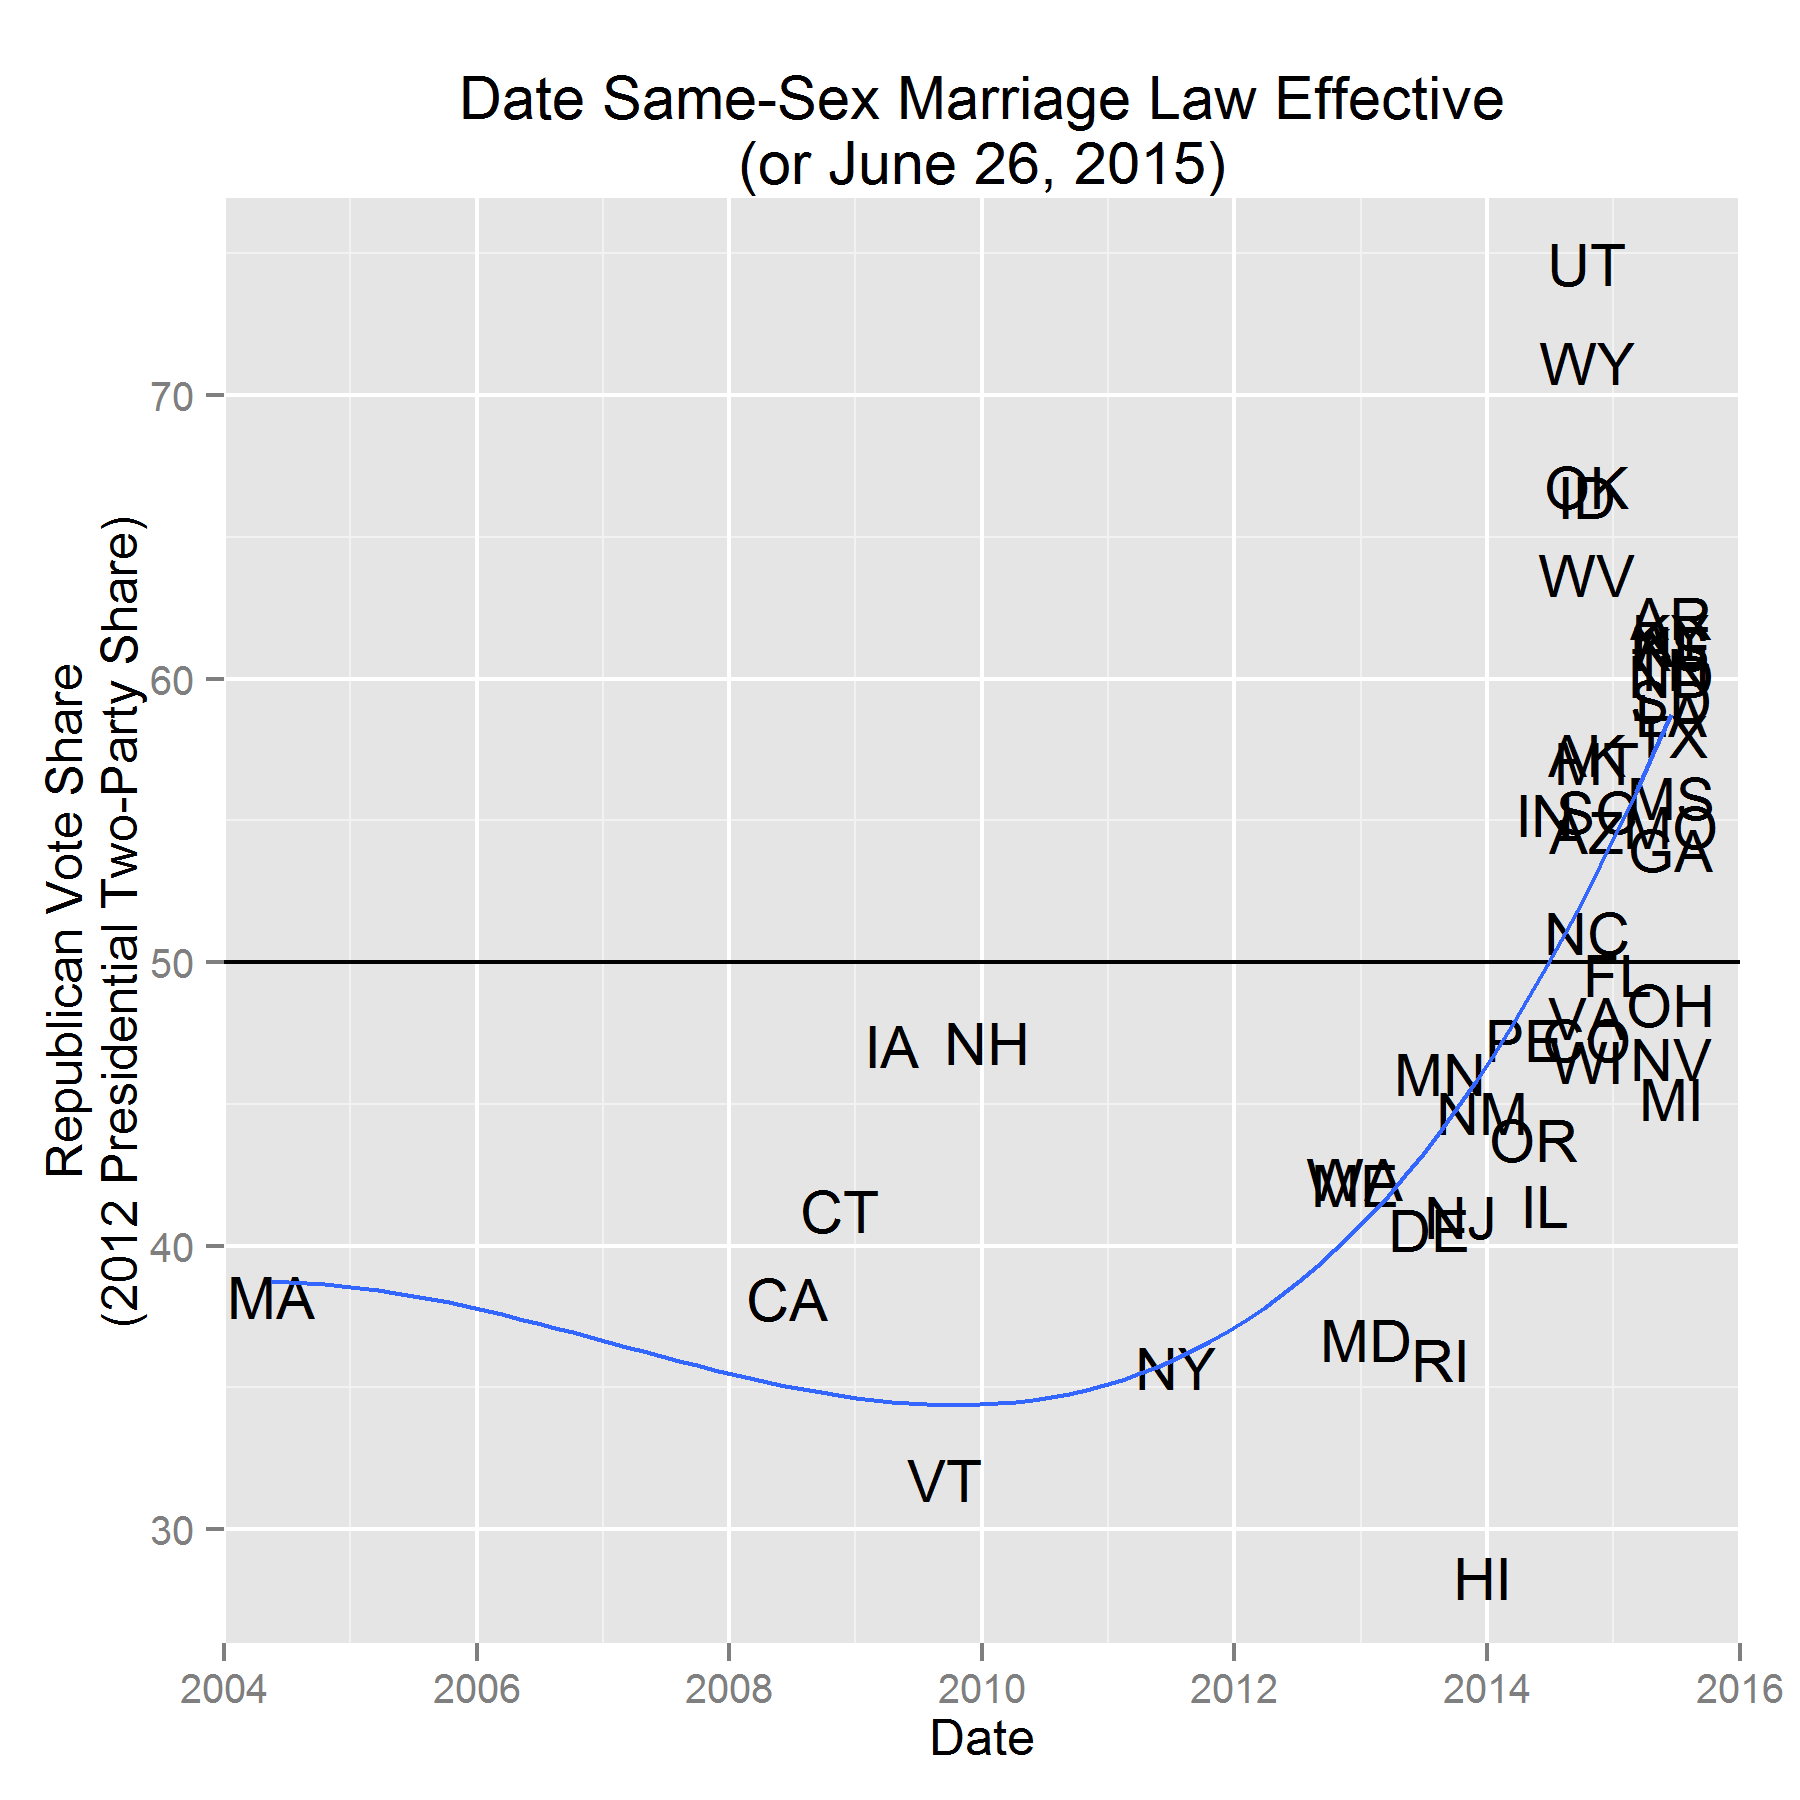
In light of the good news today that the Supreme Court ruled that same-sex couples have the right to marry in the United States, we thought we’d look at when same-sex marriage laws became effective by state (if they did at all) before today.
Noting that same sex marriage is a dividing issue between the left and right in the US, we thought we’d compare the date of when same-sex marriage laws become effective in each state with each state’s Republican (two-party) vote share in 2012. Results are below.
Click to enlarge
Note that California’s same-sex marriage law was effective in 2008, then it was overturned, and then made effective again in 2013. We went with the earlier date because you’ve got to chose something.
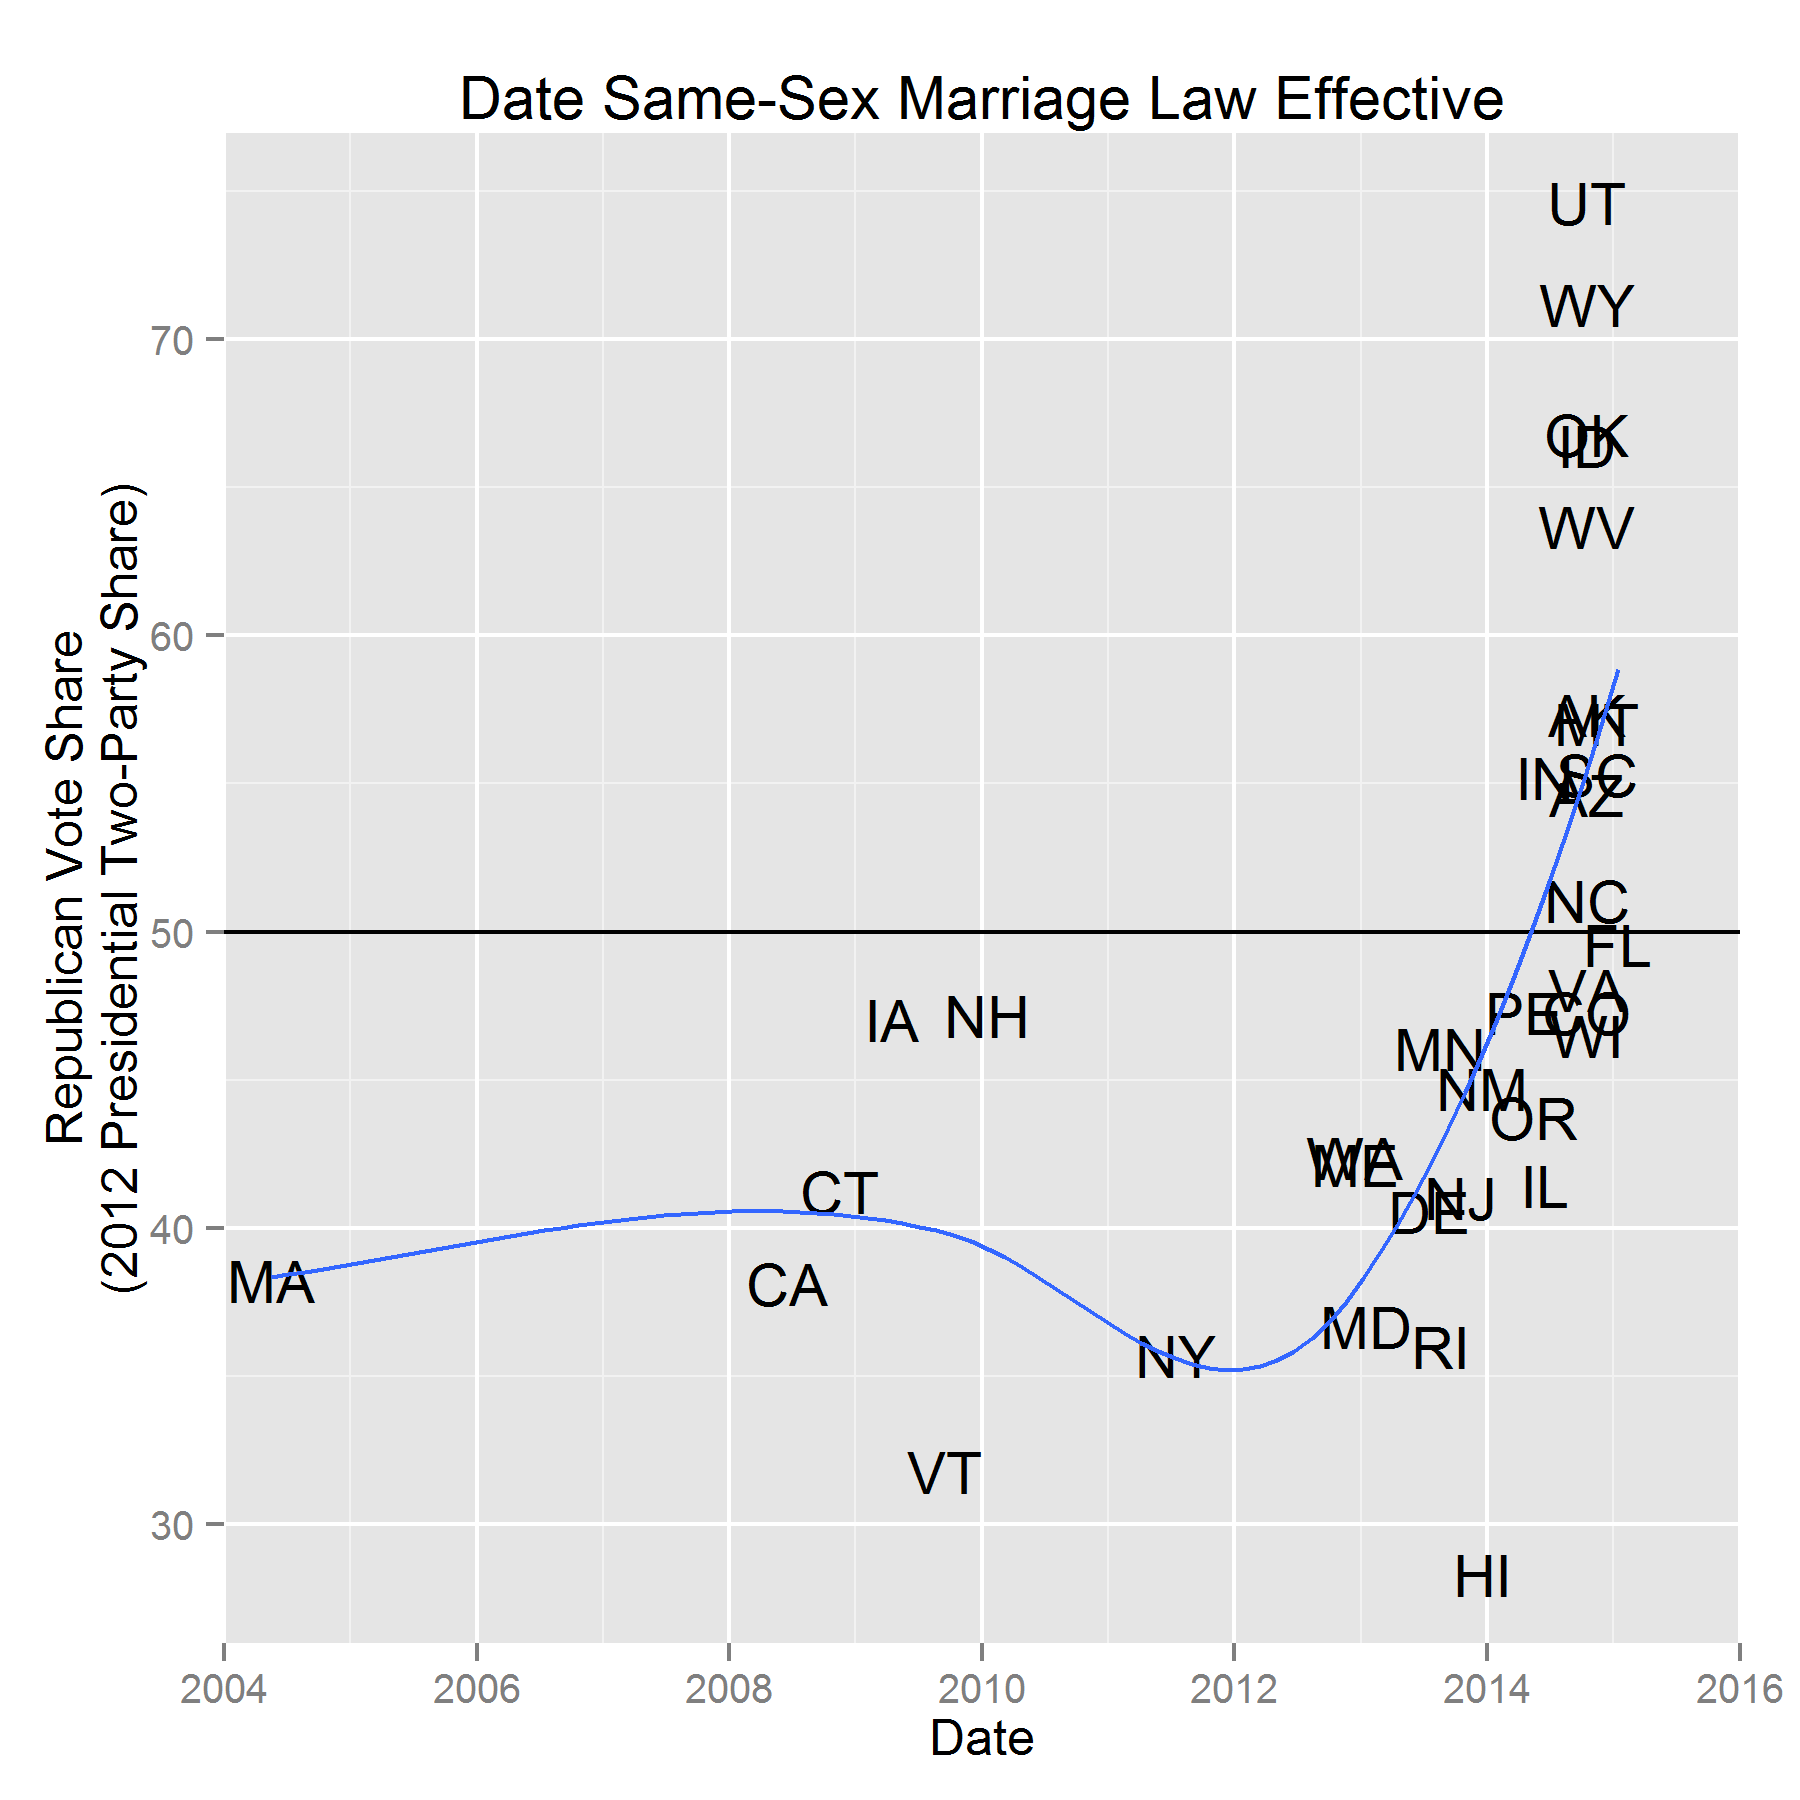
The next question is “what about the states that were added by the Supreme Court decision today”? We made a second plot, below, in which we put today’s date for those states in the “effective date” column. The result is pretty much the same. See at the top of the post the ribbom plot contributed by David Lallemant in the comments.
It is interesting to note that none of the plurality Romney-voting states had same sex marriage laws in effect before 2014.
A couple last things. You probably want to see the data, because the graph can be hard to read.
THE DATA
Or you can get the data and the R code both
R CODE


Hi,
Cool and timely plot. I took the data and replotted it with a rainbow curve. Code is here:
df$effective_date = with(df,year_effective+(month_effective-.5)/12)
m=lm(republican_vote~poly(effective_date,3),df)
plotyears=seq(2004,2016,by=0.1)
p=predict(m,newdata=data.frame(effective_date=plotyears))
df2=data.frame(x=plotyears,y=p)
myalpha=0.7
p2=ggplot(df2,aes(x=x,y=y))+
geom_ribbon(aes(ymin=y-8,ymax=y-6, x=x), fill=”violet”,alpha=myalpha,colour=NA)+
geom_ribbon(aes(ymin=y-6,ymax=y-4, x=x), fill=”blue”,alpha=myalpha,colour=NA)+
geom_ribbon(aes(ymin=y-4,ymax=y-2, x=x), fill=”turquoise”,alpha=myalpha,colour=NA)+
geom_ribbon(aes(ymin=y-2,ymax=y-0, x=x), fill=”green”,alpha=myalpha,colour=NA)+
geom_ribbon(aes(ymin=y,ymax=y+2, x=x), fill=”yellow”,alpha=myalpha,colour=NA)+
geom_ribbon(aes(ymin=y+2,ymax=y+4, x=x), fill=”orange”,alpha=myalpha,colour=NA)+
geom_ribbon(aes(ymin=y+4,ymax=y+6, x=x), fill=”red”,alpha=myalpha,colour=NA)+
geom_ribbon(aes(ymin=y+6,ymax=y+8, x=x), fill=”pink”,alpha=myalpha,colour=NA)+theme_bw()+geom_text(aes(label=state_abbrev, x=effective_date,y=republican_vote),jitter=TRUE, data = df)+labs(x=”Date”,y=”Republican Vote Share”,title=”Date Same-Sex Marriage Law Effective”)
p2
June 27, 2015 @ 7:51 pm
That’s awesome! Making it the lead image.
June 28, 2015 @ 2:49 pm