Visualize Prospect Theory
Filed in Programs ,R
 Subscribe to Decision Science News by Email (one email per week, easy unsubscribe)
Subscribe to Decision Science News by Email (one email per week, easy unsubscribe)
INTERACTIVE R TOOL FOR GRAPHING PROSPECT THEORY AND MORE
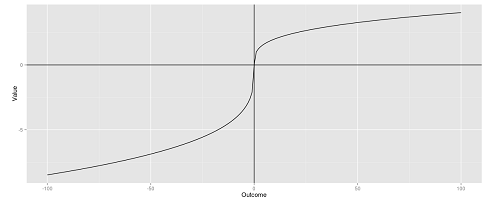
Dan Wall from Columbia University’s Center for the Decision Sciences (*) writes in that he’s developed a new Web app using Shiny and RStudio. It allows users to edit Prospect Theory and Quasi-Hyperbolic Time Discounting Parameters and see the resulting changes to the graphs.
Try it out!
https://decisionsciences.shinyapps.io/Shiny/pt_qtd_shiny.Rmd
We find that it’s great for learning about the function and also great for generating Prospect Theory graphs to include in articles and chapters!
Dan used shinyapps to publish it to the website.
(*) Shout out to CDS, where Decision Science News was launched about a decade ago.

