1.5 percent of doctors, a quarter of malpratice reports
 Subscribe to Decision Science News by Email (one email per week, easy unsubscribe)
SOME DOCTORS GET MORE MALPRACTICE SUITS THAN OTHERS
A month ago, we reported on a paper looking at complaints against doctors which found that 3% of doctors receive about half of the complaints.
This prompted our friend Jim, who is a lawyer, and a good one, to email, “you want to look at real complaints, check this out, it’s got lawsuits against doctors. So we did. This turned out to be the National Practitioner Data Bank, a publicly available database of complaints among doctors and other professions.
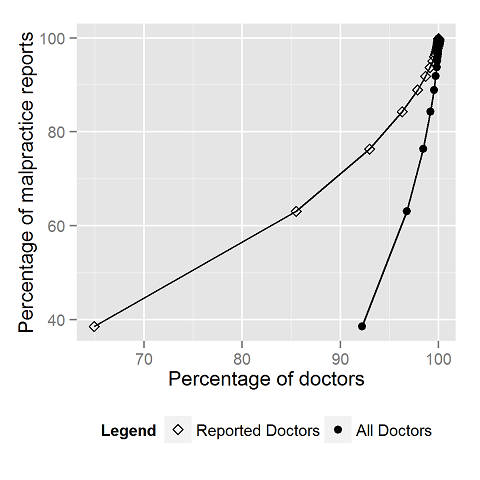
We did the same analysis as in the paper cited last month, except that now we looked at malpractice reports filed against doctors in the United States. The result, shown in the graph above, is that malpractice reports are quite skewed as well. (See last month’s post for some useful annotations that may help reading the graph). Our takeaway is for malpractice reports:
1.5% of doctors receive 24% of malpractice reports
3.2% of doctors receive 37% of malpractice reports
7.8% of doctors receive 61% of malpractice reports
22.2% of doctors receive 100% of malpractice reports (i.e. 78% of docs receive none)
This was kind of a quick and dirty analysis, so no guarantees this is correct. If you’re interested in the data, drop us a line.
Powerlaw fans (and there are so, so many out there) may want to know that the data plot out thusly on a log-log scale:
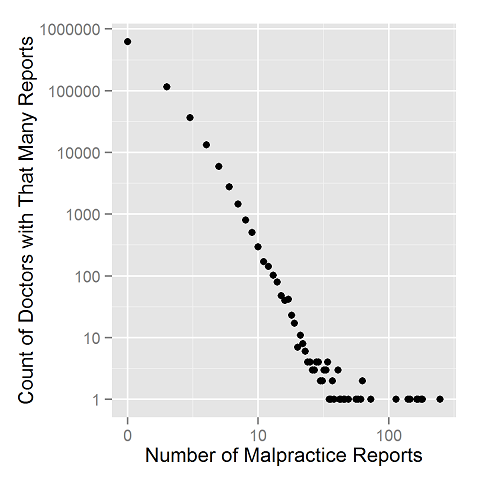
Plots were made using the R language for statistical computing and Hadley Wickham‘s ggplot2 package.


Your article claims “1.5% of doctors receive 24% of malpractice reports”. But your graph seems to start at 65% of doctors and 38% of malpractice reports.”
May 15, 2013 @ 7:49 pm
See the third point from the bottom on the all doctors curve. There are 1.5% of doctors to the right of that point (100-98.5), and 24% of complaints above that point (100-76). I agree this graph is hard to read. I’m just copying the way they formatted it in the other post (see the links). Open for suggestions about how to do it better.
Most accurately, it should say that the 1.5% of most reported against doctors account for 24% of malpractice reports.
May 16, 2013 @ 12:10 am
patient<-c(rep(1,1000), rep(0,99000))
doctor<-rep(1:1000,each=100)
plot(table(sort(tapply(sample(patient),factor(doctor),sum))))
May 26, 2013 @ 4:32 pm