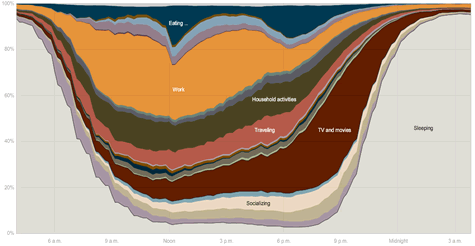
What do people do all day?
Filed in Research News
 Subscribe to Decision Science News by Email (one email per week, easy unsubscribe)
 Subscribe to Decision Science News by Email (one email per week, easy unsubscribe)
THE DECISION OF HOW TO SPEND TIME

The neatest visualization of the last 30 days has to be this New York Times interactive graphic showing how different groups of people decide to spend their time. It is based on data from the American Time Use Survey.
Play with it and read the related article. Decision Science News assures you it will be worth your time. Ha.
Wouldn’t it be great if the talented folks who design and program these things would team up with decision scientists to design interactive experiments that are their own reward? See our attempts here. Not as impressive as the above, but a start.

