Judgment and Decision Making, Vol. 11, No. 3, May 2016, pp. 260-274
The impact of time limitation: Insights from a queueing experimentAnna Conte* Marco Scarsini# Oktay Sürücü$ |
We experimentally explore the effects of time limitation on decision making. Under different time allowance conditions, subjects are presented with a queueing situation and asked to join one of the two given queues. The results can be grouped under two main categories. The first one concerns the factors driving decisions in a queueing system. Only some subjects behave consistently with rationality principles and use the relevant information efficiently. The rest of the subjects seem to adopt a simpler strategy that does not incorporate some information into their decision. The second category is related to the effects of time limitation on decision performance. A substantial proportion of the population is not affected by time limitations and shows consistent behavior throughout the treatments. On the other hand, some subjects’ performance is impaired by time limitations. More importantly, this impairment is not due to the stringency of the limitation but rather to being exposed to a time constraint.
Keywords: time pressure, decision times, join the shortest queue, experimentation
In today’s fast paced world, many economic situations require quick and efficient judgments and decisions. Traders on financial markets, for example, feel the time pressure severely since the speed of their reaction to new information is of great importance. Some other actors who are exposed to time pressure are negotiators, last-minute bidders, managers, and even customers in a retail store, since they have to rapidly decide to which cashier counter queue to join in order to avoid negative externalities from potential newcomers.
When decision makers have less time than needed (or perceived as needed), they may feel stressed (Hammond [2000], Svenson and Maule [1993]). This stress, in turn, may affect performance. Individuals may also differ in their reactions to the stress caused by time limitation (Payne et al. [1988], Svenson and Maule [1993], Verplanken [1993]). Some may perform worse than they would under no time pressure while others may do better thanks to the stress-induced stimulation (Rastegary and Landy [1993]). The primary goal of this paper is to experimentally explore the effects of time limitation on decision performance and investigate possible heterogeneity in coping with time limitation.
In our experimental setting, we consider a queueing situation. Queues are formed, and customers have to wait, whenever the capacity of a service provider fails to meet the instantaneous demand. In everyday life we encounters queues when buying museum or concert tickets, conducting a transaction in a bank, calling a hotline, entering in a popular restaurant or club, etc.
Waiting in a queue is irritating, frustrating and, hence, costly. Therefore, a customer may decide to balk at the prospect of waiting or to abandon the queue after joining and waiting for a while. Moreover, customers may even be willing to pay extra in order to decrease or eliminate waiting times. Visitors of a Six Flags amusement park, for example, can buy one of three types of pass (Regular, Gold and Platinum), in order to eliminate physical wait in queues and reduce the actual waiting time. A driver without any passenger can pay a fee and use high occupancy vehicle (HOV) lanes that are originally designed for carpools of two or more.
What determines customer behavior is the comparison between the expected benefit of getting the service and the expected cost of waiting. Under the assumption of full rationality, this comparison is made by extracting information about the length, velocity and the entry fee of a queue. However, it is questionable whether people behave rationally and use the information they could extract when making a queueing decision. The secondary goal of the present study is to shed light on this issue by analyzing the characteristics of queues to which people pay attention when making such a decision. More specifically, we aim at answering the question of whether customers accurately calculate the costs and benefits of joining a queue and make their decision accordingly. If this is not the case, what is the behavioral pattern followed? Which aspects of queues play important roles and affect decisions?
Our choice of the experimental setting, a queueing situation, makes it easier for subjects to understand the experiment since it is a familiar set-up they encounter in daily life repeatedly. Furthermore, the queueing decision task requires no strategic thinking. It is a binary choice where one alternative is often better than the other. However, it requires cognitive abilities to correctly evaluate the two given alternatives. The non-strategic feature of the queueing task sets the stage for analyzing the impact of time limitation on the basics of a decision making process. More importantly, understanding how customers behave in a queueing system helps to determine how to operate a system in the most efficient way. According to Hillier and Lieberman [2001], 37 billion hours per year are spent waiting in queues in the US, which would amount to 20 million person-years of useful work per year, if it were spent productively. It is thus important to design queueing systems based on customers’ behavior.
In this article, we experimentally study and analyze customers’ behavior within a simplistic queueing system. In a computerized laboratory setting, we ask subjects to choose between two given queues, each of which is connected to a different server. The servers provide the same service but they differ in speed, length and entry fee, which is the amount one has to pay in order to join that queue. There are 40 variants of the queueing task, and to examine the impact of time limitation on customers’ choice each variant is repeated three times under different treatment conditions of time allowance: 5 seconds (5sec), 10 seconds (10sec) and no time limitation (NTL). The within-subject design allows us to investigate how individuals respond to changes in the level of time limitation.
We analyze the data by means of a finite mixture model. The mixture approach enables us to identify whether there are subjects in our sample who use all the provided information efficiently, that is, perform consistently with the principles of rationality, and subjects who use alternative decision criteria, and, in this case, which ones.
Our experimental analysis suggests that only a proportion of the population seems to make choices exploiting information at best and acts as “profit maximizers”. The size of this group decreases as time limitation becomes stringent. The remainder of the population appears to consider only a part of the provided information when making their decisions concerning the queue to join. These subjects, who ponder information in a less-than-efficient way, are referred to as "naïve". What is interesting here is that, even though it is explicitly given, naïve subjects seem not to incorporate the information about the average waiting times into their decisions, and tend to join the shorter queue. The existence of this type of behavior is also supported by a field experiment conducted by Lu et al. [2013] at a grocery store deli counter.
From the analysis of the actual decision times, we find that the decision time significantly changes across treatments, and in particular it increases as time limitation is relaxed. Moreover, maximizers take more time than than naïve subjects in any treatment. Another interesting result we obtain is that, when we introduce time limitations, decision performance worsens significantly even if the time allowance is more than what is used under the no time limitation treatment. This observation supports the idea that it is the existence of a limitation but not the insufficiency of the time allowance that harms the performance.
Our results mirror somewhat those obtained by Rubinstein [2007] in game situations. Rubinstein invited the audience in some of his lectures to participate in web-based experiments (e.g., beauty contest, ultimatum game, centipede game, and so on), recording their response time. From the collected data, he infers that the choices that require cognitive reasoning require more time than those made instinctively. However, Rubinstein admits some potential criticism to his approach, and in particular he points out the effect of individual heterogeneity. The present study overcomes this by collecting several observations per subject and by means of a panel estimation approach which controls for individual-specific effects.
Another study that provides similar results to ours is Conte et al. [2014]. It examines decision times in the context of an experimental investigation of multiple prior models of behavior under ambiguity, distinguishing among four different types of decision maker. The analysis reveals that the easier the preference functional subjects seem to apply, the less time they take to make a decision between ambiguous lotteries.
The characterization of customer behavior analyzed in this article provides useful inputs and suggestions for researchers as well as practitioners. The different effects of time limitation on individuals raise the question of whether it is possible to design a mechanism that screens and discriminates customers. The effects of this type of discrimination on the profit of a principal and on welfare could be further investigated. Moreover, our findings potentially pave the way for further research on queueing behavior in more complicated settings.
The paper is organized as follows. Section 2 provides a historical overview and discusses the research papers that we think are most closely related to the present study. The experimental design and procedures are discussed in Section 3. Section 4 outlines the characteristics of the sample, describes the econometric model of the choice data and presents our results. Section 5 concludes with a discussion.
Psychological literature has long investigated the impacts of time pressure (Svenson and Maule [1993], Hammond [2000], Ariely and Zakay [2001]), coming to the conclusion that individuals cope with stress due to time pressure mainly in the following three ways: (i) Acceleration, processing information at a faster pace (Ben Zur and Breznitz [1981], Payne et al. [1988]); (ii) Filtration, neglecting some information and processing only a subset of information that is perceived as most important (Wright [1974], Ben Zur and Breznitz [1981], Bouml;ckenholt and Kroeger [1993], Rieskamp and Hoffrage [2008]); and (iii) Adaptation of different strategies or decision rules, switching to a simpler strategy, as from an alternative-based to a less cognitively demanding attribute-based processing strategy (Zakay [1985], Payne et al. [1988], Svenson et al. [1990], Payne et al. [1993]). Ben Zur and Breznitz [1981] argue that people may view combining acceleration and filtration as the optimal strategy when under time pressure. Furthermore, Payne et al. [1988] maintain that there might be a hierarchy of responses to time pressure. First, people may engage in acceleration and try to respond by working faster. If the pressure is too high and acceleration does not suffice, they may next filter available information and consider only a subset of it. If this is still insufficient, they may change strategy and opt for a simpler one.
Empirical evidence has indicated that there might be individual differences in how people adapt to time pressure (Kaplan et al. [1993], Rastegary and Landy [1993], Stiensmeier-Pelster and Schuuml;rmann,Verplanken [1993]). The experimental results presented by Stiensmeier-Pelster and Schuuml;rmann support the idea that some people respond to time pressure by filtrating information, whereas others by accelerating the process.
In economic literature, however, the impact of time pressure on decision making has received little attention. Its effect on risk attitude is investigated by a few studies, and contradictory results have been reported. While Young et al. [2012] show that time pressure increases risk-seeking behavior in the gain domain, Kocher et al. [2013] find no time pressure effect on risk attitudes for gains, but an increase in risk aversion for losses. Furthermore, a few studies demonstrate the negative impact of time pressure in strategic interactions. De Dreu [2003] finds evidence that perceived time pressure reduces efficiency in negotiation by weakening people’s motivation to process information. Sutter et al. [2003] consider bargaining behavior in an ultimatum game under time pressure and conclude that time pressure has high efficiency costs since it leads to significantly high rejection rates of offers. Kocher and Sutter [2006] show that in an experimental beauty-contest game, the rate of convergence to equilibrium and payoffs are lower under high time pressure than under low time pressure. Finally, in learning based tasks, empirical evidence indicates that subjects under time pressure perform worse than without such constraints (Cella et al. [2007], DeDonno and Demaree [2008]).
Another strand of related literature concerns Queueing Theory. The birth of Queuing Theory dates back to 1909, when Agner Krarup Erlang (1878–1929) published his pioneering work on telephone traffic. Since then, his contributions have been widely applied in many different fields. In economics, the first main contribution is due to Naor [1969]. In the simplest queueing model, customers arrive at a server according to a Poisson process with rate λ and are served by a server with rate µ. When a customer arrives, if the server is idle, then the service starts immediately, otherwise the customer stays in a queue until all the customers who arrived before her have been served. This model is expressed as M/M/1, to indicate that both arrival and service times are Markovian and there is only one server. When λ ≥ µ, the system explodes in the long run, that is, queues tend to grow unboundedly. In a slightly more complicated M/M/c model, there are c servers. The arrival and service times are Markovian, as before. When a customer arrives, if she finds an available server, she starts being served immediately, otherwise she stays in a queue. As soon as one of the servers becomes idle, the customer who has been in the queue longer starts being served. More complicated models can be studied by changing the stochastic assumptions about arrival and service times or by assuming that customers may have to go through more than one server, which happens, for instance, in an amusement park. In the above models, customers have no active role and make no strategic decisions.
More recently, strategic models for queues have been considered. In these models, customers can make decisions like joining a queue or balking, staying in a queue or reneging, choosing one server or another. These decisions can happen under different informational conditions. For instance, customers may observe the length of the queues, as for instance in a supermarket, or they may be informed about the expected waiting time, as in some call centers, or they may know nothing at all, etc. When customers make decisions in queues, they need to take into consideration the behavior of the other customers, since each customer’s waiting time depends on everybody’s decision. This explains why game-theoretic concepts of equilibrium are used in these models. We refer the reader, for instance, to Gross [2008] for classical non-strategic queueing models and to Hassin and Haviv [2003], Hassin [2016] for strategic models.
The few experimental studies on Queueing Theory can be divided into three groups. The first group includes experiments in which the assumption of exogenous arrival times is relaxed. The key finding for customer behavior in such a set-up, where agents decide on their arrival times in case they want to join a (unobservable) queue, is that there is a strong support for mixed-strategy equilibrium play only at the aggregate but not at the individual level (Rapoport et al. [2004], Seale et al. [2005], Stein et al. [2007], Daniel et al. [2009], Rapoport et al. [2010]). The second group consists of experiments in which the quality of the service is not perfectly known. Strong evidence shows that waiting time and length of a queue are positive predictors of quality perception, satisfaction and purchase intentions when quality is uncertain (Koo and Fishbach [2010], Giebelhausen et al. [2011], Kremer and Debo [2013]). Experiments that question the psychological impact of waiting in a queue fall into the third group. Some of the key findings in this group are that the way time is treated depends on the context, agents are risk-averse in the domain of losses (Leclerc et al. [1995]), congestion aversion is more dominant than risk aversion (Kumar and Krishnamurthy [2008]), and there is a decrease in inequality aversion and an increase in negative reciprocity after being exposed to unoccupied waiting time (Oxoby and Bischak [2005]).
Our paper differs from the above-mentioned studies on time pressure in that we do not consider risk attitude, learning or strategic decisions. In order to investigate the pure impact of pressure induced by time limitation, we go to the basics and analyze a non-strategic decision. We use a within-subject design that allows us to investigate individual’s reactions to different levels of time limitation. The experimental task we use is a binary choice where one of the alternatives may be better. However, cognitive abilities are required to be used to correctly evaluate alternatives. We examine the effects of time limitation on such a primitive decision process that includes no strategic interaction. Furthermore, this study differs from the aforementioned queueing theory literature in that it analyzes the behavior of a customer who finds herself in a basic queueing environment and focuses on the aspects she considers when making a queueing decision. In our setting, the quality of the service is perfectly known and therefore, the length of a queue does not serve as a signaling device. (Lu et al. [2013]) is strongly related to our paper. Their empirical study analyzes customers’ purchasing behavior in a queueing environment through a field experiment conducted at a deli counter of a grocery store. One of the key findings of this study is that queueing decisions are based mainly on the length of queues rather than their speed. This particular result chimes nicely with our experimental finding that some subjects do not appear to incorporate server speed information into their decision criterion.
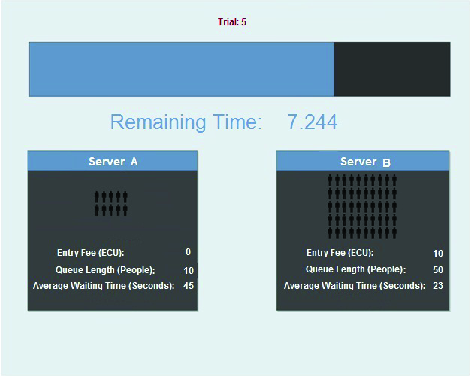
In a computerized laboratory setting, we asked subjects to choose between two queues, each characterized by three attributes: length, speed and entry fee. The length information, the number of people waiting in the queue, was given both numerically and visually using figures. Information about speed, how fast the queue was moving, was given in terms of average waiting time (in seconds) per person. Finally, entry fee was the fee that subjects had to pay (from their given initial endowment) to join the queue. In all trials, one queue was faster than the other. The faster queue required an entry fee, whereas the entry to the slower queue was free in each trial. In what follows, we use the notation NEF to denote a queue without an entry fee and EF for a queue with an entry fee. Fig. 3 in Appendix A displays a snapshot from the experiment.
The experiment included 40 different variants of the queueing task, each of which was formed by a different combination of queue attribute values. (Table 7 in Appendix B shows the variants used.) Each variant was repeated three times under different treatment conditions of time allowance: 5 seconds (5sec), 10 seconds (10sec) and no time limitation (NTL). The experiment was conducted using a within-subject design and each subject was asked to make 120 decisions in total. The order of all the 120 trials was randomized anew for each subject. On each trial, the time restriction was displayed both by a visual time bar and a digital count-down timer.
In every trial, subjects were given 100 ECUs (Experimental Currency Units) as an initial endowment. Two different types of cost were extracted from this initial endowment: cost of entry and cost of waiting (0.05 × average waiting time × number of people in the queue). Each subject paid the entry fee of the queue she chose to join (zero entry cost if the slower queue was chosen) and 0.05 ECUs per second that she had to wait in the queue before being served. We should note here that subjects did not really wait but instead paid a waiting cost. Thus, the score of a trial is the revenue of the queue chosen to join in that trial, that is π=100−entry fee−cost of waiting, or π=0 if the subject did not submit a decision in the given time. Experimental Currency Units were converted into euros at the rate of €0.30 and subjects were paid according to their score in a randomly chosen round. See Appendix A for the instructions. Because each trial involved a choice, the optimal choice was the option with the higher profit, if chosen. Out of the 40 variants, the faster queue (with the cost) was optimal 15 times, the slower (free) queue was optimal 17 times, and the two queues were equal 8 times (Appendix B, Table 7).
The experiment was programmed in C++ using a Z-tree interface (Fischbacher [2007]) and conducted in the experimental laboratory of the Max Planck Institute of Economics in Jena (Germany), directed by Prof. Werner Güth.
Subjects were undergraduate students from the University of Jena, recruited via the ORSEE software (Greiner [2015]). Upon entering the laboratory, subjects were randomly assigned to visually isolated computer terminals. The instructions were distributed and then read aloud to establish public knowledge.
Overall, we collected 11,640 observations from 97 subjects across five sessions. On average, each session lasted about 75 minutes including the time being used up for reading the instructions and paying the subjects. Average earnings per subject were €17 (inclusive of a €2.50 participation fee).
In this section, we present our findings obtained from basic descriptive analysis, describe the econometric model of the choice data and present the results.
We initially consider the success rate (choice of the queue with the higher profit, with ties excluded) across treatments. Of all the decisions made in the treatment without any time limitation (NTL) only 73% is optimal. This rate decreases to 68% when 10 seconds of time limitation is introduced and as the limitation becomes more stringent (5 seconds) it drops to 65%. Hence, looking at the aggregate data immediately shows that time limitation impairs decision performance.
In order to gain more insight into the subjects’ behavior, we deepen our analysis by examining the success rate when it is optimal to join each queue separately. The first row of Table 1 presents the success rates of the trials for which it is optimal to join the fee-free queue. In other words, the trials for which the profit of joining the slower with no entry fee queue (π(NEF)) is higher than the profit of joining the faster with an entry fee queue (π(EF)). The second row gives the complementary rates concerning the trials where it is optimal to join the faster queue. The success rate increases as the time limitation is relaxed even when we consider trials separately depending on the identity of the optimal queue. However, a comparison between the rows of Table 1 shows that in each treatment, the success rate is higher when the optimal decision is to join the queue with no entry fee. This observation suggests that there may be a bias to join the queue without an entry fee.
To attain a finer grain of analysis, we further examine success rates by introducing an additional criteria on top of the identity of optimal queue. The new criteria is the identity of the shorter queue. Excluding the cases where both queues have the same length or are equally profitable, we have four categories of task variants whose success rates are reported in Table 2, where the length of a queue is denoted by |·|.
The best performed variant category is the one given in the first cell of Table 2, where the optimal decision is to join the no entry fee (NEF) queue, which is also shorter. The second best performed variant type lies in the second cell on diagonal. This time, the faster queue with entry fee (EF) is more profitable and shorter. In the off-diagonal cells, the success rate drops considerably. Thus the better performed task variants are the ones in which it is optimal to join the shorter queue. What one might deduce from this observation is that there may be a bias to join the shorter queue.
The following subsection introduces the mixture model. A mixture approach is used here to verify whether there are subjects who efficiently use the information they can extract, and thus make the optimal queueing decision, in contrast to subjects who behave inefficiently.
Let us assume that there are G different types of decision maker in the population, denoted by the subscript g. Types differ in the decision rules adopted, that is, in the variables they consult when choosing their preferred queue. Let i indicate the subject and τ ∈{5sec, 10sec, NTL} denote the experimental treatment. In each trial, subject i is faced with the choice between two queues: a slower queue with no entry fee (NEF) and a faster queue with entry fee (EF).
If we let digtτ * be the latent dependent variable representing subject i’s propensity to choose queue NEF in treatment τ and trial t, subject i’s decision could be formulated as follows:
|
Here, γgτ is a type-specific intercept; Xit is a vector of explanatory variable describing the characteristics of the two queues and βgτ is a vector of coefficients on such variables; δigτ is a subject-specific time-invariant intercept, which follows a Normal distribution with mean 0 and variance σgτ 2; finally, εigτ is a Standard Normal distributed idiosyncratic error term.
We do not observe digtτ * directly, but we observe whether subject i chooses the NEF queue in a specific trial. In other words, we observe whether her propensity to choose NEF queue is positive. This relationship can be mathematically formulated by a {−1,1} indicator as follows:
| digtτ = |
|
This is the well-known random-effects probit model, whose assumptions lead to subject i’s likelihood contribution, given that she is of type g∈ 1,…,G, being
| ligτ= | ∫ |
|
| Φ | ⎡ ⎣ | digtτ× | ⎛ ⎝ | γgτ+Xit′βgτ+δigτ | ⎞ ⎠ | ⎤ ⎦ |
| × φ | ⎛ ⎝ | δgτ;0,σgτ 2 | ⎞ ⎠ | dδgτ. |
(2) Here, Φ[.] is the Standard Normal Cumulative Distribution Function and φ(δgτ;0,σgτ 2) is the Normal Density Function with mean 0 and variance σgτ 2, evaluated at δgτ.
Our aim here is to isolate types, i.e., groups of subjects who adopt similar decision rules when choosing between NEF and EF queues. For this purpose, we adopt a finite mixture model approach and assume that there are only two types (G=2): (i) “profit maximizer”, who uses all the relevant information and decides rationally, as suggested by the theory; (ii) “naïve”, who uses the provided information in a less-than-efficient way. Note at this point that we classify any behavior that is not rational as naïve and do not further characterize it by isolating different decision rules used by non-rational subjects. The reason is that we are primarily interested in the impact of time limitation on decision performance. Moreover, deepening the investigation of non-standard behaviors would require a much larger pool of subjects in order to attain a robust analysis.
We assume that each subject is either profit maximizer or naïve, and does not change type within a treatment. As data from each treatment are analyzed separately, the mixture model hypothesis made here does allow subjects to change type (decision rules) but only across treatments. Verifying whether subjects change type and understanding the evolution of decision rules across treatments are indeed among the main scopes of our analysis.
The likelihood contribution of subject i in treatment τ is then
| Liτ= |
| πg× ligτ. (3) |
Here, πg, termed “mixing proportion”, represents the fraction of the total sample who are type g∈{prof.max., naïve}, so that ∑gπg=1. The mixing proportions are estimated along with the other parameters of the model by maximizing the full sample log-likelihood,
| Log-Likelihoodτ= |
| ln[Liτ]. (4) |
The mixture model is estimated using the method of Maximum Simulated Likelihood for each treatment τ ∈{5sec, 10sec, NTL} separately. In each component g of the mixture, integration over δgτ is performed by simulation using 100 draws for each subject based on Halton sequences (Train [2009]).
The results from the maximization of Equation (4) are reported in Table 3. For each treatment, there are two columns displaying the parameter estimates of the model for each type included in the mixture. The behavior of a profit maximizer is captured by the difference in profits of the two queues (Δ(profit)=π(NEF) − π(EF)), which we use as the only explanatory variable. On the other hand, the sub-optimal behavior of a naïve decision maker is modeled by means of the average waiting times and the lengths of the two queues, and we also control for the entry fee level of the EF queue.
Table 3: Maximum simulated likelihood estimates of the mixture model’s parameters.
τ 5sec 10sec NTL g prof.max. naïve prof.max. naïve prof.max. naïve Regressors Δ(profit) 0.0316*** 0.0432*** 0.0517*** (0.0032) (0.0033) (0.0031) average waiting time (NEF) -0.0097* -0.0082 -0.0014 (0.0052) (0.0054) (0.0069) average waiting time (EF) -0.0022 0.0077 0.0095 (0.0046) (0.0047) (0.0064) length (NEF) -0.0368*** -0.0278*** -0.0259*** (0.0051) (0.0051) (0.0062) length (EF) 0.0360*** 0.0344*** 0.0481*** (0.0034 ) (0.0036) (0.0048 ) entry fee EF server 0.0178*** 0.0164*** 0.0220*** (0.0033) (0.0034) (0.0043) γg 0.1651*** 0.1418 0.0987* -0.2924 0.1384*** -1.3057** (0.0467) (0.4134) (0.0559) (0.4260) (0.0424) (0.5207) σgτ 0.1448*** 0.3655*** 0.2020*** 0.3550*** 0.2185*** 0.3012*** (0.0574) (0.0520) (0.0669) (0.0513) (0.0428) (0.0582) πg 0.4322*** 0.5678*** 0.5036*** 0.4964*** 0.6478*** 0.3522*** (0.0802) (0.0802) (0.0764) (0.0764) (0.0667) (0.0667) Log-Likelihood –2371.93 –2335.28 –2182.46 number of observations 3860 3873 3880 number of subjects 97 97 97
The estimated mixing proportion, πg, is statistically significantly different from 0 for both types in all treatments. This indicates that the two types of systematic behavior can be clearly separated. Furthermore, when the time constraint becomes more stringent, the fraction of profit maximizers decreases and thus the decision performance impairs. When no time limitations are imposed, 65% of subjects are estimated to be profit maximizer. This ratio declines to 50% under the loose time constraint of 10 seconds. Finally, there seem to be mildly more naïve subjects than profit maximizers in treatment 5sec.
Our results show that the coefficient on the variable of interest for the profit maximizer, i.e., Δ(profit), is of the expected sign and statistically significant in each treatment (***, ** and * denote p-values <0.01, <0.05 and <0.10, respectively). It amounts to saying that subjects of this type use the difference in profits as their decision criterion, and consequently join the queue that provides higher profit in each treatment. Also the naïve behavior appears to be consistent across treatments. This type’s decision criterion seems to include the length of the two queues and the entry fee but not the information on average waiting times. In treatment 5sec, however, in addition to the previously named variables, the coefficient on the NEF queue’s average waiting time is also significant but only slightly so. Furthermore, all the significant variables are of the expected sign. A possible explanation for naïve subjects’ behavior could be that they filter the available information, concentrating only on a subset that they perceive as important. According to this explanation, the information on average waiting times is apparently seen to be relatively less important. An alternative explanation can be that some naïve subjects opt for a simpler strategy (for example, that of following the shorter queue or joining the no entry fee queue, or even a mixture of the two), rather than analyzing the situation normatively. We cannot clearly determine which explanation is more plausible since, as mentioned earlier, we classify any non-rational behavior as naïve.
Note that a mixture model assigns subjects to types probabilistically. Therefore, it does not specify which subject is assigned to which type directly. Furthermore, the model is run separately for each treatment. This implies that the model does not help us determine whether a subject assigned to a specific type in one treatment is also assigned to the same type in the other treatments. The next subsection investigates this issue and examines how behaviors evolve across treatments.
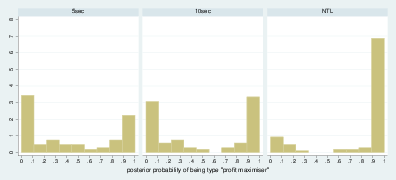
We start investigating the evolution of decision rules by calculating for each subject the posterior probability of being a specific type in each treatment τ ∈{5sec, 10sec, NTL}. We derive these probabilities using Bayes’ rule and the estimation results from our mixture model (see Table 3). Subject i’s posterior probability of being type g∈{prof. max., naïve} in treatment τ is given by
|
where obsiτ represents the observations collected from subject i in treatment τ. In practice, πgτ, ligτ and Liτ are replaced by their estimated counterparts, obtained by maximizing Equation (4) from treatment τ data. Obviously, subject i’s posterior probability of being naïve type is obtained by ppi,naïveτ=1−ppi,prof.max.τ, for all τ.
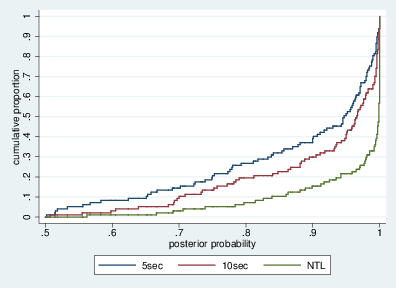
The histograms of the posterior probabilities of being profit maximizer type are displayed in Figure 1. The resulting posterior probabilities are consistent with the mixing proportions estimated by the mixture model. In treatment 5sec, the naïve type is mildly preponderant. When the time allowance is 10 seconds, the posterior probabilities of being one of the two types are almost equal. With no time limitations, the naïve type is decidedly recessive. Most of the subjects are concentrated at the extremes of the distributions. This finding testifies that our mixtures are rather powerful at segregating subjects, except for a small number of them for whom there is some uncertainty. We assign subjects to types according to the maximum posterior probability. Figure 2 shows the cumulative percentage of subjects assigned to a type with maximum posterior probability less than the probability indicated on the horizontal axis, for each treatment. The figure confirms that the power of our mixture model at segregating subjects is quite impressive: 60%, 70% and 85% of them are assigned to a type with posterior probability larger than 0.90 in treatment 5sec, 10sec and NTL, respectively. Overall, the assignment to a type is remarkably good in the treatment with no time limitation, only marginally less in the other two cases.1
Having assigned each subject to a type in each treatment, now we are ready to consider subjects’ profiles throughout the experiment. We have overall eight possible profiles since there are three treatments and two types in each treatment. Table 4 reports proportions for these eight profiles. Previous works (Stiensmeier-Pelster and Schuuml;rmann,Verplanken [1993]) suggest that individuals exhibit differences in how they react to time limitation. Table 4 not only supports this idea but also provides further evidence of heterogeneity in the way that subjects change their reactions due to different levels of time limitation.
The most popular profile (accounting for 30% of our sample) is the one where subjects are assigned to the naïve type in treatments 5sec and 10sec, but to the profit maximizer type in treatment NTL (second row of Table 4). When there are time limitations, 30% of our sample fails to make the optimal decision but manages to do so when no limitation is imposed. A possible explanation for this behavior could be that the given time allowances are not long enough to think thoroughly and evaluate which queue is more profitable. However, when time limitations are removed, subjects can take the necessary time and make the optimal decision. Another possibility is that it is not the tightness of the time allowances (especially for treatment 10sec) that causes these subjects to perform badly in treatments 5sec and 10sec but the presence of a limitation tout court. Under time limitation, they might panic and use their time inefficiently, therefore fail to follow the optimal decision strategy. We postpone the investigation of this issue to the next subsection, where we consider decision times.
Table 4 reveals that the second most popular profile, representing 29% of our subject pool, is being profit maximizer type in each treatment. These subjects behave consistently throughout the experiment, and the different time limitations do not seem to affect their making rational decisions. The other profile that is consistent throughout the experiment is the one in which subjects are assigned to the naïve type in each treatment. It represents 11% of our sample. In total 40% of the subjects behave consistently and do not change type across treatments. This amounts to saying that time limitation does not have any sort of effect on the performance of these subjects.
One possible explanation that might account for the results presented in Table 4 holds that people are diversely able/willing to pursue optimal information processing. Eleven percent of the sample never implements the optimal strategy, while 30% is able to do so only when there is no time limitation. Moreover, 29% of our subjects is able to pursue the optimal strategy under any treatment condition and 18% are able to do so except in treatment 5sec.
This explanation accounts not only for our 4 most popular types, which make up 88% of all subjects, but can also be viewed as an implication of the results by Stiensmeier-Pelster and Schuuml;rmann. They show that, when coping with time pressure, some subjects accelerate their information processing while others adapt by filtering the information. Those who manage to accelerate under a certain time limitation, say 10sec, may implement the optimal strategy since they are able to optimally process information at a faster pace. However, those who cannot accelerate may filter the information, and focus only on a subset of it that is perceived as the most important. This focus, in turn, may make them fail to pursue the optimal strategy not only in treatment 10sec but also in the 5sec one. Furthermore, this explanation chimes nicely with the hierarchical responses argument of Payne et al. [1988]. People first engage in acceleration and try to respond by working faster. If the pressure is too high and acceleration does not suffice, they may next filter the available information and consider only a subset of it. The results presented in Table 4 could be interpreted as follows: our subjects are diverse in their ability or willingness to switch from acceleration to filtration. Some filter always, some others switch from acceleration to filtration whenever there is a time limitation (treatments 10sec and 5sec) and some switch only when the limitation is too stringent (treatment 5sec). Finally, there are also those who can cope with time limitation without changing strategy.
In the next subsection, we analyze decision times to verify whether profit maximizers adapt to time limitation by acceleration. Moreover we investigate whether the impairment of decision performance is due to the tightness of time allowances or due to (the stress caused by) the presence of a time limitation.
In treatment 5sec, 13 out of 97 subjects failed to complete the task only in one trial, 2 subjects did so in two trials and only one subject in three trials; whereas, in treatment 10sec, 7 subjects failed to do so only once. Thus, we have a total of 27 missing observations out of 11640 (97 subjects × 120 trials) data points (that is, only 0.2% of data are missing). In these few cases, for the tables and the tests reported in this subsection, we have replaced the missing decision times with the upper time limit. Even if we neglect these missing observations, the reported tests’ results do not alter.
Table 5 presents descriptive statistics of decision times across three treatments and reveals that subjects use more time as time limitations are relaxed, on average. Paired t-tests confirm that these differences are statistically significant.2 We already know that subjects perform best in the no time limitation treatment (see Table 3), and Table 5 reveals that the average decision time in this treatment is around 8.3 seconds. Under a mild time limitation (10sec), however, subjects use only one-third of the given time allowance, on average. This indicates that the presence of a time limitation puts a great deal of subjects under pressure and hinders them from using the given time efficiently. Likewise, under the stringent time limitation of 5 seconds, subjects use only half of the given time, on average.
We deepen our analysis by examining how decision times of profit maximizer and naïve subjects change across treatments. The descriptive statistics given in Table 6 show that our previous observation that subjects take more time to decide when the limitations are relaxed holds regardless of types. Furthermore, profit maximizers spend more time than naïve subjects no matter what the time limitation is. In fact, a two-sample t-test with unequal variances, whose statistics and p-values are reported in the table, confirms that regardless of the treatment we can reject the hypothesis that both types spend the same amount of time, on average, to arrive at a decision. Thus, a naïve subject uses a decision strategy that is faster relative to the one used by a profit maximizer.3
In the previous subsection we have seen that there are mainly 4 common profiles in our population (see Table 4). Thirty per cent of subjects can implement the optimal strategy when there is no time limitation, spending 9 seconds, on average. However, when under the mild time limitation of 10 seconds — which is more than what they spend under no limitation — they use only a quarter of the given time (or one-third of what they use under treatment NTL) and fail to implement the optimal strategy. Thus under a mild time limitations, 30% of subjects seem to switch to a strategy that requires less time but impairs decision performance. Such an alternative strategy may be pursued, for example, by filtration, following the shorter queue or joining the queue with no entry fee. Another 18% of subjects show a similar pattern, but they switch to an alternative only under the stringent time limitation of 5 seconds. These subjects spend on average 4 seconds (1.5 times more than the previously mentioned group) and implement the optimal strategy in treatment 10sec. One could interpret this result by using the hierarchical response argument of Payne et al. [1988]: these subjects adapt to time limitation first by accelerating but when the pressure is too high and acceleration does not suffice, they use filtration or another simpler strategy.
An interesting observation concerning the subjects who switch strategy under time limitation is that they show this behavior even though the given time allowance is more than what they spend before switching. As noted earlier, profit maximizers arrive at a decision in about 9 seconds under treatment NTL. Although in treatment 10sec they still have enough time to pursue their strategy, almost 44% (=(30+7)/(30+7+18+29), see Table 4) of them switch and fail to pursue the optimal strategy. Likewise, profit maximizers of 10sec treatment make their decisions in about 4 seconds. In treatment 5sec, almost 39% (=(1+18)/(1+18+1+29), see Table 4) of them alter their strategy of treatment 10sec even though they still have enough time to follow it. Hence what impairs subjects’ decision performance is apparently not the tightness of time constraint but rather the existence of such a constraint.
The other two common profiles do not involve any switches. The one that assigns subjects to the profit maximizer type in each treatment is adopted by 29% of the population. These subjects spend less time under time limitation but still manage to pursue the optimal strategy. Thus they seem to adapt to time limitation by acceleration. Finally, 11% of subjects are assigned to the naïve type in each treatment. They are not willing or able to implement the optimal strategy even in the absence of time limitation, and the presence of such limitations does not impair their performance.
The main contribution of this study is twofold. Firstly, it adds to the understanding of the impact of time limitation on non-strategic decisions. Secondly, it contributes to the characterization of customers’ queueing behavior by experimentally examining the situation in which subjects need to choose between two queues under different treatment conditions of time allowance. Our econometric analysis suggests that, with no time limitation, a considerable proportion of the population behaves consistently with the principles of rationality, which require comparing the profits of joining each queue. Time limitation increasingly harms decision performance and decreases that proportion. The rest of the population does not use the provided information in a normative way. They do not appear to incorporate the information on server speed, which is given as the average waiting time per person in the queue, into their decisions.
At a finer grain of analysis, we find that our subjects are affected differently by time limitation. Among the subjects who implement the optimal strategy when there is no time limitation, some fail to pursue it under both a mild and a stringent time limitation of 10 and 5 seconds, respectively, while some others manage to do so when time allowance is 10 seconds but not when it is 5 seconds. Finally, some subjects do not seem to be affected by time limitation. Almost two-thirds of the subjects in this group behave consistently with the principles of rationality and adapt to time limitation by increasing their pace. A likely interpretation of this result is that subjects show a hierarchy of responses to time limitation (Payne et al. [1988]), but they do this in diverse manners. When facing time limitation they seem to respond by working faster. If acceleration does not suffice, they switch to another simple strategy (e.g., filtering, following the shorter queue, and so on). But the switch point is not the same for everyone: some switch under any level of time limitation; some, instead, adapt acceleration under mild time limitation but switch when it is stringent; some others do not switch at all. A possible avenue for future research is to use process-tracking techniques, like eye-tracking, in order to test our conclusions about such processes.
The analysis of decision times reveals that the reason why time limitation harms decision performance of most subjects is not the insufficiency of time but the existence of a limitation. Time constraint seems to stress many people, urging them to use simple strategies or heuristics, instead of analyzing the situation normatively. That is to say, no trifling portion of subjects systematically follows the shorter queue, for example, when there is time limitation, but acts almost rationally when the constraint vanishes.
Although the queueing environment studied in this work is very simplistic, our findings potentially pave the way for further research by providing useful inputs. One suggestion that stems from them is to deepen the investigation of non-standard behavior. In this study, we classify any behavior that is not rational as naïve. However, using a sufficiently large number of subjects, the non-rational behavior could be further categorized into different decision rules. The characterization of different types could lead to a mechanism design that screens and discriminates customers based on their types, and to an examination of the welfare effect of such a process.
There are some limitations to this experiment. We provided subjects with explicit information on the server speed in order to see how they react to it. In a real-world situation, this piece of information is not explicitly available but could be extracted by observing the queue for a while. However the evidence that some subjects do not seem to incorporate this information into their decisions suggests that they would not even try to extract it when facing a similar situation in everyday life.
A more serious limitation is that the subjects did not experience the irritation and annoyance of waiting in a queue. A trial finished and a new one began immediately after a subject made her decision to which queue to join, without waiting for real. Designing an experiment that involves real waiting is problematic because the cost of waiting is subjective and not observable. That is, each subject’s annoyance due to waiting may be different, and moreover, measuring or deducing it may not even be possible. Finally, due to the accumulation effect of this cost, a robust analysis would require a huge sample, since no more than a few observations could be obtained from a single subject.
Research employing the Iowa Gambling Task (IGT) has frequently shown that learning is impaired in various clinical populations. However, precisely what constitutes “unimpaired” control group learning remains unclear. In order to understand some of the possible factors underlying variability in control group {IGT} performance, the present study sought to manipulate features of the task to intentionally disrupt learning. Specifically, the present study investigated the effects of time constraints on emotion-based learning during automated administration of the IGT. For two groups of participants, a time-constraint of either 2-s or 4-s was implemented during the critical decision making period, while a control group received no time constraint. We also evaluated participants' subjective experience after every block of 20 trials. Results demonstrated that the 2-s group differed significantly from the control group. Subjective experience measures revealed rapid development of awareness of the advantageous and disadvantageous decks among all three groups. Overall, our findings demonstrate, for the first time, the effects of decision-phase time constraints on emotion-based learning and indicate that the {IGT} reward/punishment schedules are to some extent cognitively penetrable.
Keywords: Emotion-based learning
Keywords: Alpha model; Ambiguity; Expected utility; Mixture models; Rank dependent expected utility; Smooth model; D81; C91; C23
This paper estimates the determinants of decision time for different types of decision maker in the context of an experimental investigation of multiple prior models of behaviour under ambiguity. Four models are considered: Expected Utility, Smooth, Rank Dependent Expected Utility and Alpha model. The results of a mixture model which assigns subjects to types enable us to distinguish the factors influencing the decision time of each of these four types. We find that the different types are influenced by different factors. In general, the Rank Dependent type takes more time, followed by the Smooth, the Expected Utility and finally the Alpha type, whose decision time is always the lowest. Our results reflect the relative complexity of the preference functionals used by the different types. Consequently, the importance of looking at the process of pairwise choices rather than simply at the choice made is raised to the attention of theorists and analysts.
Keywords: decision time; choice under uncertainty; censored regression
Research on time pressure (TP) in negotiation has considered strategic choice (demands and concession making) but largely ignored information processing. Based on Lay Epistemic Theory (Kruglanski, 1989) it is hypothesized that {TP} reduces motivation to process information systematically, and the time needed to negotiate an agreement, and that it produces greater reliance on cognitive heuristics when placing demands, and less integrative agreements. Two studies revealed that effects of time constraint on information processing in negotiation were due to higher need for cognitive closure under high TP. Study 1 also showed that negotiators use stereotypes about the opponent as a heuristic cue more under high rather than low TP. Study 2 revealed that negotiators under high {TP} were less likely to revise their unfounded fixed-pie perceptions during negotiation and, therefore, reached less integrative agreements. Implications for motivated information processing in negotiation are discussed.
Keywords: Experiment; Experimental software
Keywords: Perceived quality; Price/quality heuristics; Satisfaction; Service delays; Signaling; Social influence; Waits
This paper discusses aspects of recruiting subjects for economic laboratory experiments, and shows how the Online Recruitment System for Economic Experiments can help. The software package provides experimenters with a free, convenient, and very powerful tool to organize their experiments and sessions.
We study the effects of time pressure on risky decisions for pure gain prospects, pure loss prospects, and mixed prospects involving both gains and losses. In two experiments we find that time pressure has no effect on risk attitudes for gains, but increases risk aversion for losses. For mixed prospects, subjects become simultaneously more loss averse and more gain seeking under time pressure, depending on the framing of the prospects. The results suggest the importance of aspiration levels, and thus the overall probability to break even, under time pressure. We discuss the implications of our findings for decision-making situations that involve time pressure. This paper was accepted by Uri Gneezy, behavioral economics.
Many decisions in economics and finance have to be made under severe time pressure. Furthermore, payoffs frequently depend on the speed of decision-making, as, for instance, when buying and selling stocks. In this paper, we examine the influence of time pressure and time-dependent incentive schemes on the quality of decision-making in an experimental beauty-contest game. We find that convergence to equilibrium is faster and payoffs are higher under low time pressure than under high time pressure. Interestingly, time-dependent payoffs under high time pressure lead to significantly quicker decision-making without reducing the quality of decisions.
Keywords: Quality of decision-making; Time pressure; Incentives; Beauty-contest experiment
Abstract This article examines a silver lining of standing in line: Consumers infer that products are more valuable when others are behind them. Specifically, the value of a product increases as more people line up behind a person (Study 1) and when others are present (versus absent) behind a person in line (Study 2). Value increases further when directing consumers' attention to the presence of others behind them?that is, when they look backward versus forward (Study 3) and when the queue structure emphasizes the last person to join rather than the person being served (Study 4). This effect of people in line behind them is associated with increased expenditures by queuing consumers (Study 5).
A queueing model--together with a cost structure--is presented, which envisages the imposition of tolls on newly arriving customers. It is shown that frequently this is a strategy which might lead to the attainment of social optimality.
We study batch queueing systems with continuous time, finite commuter populations, single server, and endogenously determined arrival times. Symmetric equilibrium solutions in mixed strategies are constructed and subsequently tested in two experiments that examine two different batch queueing models, one with a fixed server capacity, and the other with a variable server capacity. With experience in playing the stage queueing game repeatedly, experimental results from groups of 20 subjects support equilibrium play on the aggregate level when the server capacity is fixed and commonly known. When it is known to be variable, randomly changing from round to round, subjects diverge from equilibrium play and increase their individual payoffs substantially by significantly shortening their waiting time.
Keywords: Batch queueing; Game theory; Constant and variable capacity; Experiments
We study a class of queueing problems with endogenous arrival times formulated as non-cooperative n-person games in normal form. With multiple equilibria in pure strategies, these queueing games give rise to problems of tacit coordination. We first describe a Markov chain algorithm used to compute the symmetric mixed-strategy equilibrium solution, and then report the results of an experimental study of a large-scale (n=20) queueing game with fixed service time, FIFO queue discipline, and no early arrivals. Our results show consistent and replicable patterns of arrival that provide strong support for mixed-strategy equilibrium play on the aggregate but not individual level.
Keywords: Queueing; Endogenous arrival times; Mixed-strategy equilibrium; Experimentation
Keywords: batch queueing; equilibrium solution; experiment; coordination
We study the decisions agents make in two queueing games with endogenously determined arrivals and batch service. In both games, agents are asked to independently decide when to join a queue, or they may simply choose not to join it at all. The symmetric mixed-strategy equilibrium of two games in discrete time where balking is prohibited and where it is allowed are tested experimentally in a study that varies the game type (balking vs. no balking) and information structure (private vs. public information). With repeated iterations of the stage game, all four experimental conditions result in aggregate, but not individual, behavior approaching mixed-strategy equilibrium play. Individual behavior can be accounted for by relatively simple heuristics.
Keywords: Batch queueing; Equilibrium solution; Experimental economics
We examine the influence of time pressure on bargaining behavior in an ultimatum game. Controlling for offers, rejection rates of responders are significantly higher under a tight than under a very weak time constraint. However, this effect vanishes with repetition.
Keywords: Time pressure; Bargaining; Ultimatum game; Experiment
The current research examines the effects of time pressure on decision behavior based on a prospect theory framework. In Experiments 1 and 2, participants estimated certainty equivalents for binary gains-only bets in the presence or absence of time pressure. In Experiment 3, participants assessed comparable bets that were framed as losses. Data were modeled to establish psychological mechanisms underlying decision behavior. In Experiments 1 and 2, time pressure led to increased risk attractiveness, but no significant differences emerged in either probability discriminability or outcome utility. In Experiment 3, time pressure reduced probability discriminability, which was coupled with severe risk-seeking behavior for both conditions in the domain of losses. No significant effects of control over outcomes were observed. Results provide qualified support for theories that suggest increased risk-seeking for gains under time pressure.
Keywords: Decision making; Prospect theory; Time pressure; Probability; Choice; Gambling
This file was generated by bibtex2html 1.98.
Welcome and thank you for your participation in this experiment. Its results will be used for the purpose of academic research and will be published in a way that preserves your anonymity.
The funds for this research have been provided by the Max Planck Institute of Economics. The experiment is straightforward, and you can earn an amount of money which will be paid to you in cash immediately at the end. There is no right or wrong answer, but your decisions will affect your payment. The decisions of the other subjects, however, do not have any influence on your payment.
You receive €2.5 as participation fee for showing up on time. In addition, you will earn an extra amount of money, depending on the decisions that you make during the experiment. The experiment consists of 120 trials. One of these trials will be randomly selected at the end of the experiment to determine your total payment. Payments will be carried out privately so that the other subjects will not observe how much you earn.
In the experiment, the amounts are shown in ECUs (Experimental Currency Unit) rather than Euros. At the end of the experiment, earnings in ECUs will be exchanged into Euros using the following exchange rate:
This means that, for each ECU you earn, you will receive €0.30. During the experiment, it is strictly forbidden to talk to the other subjects. Failure to comply with this rule will lead to an immediate termination of the experiment and no payments will be made. Please turn off your mobile phones now. In case you have questions, just raise your hand and one of the experimenters will come to your aid.
The experiment lasts 120 trials. At the beginning of each trial, you receive an endowment of 100 ECUs. In each trial, you will be confronted with two servers (server A and server B), and one queue in front of each server (queue A and queue B). The queues consist of people waiting for their turn to get a service. Both of the servers provide the same service. However, server B is faster than server A. Therefore, it is costly to get the service from server B, whereas it is free for server A. Furthermore, waiting is also costly: each 100 seconds spent in a queue will cost you 5 ECUs (i.e., 0.05 ECU per second) that will be withdrawn from your endowment. This means that, if you decide to be served by server A, your payoff will be the initial endowment, 100 ECUs, minus your total waiting cost; instead, if you decide to be served by server B, your final payoff will be the initial endowment, 100 ECUs, minus the entry cost minus your waiting cost. The waiting cost of a server is given by the total waiting time multiplied by 0.05 (the cost per second). The total waiting time is computed as the number of people queuing times the average waiting time per person at that server.
In each trial, you are provided the following information on the screeen:
In each trial, you are requested to decide to which server queue you would like to be joined. To make each decision, one of the following time limitations applies: (i) 5 seconds; (ii) 10 seconds; (iii) no time limitation. At the top of the screen, you will see a digital timer and a time bar that indicate how much time you have left to make a decision.
Please note: If you do not make your decision within the specified time limit, your score for that trial is 0. This implies that, in case a trial in which you did not submit a choice of server in time is selected for payment at the end of the experiment, you will only receive €2.5 for your participation.
Below (in Fig. 3, here) you can find a screenshot of the experiment.
In the figure, you can notice what follows:
You are asked to indicate your decision on which server queue to join by pressing the relevant key on the keyboard, that is, key “A” for server queue A and key “B” for server queue B.
After you have made your decision, a pop-up window where you can see the decision just made in that trial will appear. You need to press the “Enter” key on the keyboard to close this window and proceed to the next trial. That is, a trial finishes as soon as you make your decision, and the next trial starts when you press the “Enter” key. This amounts to saying that waiting in a queue is hypothetical, you will not actually wait but a waiting cost will be subtracted from your endowment. A detailed explanation of the payment method follows below.
If during the experiment an error in the program occurs, do not enter any input or try to solve the problem by yourself. Simply, raise your hand and one of the experimenters will come to your aid.
Your final payoff will be calculated as follows. At the end of the experiment, one of the 120 trials will be selected randomly. This will be done by drawing a ball from an urn containing 120 numbered balls. You will receive your score of this randomly selected trial (based on the characteristics of server you chose to join in that trial) plus the participation fee (€2.5).
Your score in a trial is what remains after subtracting from the initial endowment of 100 ECUs entry fee and waiting cost of the chosen server. As already specified, you will be charged 5 ECUs for each 100 seconds (hypothetically) spent in that queue, therefore your waiting cost will be the total waiting time (in seconds) multiplied by 0.05. Finally, the exchange rate 0.30 will be used to convert ECUs into Euros. That is,
|
If you have any doubts or queries please call over an experimenter.
Thank you very much for your participation.
Table 7 presents the 40 variants of the queueing task we used in the experiment. Its columns report the following information: “Speed” is the average waiting time in seconds; “Length” is the number of people waiting in the queue; “Entry Fee” is the entry fee in ECUs; π(.) is the profit of the queue in ECUs (not provided to subjects).
Table 7: Variants of the experimental task.
Queue A Queue B
The authors thank the Editor, Prof. Joseph G. Johnson, and an anonymous referee for their careful reading and helpful suggestions, Prof. Amnon Rapoport for pointing up some useful references, Claudia Zellmann for translating the instructions and André Ziervogel for writing the experimental software.
Copyright: © 2016. The authors license this article under the terms of the Creative Commons Attribution 3.0 License.
This document was translated from LATEX by HEVEA.