You probably underestimate the populations of Eastern states and the areas of Western states
NEW PAPER, NEW PRODUCT FEATURE USING PERSPECTIVE PHRASES
Click to enlarge
As mentioned a few times in past posts, we’ve been doing research on how “perspective sentences,” for example “Israel is about the size of New Jersey in area and population” helps Americans comprehend measurements beyond simply saying “Israel has an area of 20,770 square kilometers and a population of 8,793,000.” We’re happy to say that, due to the drive of Jake Hofman and others, this research has now been incorporated into Bing search engine results:
Chris Riederer, Jake Hofman and I have just published a new paper on this topic which will be presented at CHI 2018. In it, we propose and test methods for generating perspectives. For example, why do we feel that “roughly the population of California” is better than “roughly 10 times the population of Oklahoma,” even though they’re about equally accurate and even if the person you are talking to is from Oklahoma? It turns out that 10x not an ideal multiplier for people to work with (strange, we know) and Oklahoma is not ideal to use in examples.
Christopher Riederer, Jake M. Hofman and Daniel G. Goldstein. (2018). To put that in perspective: Generating analogies that make numbers easier to understand. In Proceedings of the 2018 ACM Conference on Human Factors in Computing Systems (CHI’18)
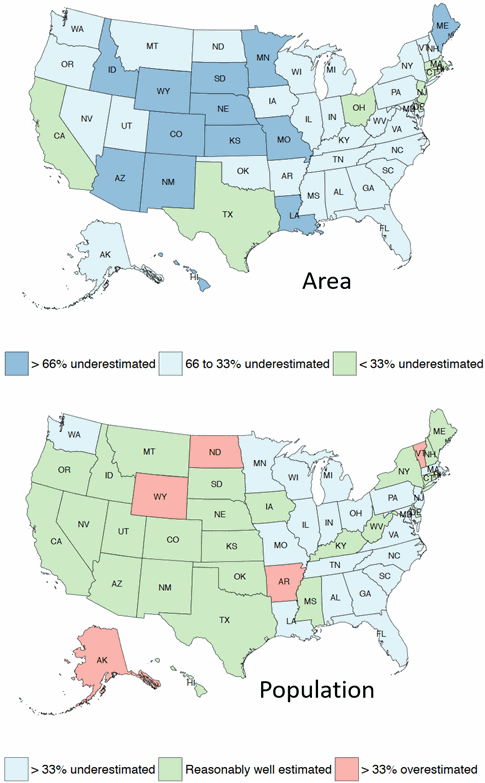
In the course of doing this research, we were able to generate some fun charts like the one at the top of the post. People underestimate the areas of pretty much all US states (above, top panel) but are especially bad at central and Western states. Furthermore, they underestimate the populations of Eastern states (above, bottom panel). The US is tricky for geographic inferences because many big states have small populations. This makes traditional election maps deceptive and have led to some (weird, we know) ways of rescaling them. [BTW, if you are interested in the psychology of demographic estimation, we can recommend Brown and Siegler (1993)].
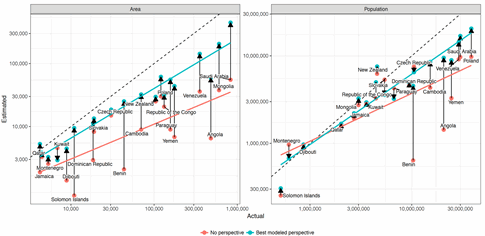
Another thing we found is that people do a lot better estimating things when you give them a perspective sentence to help them (e.g., “The population of Poland is about as big as that of California. What is Poland’s population?”). The left chart below shows the improvement in area estimation (note that they still underestimate areas, even with hints) and the right chart shows improvement in population estimation. Click the chart to enlarge it.
Click to enlarge
If you’d like to read more, here are some popular articles on the research:
- Grasping Giant Numbers Is Far From Second Nature – Wall Street Journal
- How to Understand Extreme Numbers – Nautilus
- ‘Aha, now I get it!’ Microsoft is building technology to put numbers in perspective – The Microsoft AI Blog
- It’s Time for a Revolution in Investor Disclosures – Wall Street Journal
Here are some of the people who have worked on the research side of this project:
- Jake Hofman – Principal Investigator
- Dan Goldstein – me
- Chris Riederer – Intern
- Pablo Barrio – Intern
- David Bourgin – Intern
- Chinmay Singh – Engineer
- And many others at MSFT


