Correlation between risk aversion and loss aversion
LOSS AVERSION AND RISK AVERSION ARE CORRELATED (AT LEAST WITH OUR TECHNIQUE)
A student recently emailed us asking for some data from our 2008 paper:
Goldstein, Daniel G., Johnson, Eric J. & Sharpe, William F. (2008). Choosing outcomes versus choosing products: Consumer-focused retirement investment advice. Journal of Consumer Research, 35(3), 440-456.
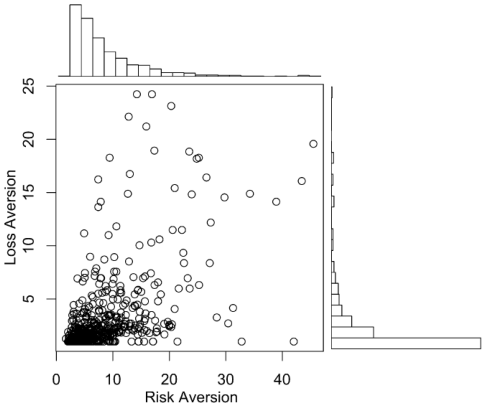
In particular, they were interested in the correlation between estimates of risk aversion and loss aversion within a person, which can be seen in the above plot (Figure 4 in the article).
We thought, why not make the data open to the whole world. Here they are:
Goldstein, Johnson, Sharpe (2008) Loss Aversion and Risk Aversion Data
subject: An anonymous identifier indexing the unique human who submitted the data
dist: participants submitted two distributions (one right after another) in Year 1. They were invited back in Year 2 to submit distributions again. There was some dropout. This column tells you which distribution you are looking at.
riskAversion: this is the coefficient of relative risk aversion, commonly referred to as alpha
lossAversion: this is the coefficient of loss aversion, commonly referred to as lambda
Note: There are some extreme values in the data that will throw off your correlations. In the figure above, as noted in the paper, we just plot cases in which lambda is < 25. Here we’ll show how this affects the correlations:
PEARSON CORRELATIONS BETWEEN ALPHA AND LAMBDA: CASES WHERE LAMBDA IS < 25
Distribution Correlation
Year 1 Dist 1 0.65
Year 1 Dist 2 0.60
Year 2 Dist 1 0.52
Year 2 Dist 2 0.48PEARSON CORRELATIONS BETWEEN ALPHA AND LAMBDA: ALL CASES
Distribution Correlation
Year 1 Dist 1 0.65
Year 1 Dist 2 0.88
Year 2 Dist 1 0.65
Year 2 Dist 2 0.56
Clearly, using the method of Goldstein, Johnson and Sharpe (2008), estimates between risk aversion and loss aversion are quite correlated. The method forces the correlation somewhat: the most loss averse data one can submit will necessarily be quite risk averse.
Feel free to download the data and draw your own conclusions, but please cite the above paper as the source if you do.
