Getting old in baseball
BATTING AND AGING
With baseball’s World Series drawing to a close, we thought we’d get in one last 2014 post on the US national pastime.
Keeping up with our aging theme, we’ll look at what happens to players’ batting averages as they age. We use the Lahman package in R, which has data from 1871 to 2013. We take the set of players who played in the majors for at least two years and look at the mean batting average at every age.
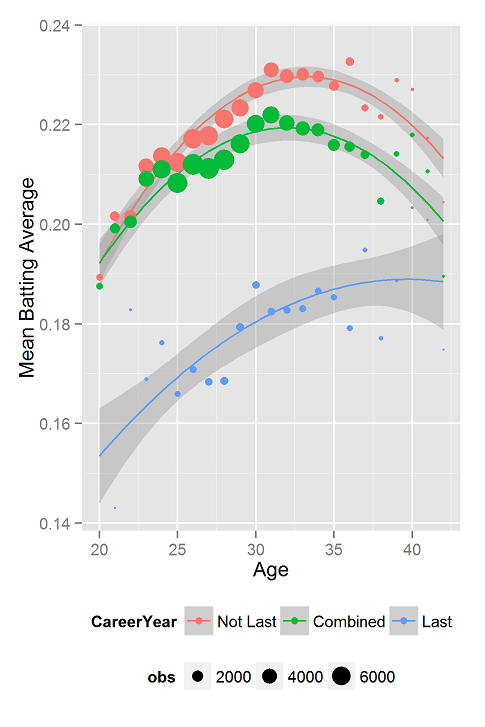
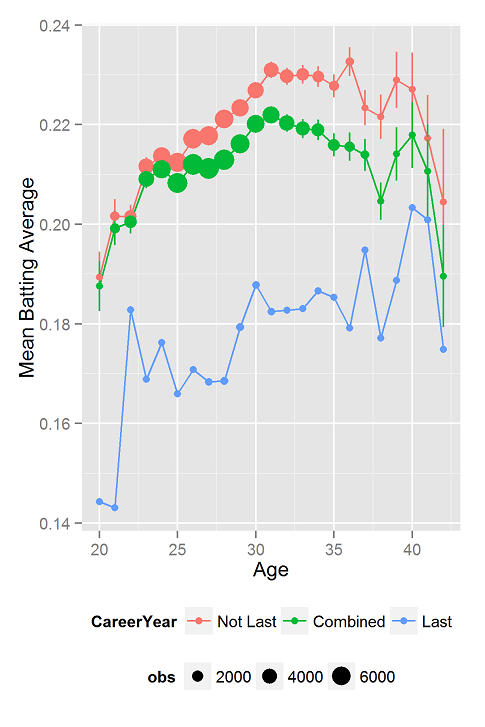
The green line (above, with smoothed plots, below with raw results with standard error bars) shows this basic result. Pro baseball players have their highest averages just over age 30. The area of the circles is proportional to the number of observations in that point.
When you look at results like those in the green line, however, you must stop to consider that the players who show up in the graph only tell part of the story. At a given age, there were other players who are not plotted because they were cut from the team years before (often due to their poor batting performance).
To illustrate this, at each age, I plot in the blue line the batting average of players who are in their last year of major league play. As one would expect, batting averages are low the year before players disappear from the major leagues. In the red line, we see the performance at each age of players who are not in their last year. For this subset of the data, peak batting average occurs at age 36 and the maximum is a bit flatter.
What is up with the increase in the blue line? The increasing trend is present even if you exclude the first two unusually low points. We are no experts on baseball (or sports of any kind) and are open to suggestions.
One thing to keep in mind is that people whose last year was at age 20 probably only played 2 years (I only considered players who played at least 2 years), while people whose last year was age 40 probably played about 20 years.
As usual, those who want to reproduce this in R are welcome to do so.

Hi,
Interesting post. I have a theory about the blue line:
Good players play more years and retire when they are older, bad players are cut when they are younger. So given that a player’s last year is when he is older, he is more likely to be a good player.
October 30, 2014 @ 9:37 am
As a huge baseball fan, I think the reason for the increasing blue line is because if your last year is in your early to mid 20’s it’s probably because you’re not very good, and hence batting average is low. If your last year is in late 30’s/early 40’s that means you’ve performed well enough to still get contracts. Looking at guys like Ted Williams, one of the best hitters in the game, still had a really good average into his 40’s. Nowadays, when you’re older, you’re typically going on year-to-year contracts with teams, so you’re probably not going to get signed unless you have a halfway decent average.
October 30, 2014 @ 10:39 am
Re: the blue line: Wouldn’t it be a censorship problem? Only the better players are allowed to age in the sport?
October 30, 2014 @ 10:41 am
Hello Dan;
the size of the dots you are using violates what is called the “area principle” for graphics. The size of the graphical object should be proportional to the represented count. So you should use (size=sqrt(obs)) instead of (size=obs). Or course, R probably should have done this for us!
later,
dean (with Bob Stine typing shotgun.)
October 30, 2014 @ 11:16 am
Fixed. Thanks!
October 30, 2014 @ 11:25 am