Baseball: Probability of winning conditional on runs, hits, walks and errors
SIMPLY COUNTING OVER 44 YEARS OF DATA
We have a father-in-law who likes baseball. Occasionally, he asks us to figure out things, which we are more than happy to do. The last request was to figure out:
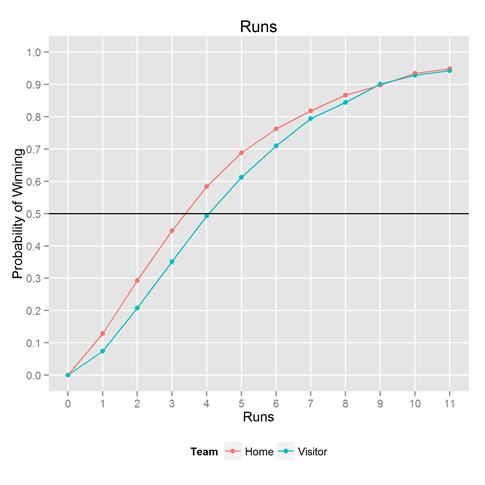
If a team scores X runs, what’s the probability it will win the game?
Luckily, we had the data to solve this problem (as mentioned in past posts). Looking back over 44 years of baseball games, we looked at how often a home team scored 1 run, and counted how often the home team won. We then looked at 2, 3, 4 runs, up to 11 runs. We stop at 11 runs because we only wanted to compute relative frequencies when there’s a decent amount of data. In all our analyses here, we cut the x-axis when there are fewer than 500 observations per bin. We analyzed the visiting team’s scores separately, to see the effect of the home team advantage.
The result is shown above. If you consistently score 3-4 runs a game, you’re winning about half the games. It’s simply not good enough. Going from 2 runs a game to 6 runs a game means going from winning 25% of the time to winning 75% of the time–all the difference in the world.
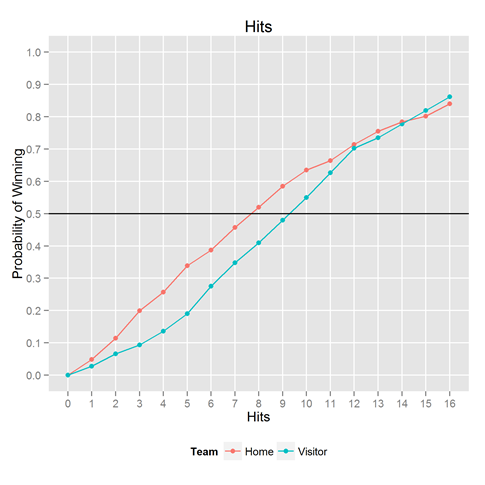
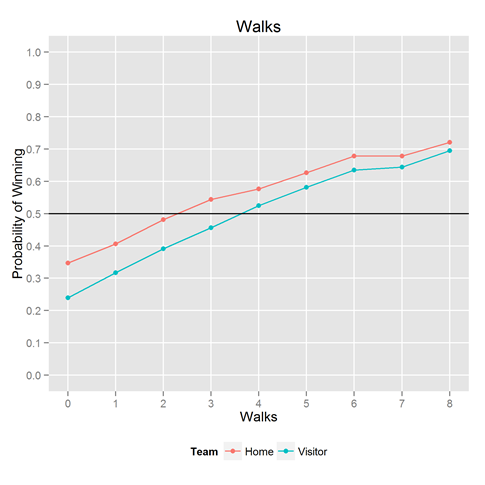
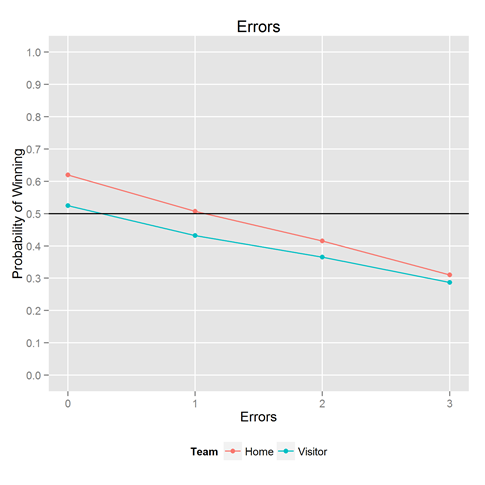
Because we had the data handy, we couldn’t help but looking at the same thing for the other key statistics: hits, walks, and errors. Results below.
Want to play with it yourself? The R / ggplot2 code that made this plot is below. ggplot and dplyr are Hadley Wickham creations.

Hey there! I’m trying to run this on my own to see the demo at work and can’t get the text files to import the column header names. Are the links live?
Thanks!
September 3, 2014 @ 1:41 pm
Oops. Please find at http://www.dangoldstein.com/flash/bball/cnames.txt
September 3, 2014 @ 3:07 pm
I was looking for this because I just played an absolutely insane simulation game with StratoMatic, Hall of Fame edition. Final score was a whopping 21-14! It’s funny that the graph only goes to 11 runs, but based on the trend it looks like the poor losing team had about a 95% chance of winning in a normal game.
August 2, 2019 @ 2:55 pm
You’re right! Just their luck to be up against an opponent who could score 21 runs against them!
August 10, 2019 @ 5:01 pm