Innumeracy and incentives: A ratio bias experiment
Donald Dale1
Dept. of Accounting, Business, and Economics
Muhlenberg College
Jeffrey Rudski
Dept. of Psychology
Muhlenberg College
Adam Schwarz
Medical College of Virginia
Eric Smith
Mount Sinai School of Medicine
Judgment and Decision Making, vol. 2, no. 4, August 2007, pp. 243-250
Abstract
The Ratio-Bias phenomenon, observed by psychologist Seymour Epstein and
colleagues, is a systematic manifestation of irrationality. When offered a
choice between two lotteries, individuals consistently choose the lottery
with the greater number of potential successes, even when it offers a
smaller probability of success. In the current study, we conduct experiments
to confirm this phenomenon and test for the existence of Bias as distinct
from general irrationality. Moreover, we examine the effect of introducing a
monetary incentive of varying size (depending on the treatment) on the
extent of irrational choices within this framework. We confirm the existence
of the Bias. Moreover, the existence of an incentive significantly reduces
the extent of irrationality exhibited, and that this effect is roughly
linear in response to changes in the size of the incentive within the
magnitudes investigated.
Keywords: ratio bias, probability judgment, incentive, cognitive bias.
1 Introduction
Consider the following problem: You are asked to draw a red marble from
either of two urns. Urn A contains 10 marbles, 1 of which is red. Urn B
contains 100 marbles, 7 of which are red. Which urn do you choose? A
rational actor maximizing the probability of choosing a red marble will
choose Urn A. Psychologist Seymour Epstein and colleagues (1992, 1994, 1999)
have documented that many individuals choose Urn B when presented with this
choice or similar choices. Epstein named this the Ratio-Bias phenomenon, as
it appears that individuals are biased toward choices with large numbers of
potential successes, rather than large probabilities of potential successes.2
The present investigation explores the Ratio-Bias phenomenon along two
dimensions. First, we test for errors within this framework in a symmetric
fashion. Referring to the example above, we not only present participants
with decisions like that one, but also with decisions in which the urn with
the larger number of marbles has the greater probability of success and is
therefore the optimal choice. If we observe similar frequencies of errors in
these two circumstances, then we conclude that there is no real Ratio-Bias
phenomenon, but rather observation of random error in both directions. If
the frequency of irrational decisions differs across these treatments,
however, then we conclude that the Ratio-Bias phenomenon exists.
The second dimension of interest is that of incentives. The participant in a
Ratio-Bias experiment confronts a decision that is well suited to the
introduction of a small monetary incentive and the testing of its marginal
effect. We implement a combination within- and between-subjects design to
test the effect of monetary incentives on decision making, as well as
varying the size of the incentive to test for the effect of incentive
magnitude on decision optimality.
2 Previous research
Much extant research on the Ratio-Bias phenomenon has presented participants
with decisions where the urn containing more potential successes (in
absolute numbers) has a smaller probability of success. Denes-Raj and
Epstein (1994) presented participants with a choice between a 1-in-10 chance
of success and a 9-in-100 chance of success, and also a choice between
1-in-10 and 7-in-100. They found that many individuals (61% and 40%,
respectively) preferred the latter choice (the large urn), while the former
(the small urn) offered a greater probability of success. Kirkpatrick and
Epstein (1992) presented participants with a choice between 1-in-10 and
10-in-100, and asked whether the participant would be willing to pay 10
cents for the privilege of choosing the larger urn (and winning $8 on a
successful draw). By charging money to choose the large urn, Kirkpatrick and
Epstein reduced the payoff to choosing the large urn and thus made the small
urn the optimal choice. They found that a significant fraction of
individuals chose the large urn. These experiments, while certainly
interesting and suggestive, did not also test the symmetric decision in
which the larger urn has a greater probability of success (or the larger
reward). The current experiment tests (for instance) not only 1-in-10
against 7-in-100, but also 1-in-10 against 13-in-100. If we observe similar
rates of errors in the two symmetric situations, then we conclude that the
Ratio-Bias phenomenon does not really exist at all, and the previous results
are merely a manifestation of the stylized fact that individuals sometimes
choose suboptimally when making decisions with little or no incentive to
choose optimally. If, however, we observe a significantly higher error rate
for the 1-in-10 against 7-in-100 choice than for the 1-in-10 against
13-in-100 choice, then we conclude that the Ratio-Bias phenomenon exists.
The second treatment dimension for this experiment is the introduction of a
small monetary incentive for success in some sessions and in some rounds. As
mentioned above, Kirkpatrick and Epstein (1992) presented the participant
with the choice of a 1-in-10 or 10-in-100 chance of winning $8, but charged
the participant 10 cents for the privilege of choosing the large urn. By
doing so, they offered a choice between an expected 80 cents for the small
urn and an expected 70 cents for the large urn. They found that a
substantial fraction of individuals choose the large urn in this situation,
though the small urn is the optimal choice. However, they did not directly
compare these results with an identical, but unincentivized control group,
and were thus unable to test directly for the impact of the incentive.
The experimental economic literature on the impact of the existence and
magnitude of monetary incentives is rich. See Camerer and Hogarth (1999) for
a general review. More specifically for our current interest, Blumenschein,
et al. (1997) investigated hypothetical and real incentives in Vickrey
auctions, and found a significant difference in behavior when real money is
on the table. More recently, Holt and Laury (2002, 2005) introduced real
incentives to the seminal Kahneman and Tversky (1979) framework, which
relied entirely on hypothetical incentives, and obtained results
significantly different from the earlier Kahneman-Tversky results. The
Blumenschein et al. and Holt-Laury results suggest that the existence of a
monetary incentive causes a substantial change in participant behavior.
Other work has investigated varying the size of the monetary incentive.
Thaler (1986) argues that once a monetary incentive is introduced, raising
the stakes will not necessarily induce more rational decisions. Attempting
to test this, Roth et al. (1991) compared the results of several
experiments across four countries with different standards of living and
therefore different real values of the payoffs. They found significant
differences in behavior, but this design leaves open the question of how
much of the difference is attributable to the size of the incentive, and how
much is due to varying cultural factors and norms across countries. Others
have found similar results with similar methodologies and similar caveats -
see Cameron (1990) or Slonim and Roth (1998). The present experiment
provides a convenient framework in which to test the differential impact of
both the existence of a real incentive and its magnitude. We employ both
within- and between-subjects treatments on participants drawn from the same
population.
3 Experiment
In order to test for the existence of the Ratio-Bias phenomenon and the
effect of incentives, we conducted an experimental investigation over the
course of two semesters. Participants were recruited from the general
population of students at a northeastern U.S. liberal arts college via word of
mouth and announcement in psychology and economics classes. In sessions in
which money was earned, this was not announced prior to the students'
volunteering and appearing for the experiment.
3.1 Software
The authors created a custom software application to facilitate data
collection.3 The design of the
experiment and the decision with which it presents the participant draws
heavily upon the previous work by Epstein and colleagues, in order to
facilitate comparison of results. The application presented the participant
with 300 rounds of a binary decision. The participant's task in each round
was to select the virtual urn from which a virtual marble will be randomly
drawn. Urn A always contained ten virtual marbles, while Urn B always
contained one hundred virtual marbles. Each urn was visually represented on
the computer monitor, with the left-right location of the two urns randomly
determined (each urn was equally likely to be on the left or right). Below
each urn was a count of the total number of marbles and the number of red
marbles. The upper left corner showed a count of the number of the round and
a running total of the number of points the participant had earned
throughout the session. The participant chose an urn by clicking the
"Choose" button beneath it with the mouse.
The participant earned one point if the drawn marble was red. The number of
red marbles in each urn was determined as follows: First, the number of red
marbles in Urn A was randomly determined to be 1, 2, 3, or 4, with equal
probabilities of each outcome. (The rest of the marbles were white). Then
the number of red marbles in Urn B was determined to be ten times the number
in Urn A, plus a deviation which we call epsilon. epsilon was
a randomly generated parameter, with equal probabilities that it equaled -3,
-2, -1, 1, 2, and 3. Figure 1a shows a screen capture of actual game play.
In this case the base fraction of red marbles is 30% and epsilon = -2,
and therefore the fraction of red marbles in the big urn is 28% (30% plus epsilon). In this case, Urn A is displayed on the left; as stated above,
this is randomly determined.
a.
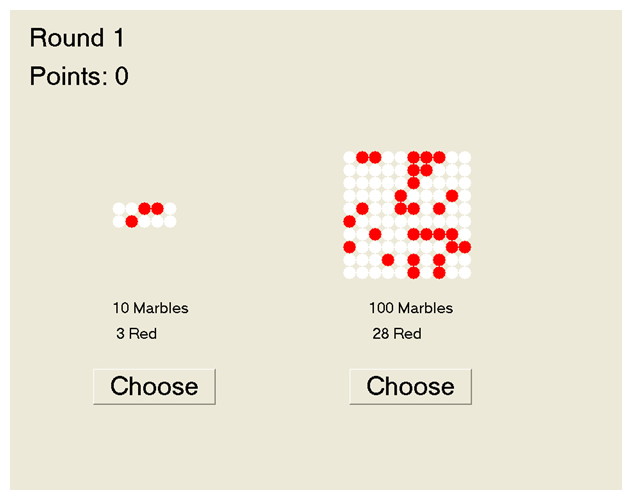
b.
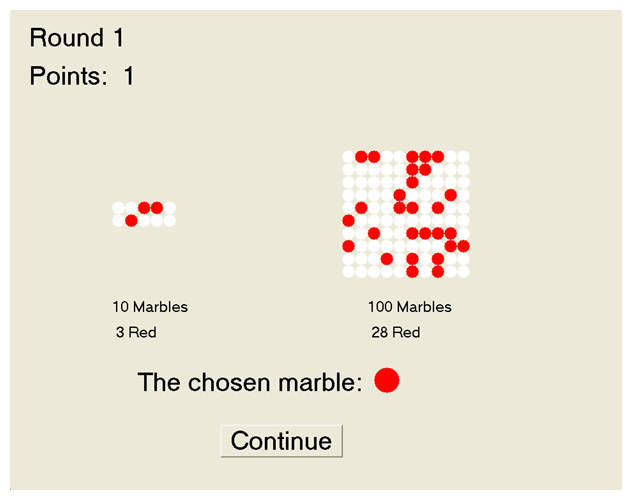 Figure 1: Screen capture of game choice (a) and feedback (b).
After the participant chose the urn from which to draw a virtual marble, the
marble was drawn and the result (red or white) displayed. At this point, the
participant clicked a "Continue" button
to proceed to the next round, as shown in Figure 1b. Note that the
"Continue" button is located between the
two "Choose" buttons on the screen; this
forces the participant to return the mouse to the center of the screen,
between the two urns, each round. Figure 1b shows a successful round, in
which the participant has earned a point by drawing a red marble.
Participants were allowed to proceed through 300 rounds at their own pace,
but were not dismissed (and paid, if applicable) until all participants had
completed all rounds.
Figure 1: Screen capture of game choice (a) and feedback (b).
After the participant chose the urn from which to draw a virtual marble, the
marble was drawn and the result (red or white) displayed. At this point, the
participant clicked a "Continue" button
to proceed to the next round, as shown in Figure 1b. Note that the
"Continue" button is located between the
two "Choose" buttons on the screen; this
forces the participant to return the mouse to the center of the screen,
between the two urns, each round. Figure 1b shows a successful round, in
which the participant has earned a point by drawing a red marble.
Participants were allowed to proceed through 300 rounds at their own pace,
but were not dismissed (and paid, if applicable) until all participants had
completed all rounds.
3.2 Sessions and treatments
Treatments varied across sessions, with all participants in a given session
getting the same treatment. Each session consisted of 300 rounds for each
participant. In Session 1, no monetary compensation was given. In Session 2,
each successful draw earned the participant 5 cents for all rounds. In
Session 3, each successful draw earned the participant 10 cents for all
rounds. In Session 4, the participant earned nothing for points earned
during the first 150 rounds, then earned 10 cents for each point earned
from Round 151 through Round 300. Session 5 was the converse of Session 4:
each participant earned 10 cents for each point earned during the first 150
rounds, then earned nothing for points earned from Round 151 through Round
300. In Session 6, participants were given $4 regardless of the number of
points earned. For the purposes of our analysis, we treat session 6 as a
control treatment with no incentive, since payment was not a function of
performance. The payment structure of the particular treatment was announced
at the beginning of each session. Participation also partially fulfilled
course requirements in psychology for some participants. A session typically
took about 45 minutes to complete. See Table 1 for a summary of the
incentives offered by session.
Table 1: Incentives by session
| Session | Rounds 1-150 | Rounds 151-300 |
|
1 | none | none |
| 2 | 5 cents | 5 cents |
| 3 | 10 cents | 10 cents |
| 4 | none | 10 cents |
| 5 | 10 cents | none |
| 6 | flat $4 for participation) |
|
|
3.3 Participants
Rather than arbitrarily limit the number of participants in any session, we
allowed all volunteers who appeared for a particular session to participate
(though participants were not allowed to participate in more than one
session). As a result, the number of participants varied across sessions.
See Table 2. (One participant was omitted for being an outlier,
responding consistently incorrectly. Results are substantively the
same with this subject included.)
Table 2: Participants by session
| Session | Participants |
|
1 | 34 |
| 2 | 26 |
| 3 | 21 |
| 4 | 28 |
| 5 | 28 |
| 6 | 34 |
|
|
In a few cases, computer failures resulted in the loss of a few rounds of
data. Specifically, in Session 3, three computer crashes resulted in the
loss of the last 7, 9, and 6 rounds of data, and in Session 5, one computer
crash resulted in the loss of the last 9 rounds of data.
3.4 On the magnitude of the incentive
In several treatments, participants were paid according to the number
of red marbles drawn. The largest such incentive was 10 cents per
point earned (red marble drawn). With the parameters used in the
experiment, a participant choosing randomly between the two urns would
have an average probability of drawing a red marble of 25%. A
participant choosing optimally would increase this by an average of
1% to an expected 26% probability of success. Thus, the return to
thought created by the 10 cents incentive is, on average, one-tenth of
a cent per round, or a total of 30 cents over the entire 300 round
experiment (if all rounds are incentivized). The nickel incentive is,
obviously, half this amount.
4 Results and data analysis
In studies like this one, heterogeneity across subjects is a serious concern
when estimating relationships in the data. In order to make our hypothesis
testing as clear and as conservative as possible. we aggregated the fraction
of optimal choices for each subject across each of the treatment conditions
under discussion; we therefore have 162 observations for each treatment
condition. All of the tests below
compare within-subject differences in behavior across the treatment conditions.
4.1 Existence of ratio bias phenomenon
Our first salient result is confirmation of the existence of the ratio
bias phenomenon. When epsilon is negative, a participant wishing to
maximize the probability of drawing a red marble should choose the
small urn; although the number of red marbles in the large urn is
greater, the total number of marbles in the large urn is such that the
probability of drawing a red marble from the large urn is smaller than
the probability of drawing a red marble from the small urn. Table 3
shows decisions by subjects by the sign of epsilon, aggregating
across all rounds and all sessions. Each subject's average is treated
as a data point here; the standard deviation of the subjects' optimal
decision rates is given in parentheses.
Table 3: Optimal decisions by epsilon (across-subject standard deviations
in parentheses)
| epsilon | Optimal decision rate | (s.d.) |
|
-3 | 59.7% | (26.9%) |
| -2 | 59.0% | (26.9%) |
| -1 | 58.2% | (27.9%) |
| 1 | 74.3% | (21.4%) |
| 2 | 75.6% | (20.3%) |
| 3 | 77.2% | (19.8%) |
|
|
When epsilon is negative, the small urn is the optimal choice; this is the
treatment that has been tested by previous research. The large urn is the
optimal choice when epsilon is positive; this is the heretofore untested
treatment. Table 3 clearly shows that participants incorrectly choose the
large urn when epsilon is negative far more frequently than they incorrectly
choose the small urn when epsilon is positive. Indeed, participants
correctly chose the small urn only 59.0% of the time when epsilon was
negative; this is remarkably low, since as this is a binary decision,
randomly choosing an urn would lead to a 50% rate of optimal decisions.\
Interestingly, participants chose optimally only 75.5% of the time when the
large urn was optimal. This error rate indicates that previous studies
lacking this control condition may have overstated the magnitude of the
ratio-bias phenomenon if they attributed all errors to the bias.
Although the effect of increasing epsilon is significant for both
negative and positive values of epsilon (respectively,
t160=2.28, p=0.0238, and t160=2.49, p=0.0140), these
effects were very small compared to the effect of whether epsilon
was positive or negative, and they are ignored henceforth.
4.2 Practice effects
We can ask whether performance improved from the first half (rounds
1-150) to the second half (rounds 151-300). Ignoring sessions 4 and
5 (where incentive changed between the two halves), overall proportion
of optimal choices did not change (means of .67 and .66 for the two
halves, respectively, t104=-.37).
We can also ask whether the ratio bias effect changed, where bias is
defined as the difference between optimal choices with positive and
negative epsilon. Here, the change between the two halves was
significant. The mean bias was .12 for the first half and .08 for the
second half (t104=2.68, p=0.0086). Thus, although overall
accuracy did not increase, the tendency to choose the urn with more
marbles did decrease over rounds.
4.3 No effect of base odds
One might also be interested in whether the manipulation of base odds
affected decision optimality rates. In our data, this was not the case.
Table 4 shows optimal decision rates by each value of base odds.
Table 4: Optimal Decisions by base odds (across-subject standard
deviations in parentheses)
| Base odds | Optimal decision rate | (s.d.) |
|
10% | 67.6% | (17.9%) |
| 20% | 67.9% | (19.4%) |
| 30% | 67.4% | (19.7%) |
| 40% | 66.4% | (19.9%) |
|
|
Simple t tests do not show a significant difference in optimal decision
rates across these four treatment conditions.
4.4 Incentives affect accuracy
Our second salient result is that the presence of an incentive affects
behavior. To test within-subject differences here, we confined our attention
to sessions 4 and 5. Table 5 shows optimal decision rates by the presence
of a monetary incentive.
For this test, we have only 56 data points. A t test of the
interaction between half (first half vs\. second half) and session
(session 4 with incentive in the second half, session 5 with incentive
in the first half) was significant (t54=2.90, p=.0054, two tailed),
indicating better performance with incentive.
Figures 2 and 3 show the means by half (first 150 vs. second 150
rounds) for both optimal choice and bias, respectively. As is
consistent with the large standard errors, no between-subject test of
the incentive effect was significant. Moreover, comparison of
sessions 4 and 5 on the bias measure shows that incentive, if
anything, increased the bias, although the interaction between half
(1st vs. 2nd) and session (4 vs. 5) was not significant
(t54=1.62).
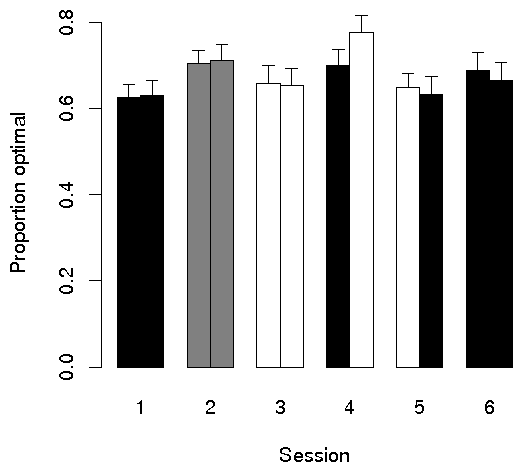
Figure 2: Proportion of optimal choices as a function of session and
half: black bars represent no incentive (or fixed payment), white
bars represent 10 cents, and gray bars, 5 cents. Error bars are
standard errors of the means displayed.
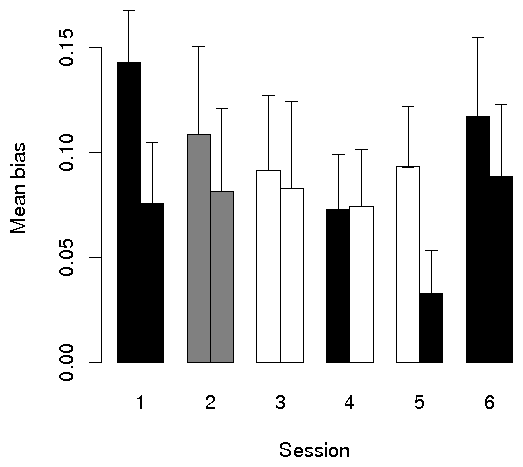
Figure 3: Bias toward the higher number as a function of session and
half: black bars represent no incentive (or fixed payment), white
bars represent 10 cents, and gray bars, 5 cents. Error bars are
standard errors of the means displayed.
5 Discussion and Conclusions
5.1 Confirmation of existence of Ratio Bias phenomenon
The first salient fact arising from this experiment and analysis is
confirmation of the ratio bias phenomenon. In our data, suboptimal choices
are far more frequent when the small urn is the optimal choice than when the
big urn is optimal. This finding is robust to all of the other treatment
conditions in the experiment - whether the participant is incentivized, the
size of the incentive, the base odds of a successful draw, and the magnitude
of the difference between the odds of a successful draw between the large
and small urns.
5.2 Effect of incentive
Our second important result concerns the impact of incentives on these
decisions. In our data, the introduction of a small incentive significantly
reduces the frequency of suboptimal choices, although only in the
(more sensitive) within-subject analysis. Interestingly, the incentive
seems to matter despite its astoundingly small magnitude. In this experiment
with our maximum incentive (10 cents per successful draw), an individual
choosing urns completely randomly would expect to earn a total of 30 cents
less than an individual who chooses optimally in every round.
5.3 Other findings
We found no effect of different base odds on the patterns of participant
decisions. Both of our major findings (the existence of the ratio bias
effect and the effect of the incentive) manifest themselves similarly when
the base odds of drawing a red marble are 10%, 20%, 30%, and 40%.
Moreover, changing the magnitude of the difference between the probability
of success in the two urns had little impact on participant decisions in our
data. Within the range we considered (-3% through +3%), observed behavior
was roughly the same across all negative values of epsilon and across all
positive values of epsilon.
The ratio bias itself, the tendency to choose on the basis of
numerosity, thus leading to more optimal choices when these
corresponded to the larger urn (and hence a difference between
positive and negative epsilon), declined over rounds, suggesting
that participants achieve some insight on their own. This bias was
not reduced by incentive. Possibly the incentive leads people to fall
back on a favored strategy.
The fact that incentives affected optimal choices but not the ratio
bias suggests another possible locus of the incentive effect. It is
interesting that only one subject chose the optimal response on every
round. The failure of most subjects to optimize may be analogous to
the (poorly named) research on "probability matching," which finds a
general failure to optimize in repeated plays (e.g., West &
Stanovich, 2003.) If this is true, then our results are somewhat
consistent with those of Shanks et al. (2002), who found that
performance improves substantially with incentive and practice
combined. Incentive seems to help people learn to choose the option
that is most likely to win.
5.4 Further Research
Several interesting questions remain, primarily related toward extending
this methodology along two dimensions. First, how does the ratio bias
phenomenon behave for larger values of epsilon? There is certainly a point
where the absolute number of red marbles in the big urn is smaller than that
in the small urn, and our strong prior expectation would be 100% optimal
choice at this level of epsilon (everyone would choose the small urn). But
how does the ratio bias effect manifest itself for values of epsilon between
this point and the values we examined here? Does the bias remain constant
until abruptly ending at that point or some other point, or is there a more
gradual reduction in the error rate?
Perhaps an even more interesting research problem is to learn more about the
potential response to different size incentives within this framework. Along
this dimension, there are interesting research questions in both directions.
How small can the incentive get before individuals stop responding to it
altogether? Moreover, what is the relationship between the size of the
incentive and behavior for larger incentives than those examined here?
Does increasing the incentive, and thus increasing the expected cost of an
error, reduce the error rate? This research problem is of particular
interest to experimental psychologists and behavioral economists seeking
experimental methodology and results that generalize to situations where
individuals are highly incentivized.
References
Blumenschein, K., Johanneson, M., Blomquist, G., Liljas, B., &
O'Conor, R. (1997). Hypothetical versus real payments in Vickrey auctions.
Economics Letters 56, 177-180.
Camerer, C., & Hogarth, R. (1999). The effects of financial
incentives in experiments: A review and capital-labor-production framework.
Journal of Risk and Uncertainty 19, 7-42.
Cameron, L. (1999). Raising the stakes in the ultimatum game:
Experimental evidence from Indonesia. Economic Inquiry, 37, 47-59.
Denes-Raj., V., & Epstein, S. (1994). Conflict between intuitive
and rational processing: when people behave against their better judgement.
Journal of Personality and Social Psychology, 66, 819-829.
Epstein, S. (1990). Cognitive-experiential self-theory. In L. Pervin
(Ed.), Handbook of Personality Theory and Research
(pp. 165-192). New York: Guilford Press.
Epstein, S. (1994). Integration of the cognitive and
psychodynamic unconscious. American Psychologist, 49, 709-724.
Gigerenzer, G., & Goldstein, D. G. (1999). Betting on one good
reason: The take the best heuristic. In G. Gigerenzer, P. M. Todd, &
the ABC Research Group (Eds.), Simple Heuristics that Make Us
Smart (pp. 75-95). New York: Oxford University Press.
Holt, C., & Laury, S. (2002). Risk aversion and incentive
effects. American Economic Review, 92, 1644-1655.
Holt, C., & Laury, S. (2005). Risk aversion and incentive effects:
New data without order effects. American Economic Review, 95,
902-912.
Kahneman, D., & Tversky, A. (1979). Prospect theory: An
analysis of decision under risk. Econometrica, 47, 263-291.
Kahneman, D., Slovic, P. & Tversky, A. (1982). Judgment under
uncertainty: heuristics and biases. New York: Cambridge University Press.
Kirkpatrick, L. A., & Epstein, S. (1992) Cognitive-experiential
self-theory and subjective probability: further evidence for two conceptual
systems. Journal of Personality and Social Psychology, 63, 534-544.
Pacini, R., & Epstein, S. (1999). The interaction of three facets of
concrete thinking in a game of chance. Thinking and
Reasoning, 5, 303-325.
Piaget, J. & Inhelder, B. (1975). The Origin of the Idea of
Chance in Children. New York: Norton (originally published 1951).
Roth, A., Prasnikar, V., Okuno-Fujiwara, M., & Zamir, S.
(1991). Bargaining and market behavior in Jerusalem, Ljubljana, Pittsburgh,
and Tokyo: An experimental study. American Economic Review, 81,
1068-1095.
Shanks, D. R., Tunney, R. J., & McCarthy, J. D. (2002). A
re-examination of probability matching and rational choice.
Journal of Behavioral Decision Making, 15, 233-250.
Slonim, R., & Roth, A. (1998). Learning in high stakes ultimatum
games: An experiment in the Slovak Republic. Econometrica,
66, 569-596.
Thaler, R. (1986). The Psychology and Economics Conference
Handbook: Comments on Simon, on Einhorn and Hogarth, and on Tversky and
Kahneman. Journal of Business, 59, 279-284.
Tversky, A., & Kahneman, D. (1974). Judgement under uncertainty:
heuristics and biases. Science, 185, 1124-1131.
West, R. F. & Stanovich, K. E. (2003). Is probability matching
smart? Associations between probabilistic choices and cognitive
ability. Memory and Cognition, 31, 243-251.
Appendix A: Experimental Protocol
Presented here are the oral instructions read to participants at the
beginning of each session.
When I instruct you to begin, the computer monitor in front of you will
display two groups containing different mixtures of white and red marbles.
Your assignment is to accumulate the most red marbles possible. To do this,
you will choose from which group of marbles you think you have the best
chance of successfully getting a red one. After you make your choice, the
computer will select a marble from the group you have chosen, just as if you
had reached your hand into a bag containing all the marbles in your group
and picked one at random.
[By session:]
- (no instructions)
- You will be compensated five cents for every time the computer chooses
a red marble from the group you select.
- You will be compensated ten cents for every time the computer chooses
a red marble from the group you select.
- You will be compensated ten cents for every time the computer chooses
a red marble from the group you select during Rounds 151 through 300.
- You will be compensated ten cents for every time the computer chooses
a red marble from the group you select during Rounds 1 through 150.
- You will be compensated $4 for your participation.
To make your selection click on the "choose" button directly under
the group you want the computer to pick from. After you make a
selection, the computer will tell you if it picked a red or white
marble from the group you chose. Then, hit continue to choose from the
next set of groups. You will be given 300 sets of groups to choose
from. After the 300th choice you make, the computer will signal to you
that your session is over. You have as much time as you need to
complete this task. When everyone is done you will be debriefed and
then dismissed. When I give the word hit "G" on your keyboard to
begin. Are there any questions? Hit G and begin.
Footnotes:
1The authors would like to thank an
anonymous referee for helpful and insightful comments, and
Jonathan Baron for help with data analysis. We would also like to
thank the Dean of the College for Academic Life at Muhlenberg
College for her support of this project. Donald Dale's address:
2400 Chew Street, Allentown PA 18104, U.S.A.;
Email: dondale@muhlenberg.edu
2The task was first used by Piaget & Inhelder (1975).
3Software was written in Microsoft Visual Basic and is available from the
authors. Email dondale@muhlenberg.edu to obtain a copy.
File translated from
TEX
by
TTH,
version 3.67.
On 25 Aug 2007, 07:43.