Judgment and Decision Making, vol. 4,
no. 5, August 2009, pp. 419-428
How different types of participant payments alter task performanceGary L. Brase*
Department of Psychology, Kansas State University |
Researchers typically use incentives (such as money or course
credit) in order to obtain participants who engage in the specific
behaviors of interest to the researcher. There is, however, little
understanding or agreement on the effects of different types and
levels of incentives used. Some results in the domain of
statistical reasoning suggest that performance differences —
previously deemed theoretically important — may actually be due to
differences in incentive types across studies. 704 participants
completed one of five variants of a statistical reasoning task, for
which they received either course credit, flat fee payment, or
performance-based payment incentives. Successful task completion
was more frequent with performance-based incentives than with either
of the other incentive types. Performance on moderately difficult
tasks (compared to very easy and very hard tasks) was most sensitive
to incentives. These results can help resolve existing debates about
inconsistent findings, guide more accurate comparisons across
studies, and be applied beyond research settings.
Keywords:participant methodology, monetary incentives, judgments under
uncertainty, statistical probability, performance.
1 Introduction
In the behavioral sciences, research participants typically must be
provided with some type of incentive for their participation (much
like employees typically must be paid). Although it has long been
noted that the amount of incentive provided to animals can influence
subsequent performance (e.g., the Crespi Effect; Crespi, 1942, 1944),
the use of research incentives for humans has been characterized by
both inconsistencies across fields and controversy about
effectiveness. The norm in psychological research is to tie research
participation to course credit (often as part of an introductory
psychology course) or occasionally some other form of set payment
amount (i.e., a flat-fee). In contrast, the norm in economics
research is to pay participants with money and to scale those payments
to performance within the research (i.e., performance-based
incentives).
It has recently been noted that such discrepancies in methodology can
have implications for cross-disciplinary variations in results and
theoretical conclusions from research. Retrospective reviews of past
studies have made the case that there is a real issue regarding the
effects of participant incentives, but they disagree on what these
studies show (Camerer & Hogarth, 1999; Hertwig & Ortman, 2001;
Rydval & Ortmann, 2004). Camerer & Hogarth (1999) focused on
performance-based incentives and found little evidence for global
improvements in performance, but more subtle effects of reduced
variability in responses, reduced presentation effects, and perhaps
performance improvements specifically in judgment tasks that are
“responsive to better effort.” Ortmann & colleagues (Hertwig &
Ortmann, 2001; Rydval & Ortmann, 2004), found similar results as
Camerer & Hogarth, but also found reason to be more optimistic about
the effects of financial incentives. They concluded that “in the
majority of cases where payments made a difference, they improved
people’s performance” (p. 394) and that “although payments do not
guarantee optimal decisions, in many cases they bring decisions closer
to the predictions of the normative models. Moreover, and equally
important, they can reduce data variability substantially” (p. 395).
Within psychology there has been general debate about the
effectiveness of incentives (generally, financial incentives), with
some arguing for and finding that incentives are important motivators
(Epley & Gilovich, 2005; Shanks, Tunney, & McCarthy, 2002; Stone &
Ziebart, 1995), but others taking contrary positions or finding null
results (Crano, 1991; Jenkins, Mitra, Gupta, & Shaw, 1998; Wright &
Anderson, 1989). Two factors complicate this controversy. The first
factor is the use of diverse behaviors on which the effects of
incentives have been assessed, ranging from simple perceptual tasks (e.g.,
Pritchard & Curtis, 1973) to complex social coordination tasks (e.g.,
Parco, Rapoport, & Stein, 2002). If, as is often supposed, financial
incentives should increase effort on tasks, this will be manifested
only for tasks on which additional effort yields clear response
improvement. (Tasks in which participants are already performing at or
near their best are not likely to show much improvement, nor are tasks
that are so difficult as to be beyond the participant’s abilities.)
The second factor is the type of incentive used. When financial
incentives are used in psychology they are typically flat-fee
payments, which are more directly analogous to the non-financial
course credit “payments” that are the norm in psychology, but both
of these are very different — in terms of incentive structure —
from performance-based financial incentives. It therefore remains
unclear how different types of incentives do (or do not)
systematically affect performance across different types of tasks and
different levels of task difficulty.
In experimental economics, by contrast, researchers commonly use
performance-based financial incentives and reject the methodology
typical of psychology as insufficient in several respects (Hertwig &
Ortmann, 2001). Specifically, it is argued that performance-linked
incentives serve to: a) reduce variance in performance, b) avoid
problems of satiation (i.e., more money is always desirable), thereby
maintaining high levels of attention and motivation, c) make the target
behaviors clear and easy to establish, and d) maximize efforts towards
optimal behavior or performance.
1.1 Theoretical implications of incentives
Understanding the effects of different types and levels of incentives
on performance is also important in assessing — and sometimes even
resolving — controversies about experimental effects. For example,
Brase, Fiddick, and Harries (2006) found that an ongoing dispute about
the effectiveness of different numerical formats on statistical
reasoning could in principle be resolved entirely by taking into
account the different participant populations and different incentives
used across studies. Starting with “high water mark” performances
of over 70% of participants demonstrating correct statistical
reasoning (using flat-fee paid participants from top-tier national
universities), a drop in performance of about 20 percentage points was
found with movements from monetary payments to course credit. An
additional 20 percentage points drop in performance was found with
changes from top-tier university participants to regional university
participants. Thus, for example, a 51% correct statistical reasoning
performance found by Sloman, Over, Slovak, and Stibel (2003) is not at
all incompatible — as they imply — with the 72% correct
performance found by Cosmides and Tooby (1996) on the same task. A
sufficient explanation is the different incentives used: voluntary
participation after university lectures in the former, and flat-fee
paid participation in the latter.
One can look at general trends in this literature over the past
decade, sorting performance both by the types of presentation of
statistical reasoning tasks — using naturally sampled frequencies and
pictorial representations generally aid performance — and by the type of
incentives used. As Table 1 shows, there is a
curious pattern: incentives seem to
facilitate performance for the easier tasks presented in natural
frequencies, but they have little effect on the harder tasks
presented in normalized numbers. Despite the fact that these tasks are
conceptually isomorphic (i.e., Bayesian inference), the nature of the
incentives appears to interact with the level of task difficulty.
There are no comparable studies of Bayesian reasoning in which
performance-based financial incentives were used.
| Table 1: Some recent results in Bayesian inference
tasks: Percent of participants reporting the correct posterior
probability in statistical reasoning tasks, based on the type of
incentives used and type of presentation of the task. Results
presented here include only participants from national universities
(see Brase, et al., 2006) and only conditions in which the type of
presentations clearly fell within the given categories. |
| | Flat fee payment | In-class / course credit |
Normalized numbers (e.g., percentages) | 16%a
20%b | 30%c
20%d |
Normalized numbers, with pictures | | 48%d |
Natural frequencies | 46%a
68%b
64%e | 42%c
41%d
40.5%e |
Natural frequencies, with pictures | 76%b
70.8%e
92%b (active) | 45%d
46.7%e |
a Gigerenzer and Hoffrage, 1995;
standard probability and standard frequency formats, average rates
b Cosmides & Tooby, 1996: conditions E1-C1, E5,
E6-C1, E6-C2, and conditions E1-C2, E2-C1, E3-C1, E3-C2, average rates;
pictorial conditions: Experiment 4
c Evans, et al., 2000: Frequency Easy/Frequency
Question versus Probability/Probability Question conditions in
Experiments 1–2
d Slomin, et al., 2003: Experiments 1, 1B, and 2
e Brase, Fiddick, & Haries, 2006: Experiments 1, 3,
and 4 |
Despite wide interest and implications, little systematic empirical data
have been produced on this issue and much of what does exist are
retrospective analyses of prior, heterogeneous studies (such as Table
1, with the exception of Brase, et al., 2006, which is the only study
of these that manipulated participant incentives at a variable). The
aim of the present research was to compare performance across
different types of incentive conditions, while also systematically
varying task difficulty but holding constant the fundamental nature
of the task. Within this context, it was predicted that:
-
Performance will improve with the use of financial incentives,
specifically:
-
when the incentives are performance-based, rather than flat-fees,
and
- when the judgment task is of intermediate difficulty, rather than
very difficult or very easy (i.e, “responsive to
better effort,” in the words of Camerer and Hogarth,
1999).
- Increased effort on tasks when using performance-based incentives
will also be evident in measures other than correct performance
(similar to findings of reduced response variability, reduced errors,
and faster reaction times; Camerer & Hogarth, 1999; Hertwig &
Ortmann, 2001; Crespi, 1942, 1944).
2 Method
A total of 704 participants were provided with a Bayesian reasoning task
to solve. In approximately equal proportions, these participants were
given either: a) course research participation
“points”, b) paid a flat fee, or
c) paid a flat fee plus an incentive amount for attaining the correct
response. Participants were also given, in equal proportions, one of
five variants of the same task which varied in difficulty.
2.1 Participants
All 704 research participants were undergraduates at the University of
Missouri-Columbia, enrolled in introductory courses (Introductions to
Psychology, to Social Psychology, to Abnormal Psychology, etc.). All
participants were run within the same calendar year (paid participants
were all within the same semester). Participant debriefings provided
information about the nature and purpose of the research, but did not
give the correct answer to the tasks. (To discourage participant
cross-talk, only participants who specifically asked for the correct
answer were given that information and were also admonished to not
discuss it with anyone.) The goal was to obtain participant samples in
ways representative of current and prior research, while controlling
for as many other factors as possible.
254 participants received one course research credit in Introductory
Psychology for participating (with a total semester requirement of 12
half-hour credits), utilizing the existing research participation
system. These participants included 127 females and 126 males (1
participant failed to report a gender), and had an average age of 19.9
years.
242 other participants were recruited via psychology lectures other than
Introductory Psychology and participated immediately after the lectures
(these courses were also large introductory topics courses for which
Introductory Psychology was not a prerequisite and none were Cognitive
Psychology courses in which subject matter related to this task may
have been discussed). Participation was voluntary, and prospective
participants were instructed that they could not participate more than
once, even if in different classes. Each participant received $5.00
for participating, regardless of performance, an amount found just
sufficient, in informal surveying, to elicit some
participation. Participants included 154 females and 88 males,
and had an average age of 19.7 years.
Another 208 participants fitting the same criteria were recruited by
visiting lectures other than those visited previously. These
participant received either $3 (for participation) or $9 (the
initial $3, plus $6 for correct task solutions). These
included 128 females and 79 males (1 participant failed to report a
gender), with an average age of 20.1 years.1
| Table 2: Percentage of participants who reached the correct answer (10
out of 28, or .357) to a Bayesian reasoning task (across five types of
formats) when (a) receiving course credit for their participation, (b)
receiving a flat fee payment of $5 for their participation, or (c)
receiving a performance-based payment ($3 for an incorrect answer or
$9 for a correct answer). |
| | Course credit payment | Flat fee payment ($5) | Performance incentive ($3/$9) | Overall |
| Percentages | 0.0% (n=0/50) | 4.3% (n=2/47) | 9.5% (n=4/42) | 4.3% (n=139) |
| Percentages with picture | 28.0% (n=14/50) | 26.5% (n=13/49) | 40.5% (n=17/42) | 31.2% (n=141) |
| Natural frequencies | 23.5% (n=12/51) | 29.2% (n=14/48) | 54.8% (n=23/42) | 34.8% (n=141) |
| Natural frequencies + picture | 40.4% (n=21/52) | 33.3% (n=16/48) | 65.9% (n=27/41) | 45.4% (n=141) |
| Natural frequencies + active picture | 54.9% (n=28/51) | 44.0% (n=22/50) | 63.4% (n=26/41) | 53.5% (n=142) |
| Overall | 29.5% (n=254) | 27.7% (n=242) | 46.6% (n=208) | 34.0% (n=704) |
2.2 Materials
Within each incentive condition, participants were randomly given one
of five different task formats, all variants of the same
Bayesian inference task (i.e., a task of determining the posterior
probability of an event, given some new information to be combined with
an initial base rate). This type of task was selected for two primary
reasons: it relates to and extends findings in previous research (Brase
et al., 2006; Cosmides & Tooby, 1996; Sloman et al., 2003), and it is
a task that is amenable to modifications that make it easier or more
difficult for participants to successfully complete; hence it provides
a good test case for the question of whether financial incentives
differentially improve performance on moderately challenging tasks that
are responsive to better effort.
Although every task had the same correct answer, previous research has
established that: a) using natural frequencies (i.e., non-normalized,
categorized whole numbers) improves performance (e.g., Gigerenzer &
Hoffrage, 1995; Hoffrage, Lindsey, Hertwig, & Gigerenzer, 2000) , b)
adding pictorial representations also improves performance to a
somewhat lesser extent (Brase et al., 2006; Cosmides & Tooby, 1996),
and c) active construction of pictorial representations may sometimes
also aid performance (Cosmides & Tooby, 1996; but see Brase, 2009).
Thus, without changing the fundamental nature of the task, this study
was able to manipulate task difficulty via these format changes. The
five task variants, from most difficult to least difficult, were: 1) a
problem using percentages information (i.e., normalized numbers); 2) a
problem using percentages and supplemented with a pictorial
representation; 3) a problem using natural frequencies; 4) a problem
using natural frequencies and supplemented with a pictorial
representation; and 5) a problem using natural frequencies and
supplemented with a pictorial representation that required
participants’ active construction using the picture.
The full text of the five task conditions are provided in the Appendix.
These tasks were ordered in terms of difficulty based on prior study
results (see Table 1), and the text was based on tasks used in Girotto
and Gonzalez (2001).
| Table 3: Results from binary logistic regressions using type of
participant payment and task format as as predictor variables and task
performance as the target (dependent) variable. |
| Variable | Odds Ratio (95% Cl) | Significancea |
| Course Credit Payment vs. Flat-Fee Payment | 0.899 (0.595–1.359) | .614 |
| Performance-based Payment | 2.410 (1.587–3.660) | <.001 |
| Normalized Percentage Format vs. Percentages + Pictures Format | 10.725 (4.359–26.390) | <.001 |
| Natural Frequencies Format | 12.676 (5.169–31.082) | <.001 |
| Natural Freqeuncies + Pictures Format | 20.328 (8.327–49.621) | <.001 |
| Natural Frequencies + Active Pictures | 28.664 (11.739–69.994) | <.001 |
| a Significance levels of the
contrasts were evaluated using the Wald statistic (the ratio of the
beta coefficient to its standard error, squared).
More specific comparisons were performed, using difference of
proportions tests, to evaluate particular issues in more detail. |
2.3 Design and procedure
All participants first completed a sheet of general study
information and receipts (for the conditions that involved monetary
payments). This was followed by the actual
Bayesian reasoning task. Upon completions, participants were
instructed to bring their consent form, receipt, and task to the
experimenter, who took these materials, paid the participants (in the
relevant conditions), and completed the receipts as necessary.
3 Results
Table 2 provides descriptive statistics for all conditions. Responses
were considered correct if and only if they were some form of the
correct answer of 10/28 (e.g., 10/28, 5/14, or .357 in decimal form).
Performance on different tasks, collapsing across incentive types
(rightmost column) showed substantial differences, ranging from 4.3%
to 53.5%. Performance under different incentive types, collapsing
across task formats, ranged from 27.7% to 46.6%.
These data were used to perform a binary logistic regression analysis,
with task performance as the target variable and incentive type and
task format as categorical predictors with indicator contrasts and the
reference categories as course credit incentive and normalized
percentages format. This analysis showed a significant overall model
for regression analysis (Chi-square=130.32, df =6, p
< .001; see Table 3). Specifically, performance-based
incentives produced significantly better performance than course
credit (p<.001), but flat-fee incentives were no different
from course credit. Participants performed significantly worse on the
normalized percentage format than on all other tasks (all
p<.001).
| Table 4: Percentage of participants, under each incentive condition, who
reached the correct answer (10 out of 28, or .357), the most frequent
incorrect answer (10% or 10 out of 100), and other answers. Incentive
conditions were: (a) receiving course credit for their participation,
(b) receiving a flat fee payment of $5 for their participation, or (c)
receiving a performance-based payment ($3 for an incorrect answer or
$9 for a correct answer). A higher Other/Hit Rate Ratio indicates
that proportionately more incorrect answers were likely effortful
calculations. |
| | Course credit payment | Flat fee payment ($5) | Performance incentive ($3/$9) |
| Correct response | 29.5% | 27.7% | 46.6% |
| Hit rate response (10%) | 32.3% | 38.0% | 23.1% |
| Other responses | 38.2% | 34.3% | 30.3% |
| Other responses / Hit rate ratio | 1.183 | .903 | 1.312 |
3.1 Incentives and performance
The logistic regression established that course credit and flat fee
incentives (set at $5) had similar effects with regards to task
performance. Although either of these incentives can be increased or
decreased to alter the level of incentive they provide (e.g.,
increasing the number of course credits or increasing the dollar
amount), both appear to motivate performance similarly.
Performance-based incentives, however, elicited higher levels of
performance than either of the other incentive conditions (comparing
flat fee incentives to performance based incentives: 27.7% versus
46.6%: z=4.15, p<.001, h=.39). This was not due to
appreciably higher overall levels of incentives provided to the
participant population as a whole, however; the performance-based
incentives conditions yielded an average payment of $5.84, compared
to the flat-fee incentive rate of $5.00.
Comparing the course credit incentive conditions to the
performance-based incentive conditions, it appears that a
performance-based incentive had greater impact for cognitive tasks of
medium difficulty, relative to very difficult or very easy tasks.
Specifically, the performance improvements when using the more
difficult percentage format tasks (top two rows of Table 2) were 9–12
percentage points, comparing across these types of payments.
Performance improvements were in the range of 25–31 percentage points
for the medium difficulty tasks (third and fourth rows of Table 2),
and then declined again to an 8 percentage point change for the
easiest task using both natural frequencies and interactive pictures
(fifth row of Table 2). Although tentative, these descriptive
statistics suggest that improvements in performance due to the use of
performance-based incentives may differ as a function of task
difficulty. It is not clear, however, whether such differences
reflect equal intervals of difficulty change. For example, an
improvement from 4% to 10% may not be equivalent to a change from
44% to 60% in terms of experienced difficulty. This consideration
also applies to the results reviewed in Table 1.
3.2 Task formats and performance
Collapsing across types of incentives used, the patterns of performance
replicated previous findings that natural frequencies elicit better
performance than normalized numbers (percentages) and that adding
pictorial representations also facilitate performance (as shown by the
overall row totals in the right-most column of Table 2). Natural
frequencies elicited better performance than percentages, both with
text only (4.3% versus 34.8%: z=6.42, p<.001, h=.84) and
with pictures (31.2% versus 45.4%: z=2.45, p=.007, h=.29). The
effect of natural frequencies, however, was much larger in the absence
of a pictorial aid. Pictures consistently elicited better performance
than text alone, both with percentages (4.3% versus 31.2%: z=5.88,
p<.001, h=.77) and with natural frequencies (34.8% versus
45.4%: z=1.82, p=.035, h=.22). The effect of pictures, however, was
larger when used with percentages rather than natural frequencies.
Taken together, these results suggest that the use of natural
frequencies and the use of pictures are both enhancing performance
independently, but via similar (partially overlapping) routes, either
by eliciting frequentist representations (Brase, Cosmides, & Tooby,
1998, Brase, 2002, 2009; Gigerenzer & Hoffrage, 1995) or by eliciting
some better representation of nested-set relationships (Sloman et al.,
2003).
3.3 Changes in correct/incorrect response patterns with
different incentive types
Past surveys have noted a reduction of variability of responses as a
function of monetary incentives, but such an assessment is difficult
with the present data because responses for Bayesian reasoning tasks
are generally scored as either correct or incorrect (i.e.,
dichotomously). The number of different (incorrect) responses is
problematic because diversity of such responses could be due to either
lack of effort (e.g., random responses) or greater effort (e.g.,
increasingly complicated calculations without reaching the correct
answer). Therefore, the assessment method used here was to compare
selected types of incorrect responses for indications of increased
effort on task, which is often the presumed source of reduced
variability. The most frequent incorrect answer was to respond with
the overall hit rate (10% or 10 out of 100), which is most likely due
to low effort (because it is simply repeated from the text of the task;
see Appendix). Other incorrect answers are often, although not always,
indicative of greater effort. Table 4 shows that, with
performance-based incentives, participants made fewer simple responses
of the overall hit rate as an answer (in addition to being more likely
to reach the correct answer), compared to either of the other two
incentive conditions
4 Discussion
Performance-based incentives can elicit significantly better
performance than either flat-fee or course credit incentives.
Furthermore, the effectiveness of incentives may be sensitive to the
task, with more improvement of performance on tasks of intermediate
difficulty. This pattern could be a result of either general
increases in effort that yield improvement only in intermediate
difficulty tasks, or a result of discretionary increases in effort put
into a task when participants perceive a high likelihood that the
additional effort could attain the correct response and that a correct
response will be rewarded.
This pattern of results can be understood in psychological terms
as increased motivation in anticipation of greater rewards or (not
mutually exclusively) in economic terms as participants maximizing an
objective function, given their available cognitive capital and the
particular production function of the experiment (see the
capital-labor-production framework of Camerer & Hogarth, 1999). More
generally, if one is dealing with smaller or more sensitive effects
within a field of study, the influences of participant
incentives can potentially explain the otherwise mysterious appearance,
disappearance, and reappearance of effects (e.g., an effect that
manifests as a 20 percentage point change from a fixed criterion could
be found with a study using performance-based incentives, fail to be
replicated in a study with fixed course credit incentives, then be
found again using performance-based incentives, and so on). This is
particularly important within the field of psychology because little
attention has been paid to varying participant recruitment methods (see
Brase, et al., 2006). One remaining issue is whether
there could be any subtle differences in participant demographics
(e.g., age, gender ratios, intelligence) between course credit
situations — usually introductory psychology students — and flat fee
situations, which are often not restricted to introductory psychology
classes. The present study followed the sampling procedures typically
used for these incentive types, keeping the demographics as consistent
as possible (same university, same types of courses, etc.). Further
research could attempt to obtain even more unequivocally homogeneous
groups to ensure that the effects of different incentive conditions are
stable.
The results of this research also further clarify the roles of natural
frequency numerical formats and of pictorial representations in
statistical reasoning. Both manipulations are effective additions for
improving performance, and they appear to be additive, but not entirely
independent, factors. The fact that there is a larger effect of
pictures with normalized frequencies (compared to natural
frequencies), holds implications for ongoing theoretical debates about
the nature of statistical reasoning (see Brase, 2008, 2009).
Some aspects of the generalizability of these results to other tasks and
to other incentive types remain to be more fully explored. The context
story used for the Bayesian reasoning task in this research was that of
a college admission test (see Appendix), but these results should
generalize to isomorphic conditional reasoning situations in medical,
legal, and clinical contexts (e.g., Hoffrage, Lindsey, Hertwig, &
Gigerenzer, 2000). Furthermore, these results converge with other
studies (using different types of context stories) on the effects of
numerical formats and of pictorial aids (e.g., Brase, 2002, Brase et
al., 1998; Gigerenzer & Hoffrage, 1995; Sedlmeier, 1999). There are,
however, important issues of generalizability with regards to even more
diverse types of tasks (e.g., perceptual judgments, procedural tasks,
and memory performance) and different methodologies. There are some
areas in which it is currently unclear if these findings apply and
there are some areas in which they likely do not apply:
-
Although money is a common and easily standardized incentive, it
is worth considering other forms of incentives. First, there has been
some concern about the broader, negative social effects of monetary
rewards (i.e., “monetization”) on
subsequent decision making and interpersonal behavior (Parco, Rapoport,
& Stein, 2002; Saini & Monga, 2008; Vohs, Mean, & Goode, 2006),
Second, the use of monetary incentives can prohibitively increase the
cost of research activities in many situations.
Also, other incentives may work as well or
better than money in terms of performance/cost ratios; for example
food, drink, or even human contact (Hayden et al., 2007) may have more
economical performance/cost relationships (as noted earlier, though,
these incentives would raise potential issues of satiation). A final
possibility is to structure incentives within the research experience
itself; for example, giving explicit
“points” to participants for
accurate performance or releasing participants earlier from the study
as a function of their initial performance.
- Applied outside of the research methodology arena, these results
may provide guidance for how to pay people for their time (e.g.,
salary/hourly wages) or their performance (e.g., commission based
payments). Depending on specific circumstances, the improvements in
performance using incentive-based payments could more than offset the
differences in average payments per person (in this study, $5.00
versus $5.84). Further research could also potentially utilize
additional methodologies, such as measuring solution times and analyses
of any written work that participants produce on their way to their
answers, to obtain a clearer understanding of individual differences in
responses.
- Whereas some studies (such as this one) are concerned primarily
with reducing errors and bias in responses, other studies are
focused on characterizing the nature of the errors and biases that
exist. In such situations, incentives are probably not necessary (and
in fact could reduce the amount of sought after response types).
- More powerful incentives can promote
more objectively correct answers only in situations where there
actually is an objectively correct answer. In some situations there is
not a single correct answer (e.g., the response is a matter of opinion,
the predicted response is based on a normative model, or the response
is a choice between gambles). The general instructions given to
participants in this particular study (see Appendix) were meant, in
part, to deter interpretive responses by asking for the
“typical” outcome (in case some
people were inclined to answer in terms of subjective/probabilistic
arguments) and explicitly giving instructions indicating that written
calculations were allowed.
- Finally, the finding that tasks of intermediate difficulty tend to
show the largest shift in performance when given performance-based
incentives raises issues about how to assess the difficulty level of
tasks and the interaction of this assessment with individual
differences in skill level (see Lord &
Novick, 1968).
In summary, assessments of task competence need to take into account the
incentives used in those assessments. Although conclusions about the
generalizability of these implications across psychology and the rest
of the behavioral sciences await more extensive research, there appear
to be potentially far-reaching ramifications. These effects are likely
to hold across a large number of decision making and other
psychological phenomena that involve moderately effortful inferential
procedures and could help explain a variety of reported discrepancies
and variations in experimental results.
So what should be done to deal with this situation? As a practical
matter, it is not feasible to dictate that all behavioral
research be conducted with one type of incentive. On the other hand,
planned research that endeavors to replicate prior findings must make
sure to faithfully follow not only the stimuli and other materials of
the prior work but also pay attention to the nature of
participants’ incentives in the original research.
Post hoc comparisons across studies need to be more careful
about comparing results from similar tasks but with dissimilar
participant recruitment processes. Finally, results within research
projects (e.g., multi-study reports) should freely compare relative
levels of performances across different studies only if those studies
have used the same recruitment methodology. When comparisons across
disparate types of participants or recruitment methods is necessary, it
should be clearly recognized that this is essentially a possible
confounding variable that could be influencing the results.
References
Brase, G. L. (2002). Ecological and evolutionary validity: Comments on
Johnson-Laird, Legrenzi, Girotto, Legrenzi, &
Caverni’s (1999) mental model theory of extensional
reasoning. Psychological Review, 109, 722–728.
Brase, G. L. (2008). Frequency interpretation of ambiguous statistical
information facilitates Bayesian reasoning. Psychonomic
Bulletin & Review, 15, 284–289.
Brase, G. L. (2009). Pictorial representations and numerical
representations in Bayesian reasoning. Applied Cognitive
Psychology, 23, 369–381.
Brase, G. L., Cosmides, L., & Tooby, J. (1998). Individuation, counting
and statistical inference: The role of frequency and whole-object
representations in judgment under uncertainty. Journal of
Experimental Psychology: General, 127, 3–21.
Brase, G. L., Fiddick, L., & Harries, C. (2006). Participant
recruitment methods and statistical reasoning performance.
Quarterly Journal of Experimental Psychology, 59, 965–976.
Camerer, C. F. & Hogarth, R. M. (1999). The effects of financial
incentives in experiments: A review and capital-labor-production
framework. Journal of Risk and Uncertainty, 19, 7–42.
Cosmides, L. & Tooby, J. (1996). Are humans good intuitive
statisticians after all? Rethinking some conclusions from the
literature on judgment under uncertainty. Cognition, 58, 1–73.
Crano, W. D. (1991). Pitfalls associated with the
use of financial
incentives (and
other complex manipulations) in human social research.
Basic and Applied Social Psychology,
12, 369–390.
Crespi, L. P. (1942). Quantitative variation of incentive and
performance in the white rat. American Journal of Psychology,
55, 467–517.
Crespi, L. P. (1944). Amount of reinforcement and level of performance.
Psychological Review, 51, 341–357.
Epley, N. & Gilovich, T. (2005). When effortful thinking influences
judgmental anchoring: differential effects of forewarning and
incentives on self-generated and externally provided anchors.
Journal of Behavioral Decision Making. 18, 199–212.
Evans, J. St. B. T., Handley, S. J., Perham, N., Over, D. E., & Thompson, V. A.
(2000). Frequency versus probability formats in statistical word problems.
Cognition, 77, 197–213.
Gigerenzer, G. & Hoffrage, U. (1995). How to improve Bayesian
reasoning without instruction: Frequency formats.
Psychological Review, 102, 684–704.
Girotto, V., & Gonzalez, M. (2001). Solving Probabilistic and
Statistical Problems: a Matter of Information Structure and Question
Form. Cognition, 78, 247–276.
Hayden, B. Y., Parikh, P. C., Dener, R. O., & Platt, M. L. (2007).
Economic principles motivating social attention in humans.
Proceedings of the Royal Society, B, 274, 1751–1756.
Hertwig, R. & Ortmann, A. (2001). Experimental practices in economics:
A methodological challenge for psychologists? Behavioral and
Brain Sciences, 24, 383–404.
Hoffrage, U., Lindsey, S., Hertwig, R., & Gigerenzer, G. (2000).
Communicating statistical information. Science, 290,
2261–2262.
Jenkins, G. D. Jr., Mitra, A., Gupta, N., & Shaw, J. D. (1998). Are
financial incentives related to performance? A meta-analytic
review of empirical research. Journal of Applied
Psychology, 83, 777–787.
Lord, F. M. & Novick, M. R. (1968).
Statistical theories of mental test scores.
Reading, MA: Addison-Wesley.
Parco, J. E., Rapoport, A., & Stein, W. E. (2002). Effects of
financial incentives on the breakdown of mutual trust.
Psychological Science, 13, 292–297.
Pritchard, R. D. & Curtis, M. I. (1973). The influence of goal
setting and financial incentives on task performance.
Organizational Behavior & Human Performance, 10,
175–183.
Rydval, O. & Ortmann, A. (2004). How financial incentives and cognitive
abilities affect task performance in laboratory settings: An
illustration. Economics Letters 85, 315–320.
Saini, R. & Monga, A. (2008). How I Decide Depends on What I Spend:
Use of Heuristics Is Greater for Time than for Money. Journal
of Consumer Research, 34, 914–922.
Sedlmeier, P. (1999). Improving statistical reasoning:
Theoretical models and practical implications. Mahwah, NJ:
Lawrence Erlbaum Associates, Inc., Publishers.
Shanks, D. R., Tunney, R. J., & McCarthy, J. D. (2002). A
re-examination of probability matching and rational choice.
Journal of Behavioral Decision Making, 15, 233–250.
Sloman, S. A., Over, D., Slovak, L., & Stibel, J. M. (2003). Frequency
illusions and other fallacies. Organizational Behavior and
Human Decision Processes, 91, 296–309.
Stone, D. N. & Ziebart, D. A. (1995). A model of
financial
incentive effects in decision making.
Organizational Behavior and Human
Decision Processes, 61, 250–261.
Vohs, K. D., Mead, N. L., & Goode, M. R. (2006). The psychological
consequences of money. Science, 314, 1154–1156.
Wright, W. F. & Anderson, U. (1989). Effects of situation
familiarity and financial incentives on use of the anchoring
and adjustment heuristic for probability assessment.
Organizational Behavior and Human Decision Processes, 44,
68–82.
Appendix
Full texts of the Bayesian reasoning tasks used in the study (for all
tasks the correct answer is 10/28; or .357 in decimal form). All tasks
were preceded by the following general instructions:
“The following question asks for your judgments about
what the outcome will be in a certain situation. Please give your
answer in the space provided. If you believe that the answer may
change each time the situation described occurs, please give us what
you believe the “typical” outcome will be.
You may use any part of this page to write out calculations, as long as
you put your final answer in the space provided.”
A) Percentages
The applicants for admission to a prestigious university have to pass
an evaluation that involves an in-person interview. Here is some
information about the results of last year’s
applicants. There was a 10% chance that an applicant was accepted.
All the applicants that were accepted had passed the in-person
interview. However, if the applicant was rejected, there was still a
20% chance that he or she passed the in-person interview.
Imagine we randomly select an individual from this
year’s applications— Janet. Janet is taking the
in-person interview. If she passes the in-person interview, what are
the chances Janet will actually be accepted to the university?
__________
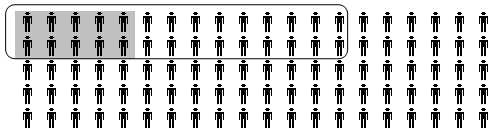
B) Percentages with Picture
[same initial paragraph as condition A]
The picture below summarizes the above information, and is provided for
you to use in the process of answering the following item. All the
chances for different outcomes are represented by the 100 figures
printed below (in 5 rows of 20). The area that has a darkened
background is the chances that an applicant is accepted. The area that
is inside the circle is the chances that an applicant passed the
in-person interview.
Imagine we randomly select an individual from this
year’s applications— Janet. Janet is taking the
in-person interview. If she passes the in-person interview, what are
the chances Janet will actually be accepted to the university?
__________
C) Natural Frequencies
The applicants for admission to a prestigious university have to pass
an evaluation that involves an in-person interview. Here is some
information about the results of last year’s
applicants. 10 out of every 100 applicants were accepted. All the
applicants that were accepted had passed the in-person interview.
However, 18 of the 90 rejected applicants also passed the in-person
interview.
Imagine we randomly select 100 individuals from this
year’s applications. All these applicants are taking
the in-person interview. Out of the applicants who pass the in-person
interview, how many will actually be accepted to the
university? ____ out of ____
D) Natural Frequencies + Picture
[same initial paragraph as condition C]
The picture below summarizes the above information, and is provided for
you to use in the process of answering the following item. The
applicants are represented by the 100 figures printed below (in 5 rows
of 20). Figures that have a darkened background are the number of
applicants that were accepted. Figures that are inside the circle are
the applicants that passed the in-person interview.
[same picture as Condition B]
Imagine we randomly select 100 individuals from this
year’s applications. All these applicants are taking
the in-person interview. Out of the applicants who pass the in-person
interview, how many will actually be accepted to the
university? ____ out of ____
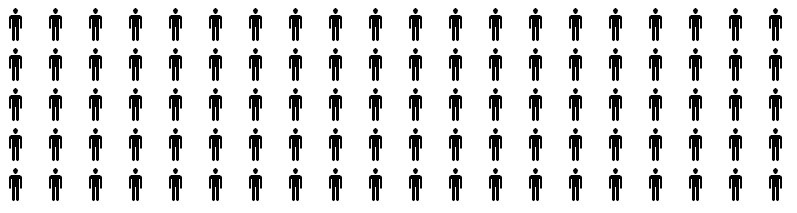
E) Natural Frequencies + Active Picture
[same initial paragraph as condition C]
The picture below is provided for you to use in the process of
answering the following item. The applicants are represented by the
100 figures printed below (in 5 rows of 20). Please create a picture
of the above information.
-
Draw circles around the number of applicants that were accepted;
- Then draw check marks (✓) across the number of applicants
that passed the in-person interview.
Imagine we randomly select 100 individuals from this
year’s applications. All these applicants will be
taking the in-person interview. Out of the applicants who pass the
in-person interview, how many will actually be accepted to the
university? ____ out of ____
This document was translated from LATEX by
HEVEA.