Judgment and Decision Making, vol. 4,
no. 5, August 2009, pp. 363-384
Bayesian analysis of deterministic and stochastic prisoner’s dilemma gamesHoward Kunreuther* , Gabriel Silvasi, Eric T. Bradlow, and Dylan Small
The Wharton School, University of Pennsylvania |
This paper compares the behavior of individuals playing a classic
two-person deterministic prisoner’s dilemma (PD) game
with choice data obtained from repeated interdependent security
prisoner’s dilemma games with varying probabilities of
loss and the ability to learn (or not learn) about the actions of
one’s counterpart, an area of recent interest in
experimental economics. This novel data set, from a series of
controlled laboratory experiments, is analyzed using Bayesian
hierarchical methods, the first application of such methods in this
research domain.
We find that individuals are much more likely to be cooperative when
payoffs are deterministic than when the outcomes are probabilistic. A
key factor explaining this difference is that subjects in a stochastic
PD game respond not just to what their counterparts did but also to
whether or not they suffered a loss. These findings are interpreted in
the context of behavioral theories of commitment, altruism and
reciprocity. The work provides a linkage between Bayesian statistics,
experimental economics, and consumer psychology.
Keywords: prisoner’s dilemma; uncertainty; bayesian analysis; controlled experiments.
1 Introduction
Interdependent security (IDS) games are social multi-player games with
stochastic payoffs where each player must decide whether or not to
mitigate her own risks. More specifically, each player knows that even
if she fully protects herself by investing in a risk-reducing measure,
she may still be subject to indirect losses by being
“contaminated” by one of the other
players who chose not to invest. As Heal and Kunreuther (2005) have
shown, there are a wide variety of significant current problems that
fit into an IDS framework ranging from investing in airline or port
security, protecting oneself against disease through vaccinations,
individual users incurring software security costs when connected to a
network, and divisions of firms undertaking risky investments that
could cause the entire firm to become insolvent or bankrupt (as in
the current financial crisis).
Kunreuther and Heal (2003) have shown that IDS games can have either
multiple Nash equilibria or just a single Nash equilibrium. In a Nash
equilibrium both players’ strategies are the best
response to each other’s strategies (Gibbons, 1992).
This paper presents the results and analysis of controlled laboratory
experiments involving two players in an IDS game where there is a
single Nash equilibrium. If both players invest in a risk-reducing
measure, there is no chance that either will suffer a loss. However,
if either or both players do not invest in the protective measure, then
there is some likelihood (hence the stochastic part) that both
individuals will suffer a loss. Furthermore the dominant strategy of
both players, if they are risk neutral (i.e., neither risk averse nor
risk seeking), is not to invest in the protective measure,
despite the fact that had they taken this step, their expected values
would have been higher than if they had not.
This IDS game can be viewed as a stochastic prisoner’s
dilemma (SPD) game, an area of increased interest in experimental
economics (e.g., Bereby-Meyer & Roth, 2006). In the standard
deterministic prisoner’s dilemma game, two prisoners
face the dilemma of testifying for the prosecution against each other
and admitting their own crime, or remaining silent; the Nash
equilibrium strategy is for each prisoner to testify against each other
even though both would be better off if they agreed to cooperate with
each other by remaining silent. In an IDS game, investing in a
risk-mitigating measure is analogous to cooperating in the classic
prisoner’s dilemma game.
In our experiment, subjects were assigned to play one of three types
of prisoner’s dilemma games: (i) a standard deterministic prisoner’s
game; (ii) a full feedback stochastic prisoner’s dilemma game based on
an IDS model where the players receive feedback about their
counterparts’ actions and payoffs (each round); and (iii) a partial
feedback stochastic prisoner’s dilemma game where the players
receive feedback only about their counterparts’ payoffs but not their
actions. Subjects were randomly paired to play ten prisoner’s dilemma
games of their assigned type against each other; this is called a
repeated prisoner’s dilemma game or a supergame.
In the deterministic prisoner’s dilemma game, there is
considerable evidence from controlled experiments that if players play
repeated prisoner’s dilemma games against each other,
i.e., a supergame, cooperation can emerge, even though they
would be likely to defect in a single period game (Axelrod, 1984).
Each subject in our experiment played multiple (3–10) supergames of the
same type (i.e., deterministic, stochastic full feedback or stochastic
partial feedback) with randomly chosen counterparts. More details on
our experimental design are provided in Section 3.
Our interest in this research area is both substantive and
methodological. From a substantive perspective, we would like to
compare the behavior of individuals in a standard deterministic
prisoner’s dilemma (DPD) multi-period supergame with their
behavior in an SPD supergame based on an IDS model. Our interest is
in determining whether stochastic payoffs weaken cooperation, and how
feedback affects cooperation. Specifically, we compare behavior in a
full feedback stochastic game (where each player learns about both her
counterpart’s actions and payoffs) with behavior in a partial feedback
game (where each player only learns about her counterpart’s payoffs).
In this partial feedback game, a player may or may not be able to
infer her counterpart’s action based on the payoffs received by both
players, and so the ability to “pin the loss” on the counterpart may
be obscured.
Behavior in a partial feedback game is of considerable interest today
where each decision maker knows only what has happened to her but is
unclear as to the cause. In such social dilemmas each individual
receives a higher payoff for making a socially defecting choice (e.g.
polluting the environment) than for pursuing a socially cooperative
choice no matter what the other individuals in society do.
Furthermore, all individuals are better off if they all cooperate than
if they all defect (Dawes, 1980).
From a methodological perspective, we utilize a Bayesian hierarchical
model to understand more fully the factors that influence individuals
to invest in socially beneficial protective measures over time, and
whether there are significant differences in behavior when payoffs are
deterministic versus stochastic. To the best of our knowledge this is
the first time that Bayesian hierarchical methods have been applied to
the analysis of repeated prisoner’s dilemma game experiments.
(Stockard, O’Brien & Peters, 2007, applied a hierarchical mixed
model to repeated prisoner’s dilemma games, similar to our approach,
but did not use Bayesian methods.) From a scientific perspective such
an analysis enables us to understand more fully how different
treatments in a controlled experimental design affect the distribution
of individual-level parameters, e.g., an individual’s likelihood of
retaliating against a counterpart.
There are several attractive features of utilizing Bayesian hierarchical
models for analyzing repeated prisoner’s dilemma game
experiments. They include the ability to perform exact small-sample inference where
sample sizes are likely to be small, to incorporate within-person
dependence with repeated-measures data, and
to understand drivers of heterogeneity by tying in covariates
of subjects and the context of their decisions to their
individual-level parameters. These are classic advantages of Bayesian
methods (Gelman, Carlin, Stern & Rubin, 2004) and ones that are
particularly salient and relevant to the analysis of repeated
prisoner’s dilemma game experiments.
To foreshadow the results of our detailed analysis, we summarize the
key findings of the paper as follows. In a two person prisoner’s
dilemma game, individuals are much more likely to be cooperative when
payoffs are deterministic (the DPD game) than in the SPD games where
the outcomes are stochastic. A key factor behind this difference is
that subjects in the SPD games respond not just to what their
counterparts did, but also to whether or not they suffered a loss.
When a person does not invest but his or her counterpart does, the
individual is less likely to reciprocate the counterpart’s investment
in the next period if he or she does not suffer a loss. In comparing
the two aforementioned SPD games, one with full feedback on the
counterpart’s behavior and the other with only partial feedback on the
counterpart’s behavior, the overall amount of cooperation (investment)
was similar. However, we found that the pattern of
cooperation was different in the two types of games. In particular,
when subjects in the partial feedback game could learn their
counterpart’s actions implicitly, they were less likely to
reciprocate their counterparts’ behavior than in analogous situations
in the full feedback game where subjects learned their counterparts’
behavior explicitly.
The remainder of the paper proceeds as follows. Section 2 provides a
brief summary of theoretical and empirical studies on prisoners’ and
social dilemmas with a focus on recent experiments in a noisy or
stochastic environment. In Section 3 we describe a general
formulation for an interdependent security (IDS) two-player game,
showing under what conditions it takes the form of a stochastic
prisoner’s dilemma game. After characterizing our experimental design
for a set of controlled laboratory experiments (Section 4), we then
specify a set of between-treatment hypotheses and test them using
regression analysis (Section 5). In Section 6, we build a Bayesian
hierarchical model that enables us to test hypotheses with respect to
within-subject behavior. Section 7 summarizes the findings, discusses
their prescriptive implications and suggests areas for future
research. The Appendix provides the details of our experiments, making
them reproducible by others interested in studying stochastic IDS
games.
2 Background on deterministic and stochastic
prisoner’s dilemma games
In this section we review the literature on repeated
prisoner’s dilemma games and explain the contribution
of our experiments to this literature.
2.1 Deterministic multi-period games and the emergence of cooperation
We first consider deterministic prisoner’s dilemma (DPD) games. In a
single period DPD game, defecting is the only Nash equilibrium and
experiments have shown that players learn to play this Nash
equilibrium in a series of games in which a player is matched with a
different player in each period (e.g., Cooper et al., 1996). But in
supergames, as we study here, in which a player is matched with the
same player for repeated periods, players learn to reciprocate
cooperative behavior as they gain experience (Selten & Stoecker,
1986; Andreoni & Miller, 1993; Hauk & Nagel, 2001).
Cooperation tends to break down near the end of the supergame,
however, due to so-called “end-game effects.” In a tournament
setting, Axelrod and Hamilton (1981) and Axelrod (1984) showed that
the tit-for-tat (TFT) strategy, where a player cooperates on the first
move and thereafter does whatever the other player did on the previous
move, generates a fair amount of cooperation. Kreps et al. (1982)
have addressed the theoretical issue of whether it can be rational for
players to cooperate in a finitely repeated game. Our research
provides further empirical tests of these theories.
2.2 Stochastic versus deterministic games
A recent paper by Bereby-Meyer and Roth (henceforth B&R) (2006) compared
cooperation in a multi-period DPD to cooperation in a multi-period
stochastic prisoner’s dilemma game in which the payoffs
were random, but the expected payoffs were that of the DPD and the
players learned the action that their counterparts took (i.e., there
was full feedback). B&R hypothesized that because the SPD provides
only partial reinforcement for cooperating when one’s
counterpart cooperates, players would learn to cooperate more slowly
(if at all) in the SPD compared to the DPD. B&R confirmed their
hypothesis and showed that players’ decisions in the
SPD at time t are affected by the lottery that determined
their random playoff at time t-1 in addition to their
counterpart’s action at time t-1. Our results
provide additional confirming evidence and insights into why players
cooperate less in an SPD game.
2.3 Partial feedback versus full feedback
In the usual DPD and B&R’s SPD games, players know what actions their
counterparts have taken in previous rounds. But in many real
situations, decision makers are uncertain about their counterparts’
actions. Motivated by this issue, Bendor, Kramer and Stout (1991)
conducted a multi-period prisoner’s dilemma game tournament modeled
after Axelrod (1984) but with random payoffs and where players only
learned about their own payoff. Players received no feedback
regarding either their counterpart’s action or payoff. Bendor et al.
found that the TFT strategy, which outperformed other strategies in
Axelrod’s DPD tournament, fared rather poorly in this SPD tournament
with partial feedback. Axelrod and Dion (1988) note that when there
is uncertainty in outcomes, then cooperation may avoid unnecessary
conflict but can invite exploitation. Axelrod (1984) and Donninger
(1986) also presented results of tournaments of SPDs with partial
feedback, finding that TFT could still perform well if there is only a
small amount of noise in the payoffs.
Bendor (1987, 1993), Molander (1985), and Mueller (1987) studied SPDs
with partial feedback from a theoretical perspective. Bendor (1993)
showed that, although uncertainty about one’s counterpart’s actions
hinders cooperation in some circumstances, there are other situations
in which the uncertainty can enhance cooperation by allowing
reciprocating but untrusting strategic players to begin cooperating
because of unintended consequences (i.e. a random
“cooperative-looking” event occurs). Our research provides further
insights in this direction.
| Table 1: Expected returns associated with investing and not
investing in protection. |
| | | Individual 2 (A2)
|
| | | I | NI |
21inIndividual 1 (A1) | I | Y−c, Y−c | Y−c−pqL, Y−pL |
| | NI | Y−pL, Y−c−pqL | Y−[pL+(1−p)pqL], Y−[pL+(1−p)pqL] |
2.4 The contributions of our experiments
Our experiments are the first that we know of to compare side-by-side
a DPD multi-period game, an SPD with full feedback (SPD-FF)
multi-period game and an SPD with partial feedback (SPD-PF)
multi-period game. The shared losses in our SPD game may affect
players’ psychological reaction to the outcome of the game and the
other player’s action. In our SPD game with partial feedback, players
learn only their counterpart’s loss and not their
counterpart’s action. For some combinations of a player’s
strategy and the losses of both players, it is possible to
infer what actions one’s counterpart took; for other combinations,
it is impossible. To our knowledge, our experiments are the first to
consider an SPD with partial feedback among live players.
Furthermore, for the SPD-FF and SPD-PF games, we vary the probability
of experiencing a loss so that we can decompose the direct effects of
the existence of stochasticity from the magnitude
(value of p) of the likelihood of the negative event.
Our first goal is to compare the overall levels of cooperation
(investment in protection) in the information conditions DPD, SPD-FF
and SPD-PF, which we study in Section 5. Our second goal is to
understand the source of any differences in cooperation between the
three information conditions in terms of how players respond to
different situations, which we study in Section 6. Because
individuals are endowed with a large sum of “money” at the beginning
of each supergame, and because the losses in each of the rounds are
relatively small (despite whether neither, one or both individuals
decide to cooperate), we assume that the subjects behave as if they
are risk neutral in determining what action to pursue in any
period t. In future research, as we discuss in the
concluding section, we will consider games in which there are small
probabilities of loss yet high losses when they occur; risk aversion
may play a more significant role in this context. The next three
sections respectively characterize the nature of IDS games, our
experimental design and hypotheses.
3 IDS games
To motivate our experiments in the context of interdependent
security models we focus on two identical individuals,
A1 and A2, each maximizing her own
expected value in a one-period model and having to choose whether to
invest in a protective measure. Such an investment by individual
i costs c and reduces the probability of experiencing
a direct loss to 0. Let p be the probability of a
direct loss to an individual who does not invest in protection. If one
individual experiences a direct loss, there is some probability
q≤ p that the second individual will
also experience an indirect loss from the first individual even if the
second individual has invested in protection. That is, q is
defined to be the unconditional probability of an indirect
loss to the second individual when the first does not invest in
protection. For example, an apartment owner who has invested in a
sprinkler system to prevent fire damage may still suffer a loss
indirectly from a neighboring unit that does not invest in this form of
protection and experiences a fire. The direct or indirect loss to each
player is L.
Let Y be the assets of each individual before she incurs any
expenditures for protection or suffers any losses during the period.
Assume that each individual has two choices: invest in protection,
I, or do not invest, NI, and makes her
decision so as to maximize expected value. The four possible expected
outcomes from these decisions are depicted in Table 1.
To illustrate the nature of the expected returns consider the upper
left hand box where both individuals invest in security (I, I). Then
each individual incurs a cost of c and faces no possible
losses so that each of their net returns is Y-c. If
A1 invests and A2
does not, then this outcome is captured in the upper right hand box
(I, NI). Here A1 incurs an
investment cost of c but there is still a chance p
that a loss will occur to A2
so that A1’s expected loss from
damage from a negative externality is pqL. The lower left
box (NI, I) has payoffs which are just the mirror image of these.
Suppose that neither individual invests in protection (NI, NI)
— the lower right hand box in Table 1. Then each has an
expected return of Y- pL -(1-p)pqL. The expected losses can
be characterized in the following manner. The term pL
reflects the expected cost of a direct loss. The second term reflects
the expected cost from an indirect loss originating from the other
individual (pqL) and is multiplied by (1-p) to
reflect the assumption that a loss can only occur once. In other
words, the risk of contamination only matters to an individual when
that individual does not experience a direct loss
(“you can only die once”).
Assuming each individual wants to maximize her expected returns, the
conditions for her to invest in protection are that
c<pL and c<p(1-pq)L. The first
constraint is exactly what one would expect if the individual could not
be contaminated by the other person. Adding a second individual
tightens the constraint by reflecting the possibility of contamination
should this person decide not to invest in protection. The
resulting Nash equilibrium (NE) for this IDS model can be determined as
follows:
-
If c<p(1-q)L then (I, I) is a NE
- If c>pL then (NI, NI) is an NE
- If p(1-pq)L <c< pL then both
(I, I) and (NI, NI) are NE
An IDS game becomes an SPD game when pL + (1-p)pqL>
c >pL so that (NI, NI) is a dominant solution
but both individuals would be better off if they had decided to invest
in protection (I, I). For the experiments described below, we
set q = 1 so that, if one individual suffers a loss, the other
individual is certain to also experience this same loss. We also
choose values of p and L so that the IDS game takes
the form of an SPD game with only one stable equilibrium.
4 Experimental design
The experiments were carried out in the behavioral laboratory of a
large, northeastern university using a web-based computer program. The
pool of subjects recruited for the experiment consisted primarily of
undergraduate students, though a small percentage of the 520 subjects
were graduate students and students from other area
colleges.1
The studies were run with three different experimental conditions
(DPD, SPD-FF, SPD-PF). Between three and seven pairs of subjects
participated in specific sessions. A session consisted of a set of
supergames, each consisting of 10 periods. The computer program
randomly paired the subjects before the start of each supergame.
A person played a 10-period supergame with his/her anonymous partner;
and at the conclusion of the supergame the person was then told that
she would be randomly paired again before the start of the next
supergame. The number of supergames in each session ranged from three
to ten depending on how long the session ran and how rapidly the pairs
of players were able to complete each supergame. More than half the
participants participated in exactly eight supergames in their given
session.
Each subject was given an initial surplus of 300 “talers” (described
below) at the beginning of every supergame. Before the experiment
began, every subject was told that each supergame consisted of 10
periods. The number of supergames was not announced at the beginning
of the experiment nor was the final supergame announced when it began.
Subjects were also told that, at the end of the entire session, one
supergame and one pair playing that supergame would be chosen at
random, and each individual from the selected pair would receive the
dollar equivalent of his/her final payoff from that 10 period game.
The lucky pair received these payments in addition to the fixed fee of
$8-$12 (depending on the length of the session) that each person
received for participating in the experiment.
The initial surplus and payoffs presented to the subjects during the
experiment were in an artificial currency called “talers,” and these
were converted to dollars (10 talers = $1) at the end of the
experiment for the randomly selected lucky pair. The average earnings
per person from the game, for the pairs chosen at random to receive
their final payoff, was $25.55. Screen shots of the instruction
pages for all conditions, as well as decision and payoff screens, are
presented in the Appendix. We next describe each of
these experimental treatment conditions in detail.
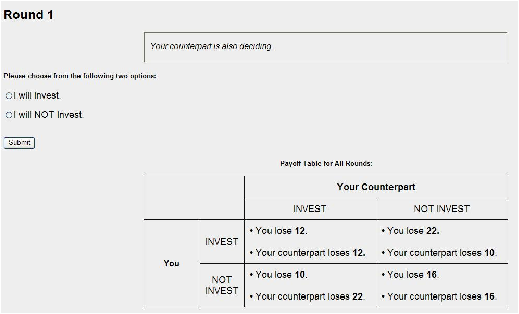
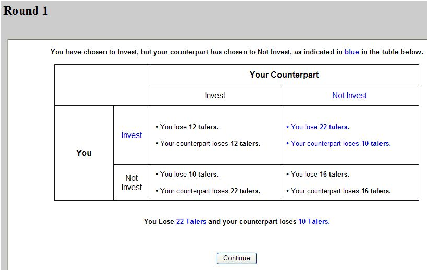
Information Condition 1: Deterministic Prisoner’s Dilemma
(DPD) Game.
Subjects in the DPD condition were presented the payoff matrix depicted
in the online appendix (Figure B1). In this condition, the cost of
investing in protection is c=12 talers. A loss of L=10 talers
(in addition to any investment costs) occurs for both players if
exactly one player does not invest. A loss of L=16 talers
occurs for both players if both players do not invest. Both
individuals would be better off if they had each invested rather than
not invested; however (NI, NI) is the Nash equilibrium.
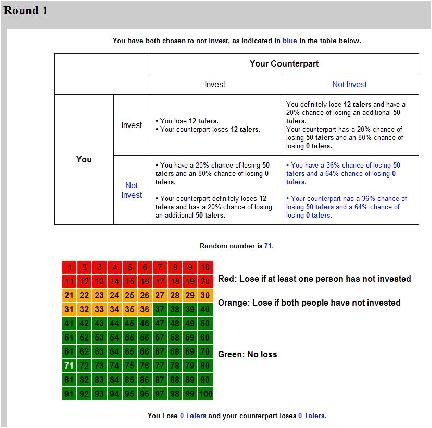
Information Condition 2: Stochastic
Prisoner’s Dilemma Game with Full Feedback on
Counterpart’s Decision (SPD-FF).
The stochastic conditions replicated the effect of p (the
probability of a random negative event each period as described in
Table 1) by means of a random number. In order to understand the
impact of the probability and magnitude of a loss on behavior in the
SPD game, we ran sessions where p=.2, p=.4 and p=.6.
The cost of investing in protection remained at c=12 (as in
condition 1 above) for each of these cases; however the
respective losses were set at L=50, 25 and 19 so that the
expected payoff matrices were essentially equivalent across the three
experimental conditions.2 This was done so that we could isolate the impact of the
change in loss probability on one’s decision to invest and not have it
be confounded by the magnitude of the expected loss.
The exact payoff matrix presented to subjects in the SPD-FF condition,
sub-treatment p=0.2, is depicted in the online appendix
(Figure B5); the payoff matrix for sub-treatment p=0.4 is
depicted in (Figure B8); and the payoff matrix for sub-treatment
p=0.6 is depicted in (Figure B9).
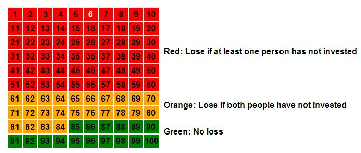
| Table 2: Scenarios related to Decisions in Period t and whether
or not it is possible to infer the decision of one’s
counterpart in the Stochastic Partial-Feedback Condition. |
Scenario | Player 1 decision | Player 2 decision | Color | Loss or No
loss? | Player 1 can infer decision of Player 2? |
1 | I | I | Red | No loss | Yes |
2 | I | I | Orange | No loss | No |
3 | I | I | Green | No loss | No |
4 | I | NI | Red | Loss | Yes |
5 | I | NI | Orange | No loss | No |
6 | I | NI | Green | No loss | No |
7 | NI | I | Red | Loss | No |
8 | NI | I | Orange | No loss | Yes |
9 | NI | I | Green | No loss | No |
10 | NI | NI | Red | Loss | No |
11 | NI | NI | Orange | Loss | Yes |
12 | NI | NI | Green | No loss | No |
At the end of each period t, each player was told whether
his/her counterpart had chosen I or NI (hence full
feedback). If either (or both) players had chosen NI, then
the computer would draw a random number from 1 to 100 and highlight
this number on a table on each subject’s screen indicating whether or
not a loss had occurred.3 Each player was then
shown her cumulative balance in talers and her counterpart’s
cumulative balance for period t and all previous periods in
the supergame (see the example in the online appendix).
Information Condition 3: Stochastic Prisoner’s Dilemma Game
with Partial Feedback on Counterpart’s Decision (SPD-PF).
This game is identical to the SPD-FF game except that after each period
t the random number generates an outcome even if both players
invested in protection (i.e. (I,I)). Each player is
then told whether or not she suffered a loss but not what action her
counterpart had taken. Each player is reported only her own cumulative
balance in talers for period t and all the previous periods.
For some outcomes in period t it is possible for a
player to infer what action her counterpart had taken that period. For
example, if Player 1 invests in protection (I) but still
suffers a loss, then she can deduce that Player 2 must not have
invested (NI). In other cases it is impossible for the other
player to infer what her counterpart has done. For example, if a green
(no-loss) random number is drawn, then there is no loss whether or not
either player invested in protection. Table 2 summarizes the twelve
combinations of investment-color configurations that could arise each
period, and whether Player 1 can infer whether or not her counterpart
has invested in that period (a symmetric table exists for Player 2).
4.1 General overview of the data collected for all conditions
| Table 3: Number of individuals in each experimental condition. |
Condition | Number of Supergames | Number of Individuals |
DPD | 84 | 104 |
SPD-FF (all) | 140 | 210 |
p=0.2 | 40 | 54 |
p=0.4 | 40 | 76 |
p=0.6 | 60 | 80 |
SPD-PF (all) | 140 | 206 |
p=0.2 | 40 | 52 |
p=0.4 | 50 | 96 |
p=0.6 | 50 | 58 |
TOTAL | 324 | 520 |
Table 3 indicates the number of individuals who participated in
experiments in each of the three treatment conditions and as a function
of p for the SPD experiments
Each individual played several supergames in the same treatment
condition. (e.g. SPD-FF, p=.4). Thus for each subject there exists a
vector of person-level covariate data about that subject (age, gender,
race, etc.), plus a vector of treatment-level covariate data for the
subject (deterministic condition vs. stochastic full-feedback vs.
stochastic partial-feedback, and p=0.2 vs. p=0.4 vs. p=0.6), plus a
series of 10-period supergame vectors, each of which contain the data
about (a) the decision the subject made in each period (I or
NI), (b) the decision her counterpart made in each period
(I or NI), (c) the color that appeared on the
random-number grid for that round (red, orange, or green), and (d) the
number of points (talers) deducted from the subject’s account each
period. In addition to these four decision-level pieces of information
collected during the experiment, we also added a binary variable
indicating whether or not the subject was able to infer the
decision of her counterpart; this “infer” indicator can be
calculated based on Table 2.
5 Analyses of between-treatment hypotheses
We first postulate between treatment hypotheses that can be tested with
marginal analyses and simple regressions. These include (a) how levels
of investment differ between the DPD, SPD-FF and SPD-PF conditions and
(b) how levels of investment differ as the probability of a negative
random event (p) increases from 0.2 to 0.4 to 0.6.
5.1 Specific between-treatment hypotheses
H1: The probability of investment will be greater in
the DPD game than in either of the SPD games.
Bereby-Meyer and Roth (2006), (B&R) found evidence that there was less
cooperation in an SPD-FF game than in a DPD game. They ascribe this
finding to the fact that stochastic games provide only partial
reinforcement for cooperation. We expect to find similar
results.
H2: The probability of investment will be greater in
the SPD-FF game than in the SPD-PF game.
We hypothesize that the lack of complete information in the SPD-PF game
and hence the inability to infer what one’s counterpart
has done in many scenarios (see Table 2) will limit the emergence of
stable cooperation between the two players.
H3: For either SPD-FF or SPD-PF, the probability of
investment will be greater in the p=0.4 treatment than in the p=0.2
treatment, and will be greater in the p=0.6 treatment than in the p=0.4
treatment.
As p increases, the likelihood that a non-investing subject
will experience a loss increases. There is considerable evidence from
other studies that experiencing a loss increases the incentive to
invest in protection. Kunreuther (2006) has shown that homeowners are
likely to purchase earthquake or flood insurance after a recent
disaster even when they indicate that the probability has not increased
(flood) or may even be lower in the immediate future (earthquake).
Because subjects who do not invest in the previous period are more
likely to experience a loss as p increases, this would lead
them to invest in the next period, other things being equal.
| Table 4: Percentage of individuals investing in protection in
the three conditions. |
Condition (Loss) | Total Decisions | Total I Decisions | I/Total |
DPD (L=10) | 8800 | 5039 | 0.57 |
SPD-FF (all) | 14800 | 4626 | 0.31 |
P=0.2 (L=50) | 4320 | 1094 | 0.25 |
P=0.4 (L=25) | 4440 | 1211 | 0.27 |
P=0.6 (L=19) | 6040 | 2321 | 0.38 |
SPD-PF (all) | 13600 | 4753 | 0.35 |
P=0.2 (L=50) | 4140 | 1092 | 0.26 |
P=0.4 (L=25) | 5400 | 1809 | 0.34 |
P=0.6 (L=19) | 4060 | 1852 | 0.46 |
All P=0.2 (L=50) | 8460 | 2186 | 0.26 |
All P=0.4 (L=25) | 9840 | 3020 | 0.31 |
All P=0.6 (L=19) | 10100 | 4173 | 0.41 |
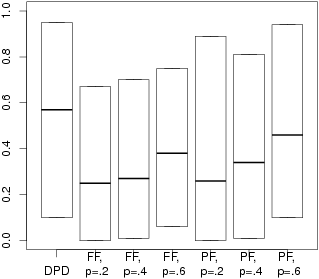
| Figure 1: Mean, .05 and .95 quantiles of investment in different
conditions. The ends of the boxes show the .05 and .95 quantiles
of the distribution of subject investment proportions in a
condition, where the investment proportion for a given subject is
computed using all supergames the subject played. The dark line
in the middle of the box shows the mean investment across subjects
in the condition. |
5.2 Marginal analyses
Before formally testing the between-treatment hypotheses, we first
explore the data at its marginal level. Table 4 describes the
proportion of times individuals invested in protection (cooperated) in
the different conditions of our experiment. Figure 1 displays these
mean investment levels along with the .05 and .95 quantiles of the
distribution of subject investment levels in a condition, where the
subject investment level for a given subject is the proportion of times
the subject invested across the subject’s supergames.
The investment proportions were highest in the DPD game, with roughly
similar investment proportions in SPD-FF and SPD-PF games.
Nonparametric Wilcoxon tests for differences in the investment
proportions among subjects in the different conditions show that there
is strong evidence for a difference between the DPD and SPD-FF
conditions (p < 0.0001) and between the DPD and SPD-PF
conditions (p < 0.0001), but there is not strong evidence
for a difference between the SPD-FF and SPD-PF conditions (p-value =
0.23). The analysis described in Section 6 will demonstrate that,
although there is not a large difference in overall
investment between individuals in the SPD-FF and SPD-PF conditions,
there are systematic differences in investment behavior between
subjects in these two conditions when the ability (or not) to infer
what one’s counterpart has done in the previous round is taken into
account. A Bayesian statistical model applied to these data will help
uncover these patterns, controlling for individual differences.
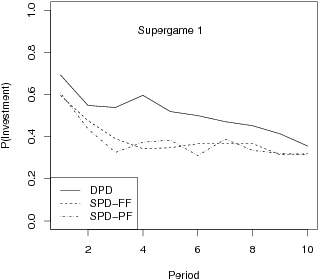
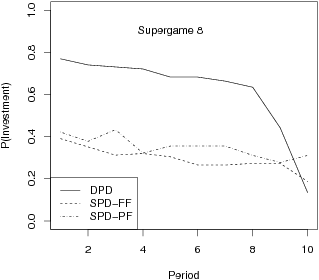
| Figure 2: Estimated probability of investment in supergame 1 (top) and 8 (bottom). |
In the SPD conditions, the investment proportion increases with the
probability of loss. There is a substantial amount of heterogeneity of
investment among different individuals within a given condition; for
example for DPD, the 5%-quantile of investment proportion is 0.10 and
the 95%-quantile of investment proportion is .95. Although there is
substantial heterogeneity among individuals within a condition, there
are clear patterns of different mean investment levels across
conditions.
| Table 5: Confidence intervals for contrasts in proportion of
investment between. |
Contrast | Estimated difference | 95% CI | |
(SPD-FF, p=.2) — DPD | −0.34 | (−0.41,-0.27) | R1 |
(SPD-PF, p=.2) — DPD | −0.30 | (−0.37,-0.23) | R2 |
(SPD-FF, p=.4) — DPD | −0.29 | (−0.40,-0.18) | R3 |
(SPD-PF, p=.4) — DPD | −0.25 | (−0.36,-0.14) | R4 |
(SPD-FF, p=.6) — DPD | −0.18 | (−0.29,-0.07) | R5 |
(SPD-PF, p=.6) — DPD | −0.13 | (−0.02,-0.25) | R6 |
(SPD-FF,p=p*) — (SPD-PF,p=p*) for p*=(.2,.4,.6) | −0.04 | (−0.09,0.00) | R7 |
p=.6 — p=.2 for fixed SPD game | 0.16 | (0.10,0.22) | R8 |
p=.6 — p=.4 for fixed SPD game | 0.12 | (0.06,0.17) | R9 |
p=.4 — p=.2 for fixed SPD game | 0.05 | (−0.01,0.10) | R10 |
We now explore how the probabilities of investment change as the period
increases from 1 to 10. We show these probabilities in Figure 2 for the
first and last supergames, 1 and 8.
For the DPD in supergame 1, investment generally declines gradually as
the periods increase. For the DPD in supergame 8, investment declines
gradually from periods 1 to 8 and then declines sharply in periods 9
and 10. This behavior of declining investment as a function of period
mirrors the findings of Selten and Stoecker (1986), Andreoni and Miller
(1993), Hauk and Nagel (2001) and B&R (2006). For the SPDs in
supergame 1, investment declines from period 1 to 3 and then stays
relatively flat. For the SPDs in supergame 8, investment generally
declines gradually. This is similar to B&R’s finding
that in an SPD, investment declines gradually as the period increases.
In other words there is less of a drop in investment from period 1 to
period 10 for the SPD than the DPD game.
5.3 Regression analyses
To more formally test the between treatment hypotheses H1-H4, we fit a
regression of the proportion of times each subject invested as a
function of the subject’s information condition (DPD, SPD-FF or
SPD-PF), the subject’s probability of loss condition if in one of the
stochastic information conditions SPD-FF or SPD-PF ((p=.2)*stochastic,
(p=.4)*stochastic and (p=.6)*stochastic, where stochastic = 1 if in a
stochastic condition and 0 otherwise) and interactions between the
information condition and the probability of loss
condition.4 The interaction terms in
the regression were not significant (p-value for F-test =
0.63) and hence were dropped from the regression. Table 5 shows
confidence intervals for a variety of interesting contrasts in the
proportion of investment between conditions.
The data in Table 5, R1-R6 provide strong evidence for H1. There was a
higher mean investment proportion in the deterministic information
condition than in either of the two stochastic information conditions
for each of the three probability of loss levels. In some cases there
is substantially more investment in the DPD condition than in the SPD
cases. For example, the estimated difference is 0.29 between the DPD
and (SPD-FF, p=.4) (R3), and 0.25 between the DPD and (SPD-PF,
p=.4), (R4).
The data do not support H2, as there was slightly less
investment in the full feedback SPD than the partial feedback SPD. The
estimated difference is 0.04 [95% confidence interval: (0.00, 0.09)]
and the sign of the difference between full feedback and partial
feedback SPD is the opposite of what we hypothesized in H2, albeit the
effect is quite small.
We now consider hypothesis H3, that subjects’ mean investment level
increases as the probability of loss increases. Comparing the
probability of loss conditions among subjects playing a given SPD
game, there was substantially more investment when the probability of
loss was .6 than when it was .4 or .2; the estimated difference in
mean investment proportion is 0.16 for p=.6 compared to
p=.2 (R8) and 0.12 for p=.6 compared to
p=.4 (R9), and both differences are statistically significant
(p<0.05). There was slightly more investment for
p=.4 compared to p=.2 — the estimated difference
is .05, but the difference is not statistically significant. Thus,
there is evidence for part of H3 that the subjects’ mean investment
level increases as the probability of loss increases from
p=.2 or p=.4 to p=.6, but there is no
strong evidence that the mean investment level increases as p
increases from .2 to .4.
6 Bayesian analyses of within-treatment hypotheses
In order to gain further insight into the reasons for the differences
in investment across the treatment conditions, we formulated a set of
within treatment hypotheses that could be tested using Bayesian
analyses.
6.1 Specific hypotheses
H4: There will be substantial variability between
subjects in their tendency to invest, holding other factors fixed.
This hypothesis characterizes how subjects within the same experimental
treatment differ among each other in their aggregate investment
levels, holding other factors fixed. It is supported by the findings of
Andreoni and Miller (1993) who showed that some individuals were
naturally cooperative even if they knew their counterpart was
non-cooperative while others were non-cooperative even if they were
aware their counterpart was cooperative.
The next set of hypotheses examine within-subject comparisons on how
individuals change their investment decision in period t as a
function of their decision to invest or not invest in period
t-1, their counterpart’s decision to invest or
not invest in period t-1 (when this can be learned) and the
interaction between investment decisions in period t-1 and
whether or not an individual experienced a loss in period t-1.
H5: Subjects will tend to maintain the same investment
behavior over time, holding their counterparts’ decisions fixed.
There is a large body of empirical and experimental evidence suggesting
that individuals maintain the status quo even though they may be able
to improve their expected profits by modifying their behavior
(Samuelson & Zeckhauser, 1988; Kahneman, Knetsch & Thaler 1991).
H6: A subject will be more likely to invest in period t if she
learns that her counterpart invested in period t-1.
In spite of people’s tendency to persist in their
actions (as stated in H5), there is evidence that people can learn to
cooperate in repeated prisoner’s dilemma games
(Axelrod, 1984). A theoretical model as to how cooperation can emerge
in repeated prisoner’s dilemma games was presented by
Kreps et al. (1982). Such cooperation is expected to emerge here.
H7: If a subject experienced a loss in period t-1, she will be
more likely to invest period t than if she had not experienced a loss
in period t-1, holding all other conditions fixed.
We can further divide H7 into four (interaction) sub-hypotheses.
H7A: In the SPD-FF, when a subject invested and her counterpart
did not invest in period t-1.
H7B: In the SPD-FF, when a subject did not invest and her
counterpart invested in period t-1.
H7C: In the SPD-FF, when a subject did not invest and her
counterpart also did not invest in period t-1.
H7D: In the SPD-PF, when a subject did not invest in period
t-1 and could not infer her counterpart’s investment decision.
The reasoning behind hypothesis H7 was discussed in the context of H3.
There is considerable evidence from other studies that experiencing a
loss increases the incentive to invest in protection. Note that the
situation described in H7D is the only situation in the SPD-PF when a
subject’s response to a loss holding all other
conditions fixed can be studied (see Table 2). Specifically, Scenarios
7 and 10 in Table 2 are the two cases where a subject has not invested
in the previous period, experiences a loss, and cannot infer what her
counterpart has done. These two scenarios can be compared with
Scenarios 9 and 12 where the individual has not invested, has not
suffered a loss, and has no idea what her counterpart has done.
H8: A subject who experienced a loss and did not invest in
period t-1 is more likely to invest in period t if she knows that her
counterpart invested in period t-1.
We hypothesize that a subject experiencing a loss in period t-1
is likely to feel more regret if she knows she is fully responsible
for the loss because she did not invest and her counterpart did. Note
that H8 can be tested only in the SPD-FF.
6.2 A Bayesian hierarchical model for individual
investment decisions
To examine these hypotheses we build a Bayesian hierarchical model for
how subjects make investment decisions as a function of their previous
experience and the treatment condition they are in. We recognize that
a more general modeling framework would look at the entire path of
investment decisions an individual participant made within a supergame.
There is some empirical basis for focusing on just the previous
round’s decision. In examining experiments on coordination games,
Crawford (1995) and Crawford and Broseta (1998) found that, in making
a decision in period t, there was a much higher weight placed on
the decision in period t than in periods t−j; j≥ 2.
Bostian, Holt and Smith (2007) obtained a similar result for
laboratory experiments on the newsvendor problem. It is important to
note that our Bayesian modeling framework is completely general and
could easily incorporate decisions over a more complex set of past
variables.
The following notation characterizes a model of individual (investment)
choice:
Let i=1,… ,I index subjects participating in the experiment
(I=936);
t=1,… ,T index periods in a supergame (T=10);
r=1,…, R index the round of the supergame played in one
participant session (e.g., r=1,… ,8) with differing
opponents;
g = the information condition associated with the game [1 =
deterministic prisoner’s dilemma (DPD), 2 = stochastic prisoner’s
dilemma with full feedback (SPD-FF), 3 = stochastic prisoner’s
dilemma with partial feedback (SPD-PF)]; and
z=1,… ,Z index the probability of loss level (z=1,
p=0.2); (z=2, p=0.4); (z=3, p=0.6).
The outcomes of the experiments are characterized as follows:
Yitrgz = 1 if participant i in period
t of supergame r in information condition g
and in probability of loss level z chooses to invest in
protection; 0 otherwise.
Litrgz = 1 if participant i in period
t of supergame r in information condition g
and in probability of loss level z experiences a stochastic
loss; 0 otherwise.
Mitrgz = 1 if participant i in period
t of supergame r in information condition g
and in probability of loss level z could have
learned his or her counterpart’s choice and 0
otherwise.
Yitrgzc= 1 if the counterpart
c of participant i in period t of supergame
r in information condition g and in probability of
loss level z chooses to invest and 0 otherwise.
6.3 Analyzing the prisoner’s dilemma
games using the Bayesian model
| Table 6: Explanation of model. |
Term | Explanation | Random/Fixed |
| logit(Pitrgz) = |
βi1+ | Participant-level propensity | Random |
δt+ | Varying propensity by period | Fixed |
κtg+ | Interactions between period and information condition | Fixed |
γr+ | Varying propensity by supergame | Fixed |
κrg+ | Interactions between supergame and information condition | Fixed |
βi2 ∗ Yit−1,rgz + | Effect of subject’s own decision in
previous period | Random |
βi3 ∗ Mi,t−1,rgz∗ Yi,t−1,rgzc+ | Effect of
counterpart investing in previous period when subject is able to
learn this | Random |
βi4∗ Mi,t−1,rgz∗ Yi,t−1,rgz ∗
Yi,t−1,rgzc+ | Interaction between subject’s decision and
counterpart’s decision
when subject is able to learn counterpart’s decision | Random |
βi5∗ Li,t−1,rgz∗
(1−Yi,t−1,rgz)+ | Effect of
experiencing a loss when subject did not invest in previous round | Random |
βi6∗ Li,t−1,rgz∗ Yi,t−1,rgz+ | Effect of
experiencing a loss when subject did not invest in previous round | Random |
βi7∗ Li,t−1,rgz∗
(1−Yi,t−1,rgz)∗
Yi,t−1,rgzc∗ Mi,t−1,rgz | Interaction between
experiencing a loss, subject’s investment decision and counterpart’s
investment decision for when subject is able to learn counterpart’s
decision | Random |
ψ∗βi1∗ Period dummy | Additional effect of
participant level propensity in period 1 to account for there being
no Yi,t−1,rgz in period 1 | Fixed |
We model the probability of investing in protection in period t
as a function of a set of independent variables that includes: (i)
one’s loss experience in period t-1,
(ii) one’s own behavior in period t-1,
(iii) whether one can learn whether one’s counterpart
has invested in period t-1, (iv) the decision made by
one’s counterpart c in period t-1
if it can be learned, all varying by the different information
conditions g, supergames r, and probability of loss
conditions z. More formally we are interested in estimating
the parameters of the following general model:
|
| | Probability(Yitrgz=1) =
| |
| | | f(Lit−1rgz,Mit−1rgz,Yit−1rgz,Yit−1rgzc)
| (1) |
|
We can examine the relative importance of the variables specified in
(1) using the data from our experiments and “running that data”
through the lens of a Bayesian hierarchical model. The coefficients
associated with each of the variables are modeled as differing from
subject-to-subject (reflecting heterogeneity, e.g., some subjects are
more or less influenced by their counterpart’s choices), and are
assumed to be drawn from a multivariate normal distribution with
general covariance matrix. By allowing for a covariance matrix among
the individual-level parameters5, we can
further assess, whether an individual who is influenced more by his or
her counterpart’s non-investment decision is also more likely to
invest following a loss.
We also model the expected value of a subject’s coefficients as a
function of both person-level covariates such as age, gender,
race, and undergraduate major and treatment-level covariates
such as the probability of a loss, z, and whether the subject
is playing a DPD, SPD-FF or SPD-PF game, g. In this manner,
we can answer the question of “why” certain individuals respond in
the way they do (based on individual-level characteristics) and maybe,
more importantly, as a function of the treatments (probability and
information condition, and their interaction) that are imposed upon
them.
Before laying out the model, we note that an advantage of building a
Bayesian hierarchical model for our data is that we can control for
confounding variables in assessing the importance of certain factors
on investment decisions. As an example, a marginal analysis might
show that subjects are more likely to invest after having invested in
the previous round. However, suppose that investment propensity
declines as the period in the game increases. Then, the effect of
period is confounded with the effect of previous investment decisions.
Our Bayesian hierarchical model enables us to assess the effect of
previous investment decisions, holding the period fixed.
In particular, we model the log odds of the probability of a
participant investing (i.e., logit(Pitrgz) = ln(Pitrgz/(1 −
Pitrgz))) as a function of fixed and random effects as shown in
Table 6. The random effects
(βi1,βi2,βi3,βi4,βi5,βi6,βi7)
are modeled as coming from a multivariate normal distribution with a
mean that depends linearly on the following observed covariates:
(1) person-level covariates: age, gender, race, dummy variable
for undergraduate, dummy variable for business major and interaction
between business major and undergraduate,
(2) treatment-level covariates: information condition (dummy
variables for deterministic condition and stochastic partial feedback
condition), probability of a loss level (dummy variables for
p=0.2 and p=0.6) and interactions between the
information condition and the probability of a loss level (dummy
variables for the combinations of deterministic condition and
p=.2, deterministic condition and p=.6, stochastic
partial feedback condition and p=.2 and stochastic partial
feedback condition and p=.6).
In other words,
E(βij|i,g,z) = |
| | | π0j+π1jagei+π2jgenderi + π3jracei+ |
| | | π4jI(i is undergraduate)+ |
| | | π5jI(i is business major)+ |
| | | π6jI(i is undergraduate and business major)+ |
| | | π7jI(g=Deterministic(Det))+ |
| | | π8jI(g=Stochastic Partial Feedback (SPF))+ |
| | | π9jI(z=0.2)+π10,jI(z=0.6)+ |
| | | π11,jI(g=Det,z=0.2)+ |
|
| | | π12,jI(g=SPF, z=0.2)+ |
| | | π13,jI(g=Det, z=0.6)+ |
| | | π14,jI(g=SPF, z=0.6) |
|
where I(x) = 1 if condition x is true, 0 otherwise. We note, as
previously mentioned, the “scientific importance” of equation (2)
as it allows us to answer ‘whys’, i.e. what is the impact of the
treatment on people’s investment propensities?
We put the following relatively non-informative prior distributions
on the parameters. For the period and supergame round effects, we
used independent standard normal priors. For the covariance matrix
of
(βi1,βi2,βi3,βi4,βi5,βi6,βi7),
we used an inverse-Wishart prior with 7 degrees of freedom and scale
matrix 10∗ I7, where I7 denotes the 7x7 identity matrix.
For the coefficients on the covariates that affect the mean of
(βi1,βi2,βi3,βi4,βi5,βi6,βi7),
we used independent standard normals.
We used the WinBUGS software (http://www.mrc-bsu.cam.ac.uk/bugs/) to
obtain draws from the posterior distribution using Markov chain Monte
Carlo (MCMC). We ran three chains of 25,000 draws each, taking the
first 20,000 draws of each chain as burn-in and the last 5,000 draws of
each chain as draws from the posterior distribution. We assessed
convergence of the MCMC chains using Gelman-Rubin’s
(1992) potential scale reduction statistic. The code and further
computational details are available from the authors upon request.
6.4 Experimental findings
We now use the Bayesian hierarchical model to test H4 through H8. For
each of the hypotheses, we indicate the coefficient in the logit model
that is used to test whether or not the experimental data provide
support for it, holding all the other factors fixed. It is through the
direct mapping of parameters to hypotheses that inference under the
Bayesian model is made straightforward.
6.4.1 Testing H4
There is strong support that some individuals are much more likely
(i.e., over 5 times) to invest than others, holding other factors
fixed. In our model, the parameter βi1 measures subject
i’s propensity to invest. H4 says that there is substantial
variability in βi1. The posterior mean of the standard
deviation of βi1 is 0.79 with a 95% credibility interval of
(0.67, 0.92). This means that if we consider two subjects, subject 1
with βi1 one standard deviation above the mean and subject 2
with βi1 one standard deviation below the mean, then when all
previous investments, losses and learning are held fixed, the odds
ratio for subject 1 to invest compared to subject 2 to invest is
estimated to be exp(2*0.79)=4.85, a large effect.
| Table 7: Median (across respondent) posterior odds of
investing given ones counterpart invested in the previous period. |
Information Condition | Posterior Median of βi3 | 95% Credibility Interval for βi3 |
DPD | 1.37 | (0.99, 1.82) |
SPD-FF | 0.87 | (0.58, 1.12) |
SPD-PF | 0.03 | (−0.45, 0.43) |
6.4.2 Testing H5
There is strong evidence that there is persistence in investment
behavior. The parameter βi2 measures persistence since it
reflects the effect on investment in period t of having
invested in period t-1, holding other factors fixed. We have
thus hypothesized that the mean of βi2 is positive. The
posterior median (across subjects) for the mean of βi2 across
the information conditions is 2.05 with a 95% credibility interval of
(1.83, 2.25). This means that, for the average subject, the odds ratio
for the subject to invest if he or she invested in the previous round
compared to if he or she did not invest, holding all other factors
fixed, is estimated to be exp(2.05)=7.78 with a 95% credibility
interval of (exp(1.83), exp(2.25))=(6.23,9.49).
6.4.3 Testing H6
The parameter βi3 reflects how an individual’s likelihood
of investing in period t is impacted by learning that her
counterpart invested in period t-1, holding other factors
fixed. H6 says that the mean of βi3 is positive. Table 7
shows the posterior median for the mean of βi3 (across
subjects) in the three information conditions.
There is strong evidence that for the DPD and the SPD-FF, the average
subject is more likely to invest if his or her counterpart invested in
the previous round than if his or her counterpart did not. For the
DPD, the median of the odds ratios among different subjects for the
subject to invest if his or her counterpart invested in the previous
period compared to if his or her counterpart did not is estimated to be
exp(1.37)=3.94; for the SPD-FF, the median odds ratio is estimated to
be somewhat smaller, exp(0.87)=2.39, but still significant. For the
SPD-PF, there is not strong evidence that a subject is more likely to
invest if his or her counterpart invested in the previous round than if
his or her counterpart did not; the median odds ratio is estimated to
be only exp(0.03)=1.03. The differences in the impact of learning
about one’s counterpart investing between SPD-FF and
SPD-PF might be explained by the implicit learning in SPD-PF not being
as effective as the explicit learning in DPD and SPD-FF. The explicit
learning of the SPD-FF compared to the implicit learning of the SPD-PF
will make subjects more likely to reciprocate if their counterparts
cooperate. As shown in Table 2 a subject can only learn that his or
her counterpart has invested in an SPD-PF game when the subject has not
experienced a loss (Scenarios 1 and 8).
6.4.4 Testing the four versions of H7
For the most part, we found support that experiencing a loss makes
subjects more likely to invest in the future, holding all other
conditions fixed. The only situation in which we did not find strong
support for H7 was when a subject invested but his or her counterpart
did not invest (H7A).
H7A: There is only moderate evidence
that the mean of βi6 is positive for subjects in SPD-FF.
The posterior median for the mean of βi6 for subjects in
SPD-FF is 0.28 with a 95% credibility interval of (-0.02, 0.58).
H7B: There is strong evidence that the mean of
βi5+βi7 is positive for subjects in SPD-FF. The
posterior median for the mean of βi5+βi7 for
subjects in SPD-FF is 0.51 with a 95% credibility interval of
(0.28,0.85). The estimated median odds ratio for the effect of a
loss in the situation of H8B is exp(0.51)=1.67, a 67% increase.
H7C: There is strong evidence that the mean of
βi5 is positive for subjects in SPD-FF. The posterior
median for the mean of βi5 is 0.39 with a 95% credibility
interval of (0.16, 0.59). The estimated median odds ratio for the
effect of a loss in the situation of H8C is exp(0.39)=1.48, a 48%
increase.
H7D: There is strong evidence that the mean of
βi5 is positive for subjects in SPD-PF. The posterior
median for the mean of βi5 for subjects in SPD-PF is 0.33
with a 95% credibility interval of (0.12, 0.54). The estimated
median odds ratio for the effect of a loss in the situation of H8D
is exp(0.33)=1.39, a 39% increase. Although we cannot determine why
an individual chose to invest in period t after not
investing and suffering a loss in t–1, one plausible
reason would be that the person wanted to avoid the regret next
period that she experienced at having not taking an action that
could have prevented the loss in the previous period. This has been
demonstrated in some recent neuroimaging studies of choice behavior
between two gambles (Coricelli et al., 2005).
6.4.5 Testing H8
We did not find strong evidence that the effect of a loss was
greater when the subject’s failure to invest was the sole cause of
the loss as compared to when both players share some blame for the
loss. This hypothesis can be tested only for subjects in SPD-FF. The
odds ratio for a subject to invest in the current period if the
subject did not invest in the previous period, experienced a loss
and the counterpart invested compared to the same conditions but the
subject did not experience a loss is exp(βi5+βi7).
The odds ratio for a subject in SPD-FF to invest in the current
period if the subject did not invest in the previous period,
experienced a loss and the counterpart did not invest compared to
the same conditions but the subject did not experience a loss is
exp(βi5). H8 is hypothesizing that the former odds ratio
is larger than the latter odds ratio on average. Thus, H8 is
hypothesizing that the mean of βi7 is greater than zero for
subjects in SPD-FF. The posterior median for the mean of
βi7 for subjects in SPD-FF is 0.13 with a 95% credibility
interval of (−0.17, 0.49). Thus, although the point estimate
supports H8, there is not strong evidence for H8.
6.4.6 Effects of person-level covariates
We now describe for each of the random subject coefficients
βi1,… ,βi7 which of the six person level
covariates (age, gender, race, undergraduate, business major and the
interaction between undergraduate and business major), if any, had
statistically significant effects on the mean of the random
coefficient at a 95% confidence level.
1. βi1 (propensity to invest): None of the person level
covariates had a significant effect.
2. βi2 (persistence of investment): Age had a positive
effect on persistence. The mean of βi2 was estimated to
increase by 0.03 for each year of age with a 95% credibility
interval for this effect of (0.01, 0.06). Men were more persistent
than women on average. The mean of βi2 was estimated to be
0.35 higher for men than women with a 95% credibility interval of
(0.03, 0.66).
3. βi3 (increase in investment when counterpart invests):
Whites increase their investment when the counterpart invests less
(are less cooperative) than non-whites on average. The mean of
βi3 was estimated to be 0.46 lower for whites than
non-whites with a 95% credibility interval of (0.18, 0.75).
4. βi4 (interaction between subject’s and counterpart’s
decision to invest): Whites have more of an interaction between
subject’s and counterpart’s decision to invest than minorities on
average. The mean of βi4 was estimated to be 0.44 higher
for whites than minorities with a 95% credibility interval of
(0.11, 0.79).
5. βi5 (effect of loss when subject does not invest):
Undergrads respond less to losses than graduate students and
non-students on average. The mean of βi5 was estimated to
be 0.34 lower for undergrads with a 95% credibility interval of
(0.09,0.59).
6. βi6 (effect of loss when subject does invest): None of
the person level covariates had a significant effect.
7. βi7 (additional effect of loss when subject does not
invest and counterpart invests): None of the person level covariates
had a significant effect.
While these covariate effects are quite suggestive, we believe that
further study with a broader population is necessary, and also presents
a possibility for public policy implications in the future.
7 Interpretation of key findings
This paper provides evidence that, in a two person
prisoner’s dilemma game, individuals are much more
likely to be cooperative when payoffs are deterministic (the DPD game)
than when there is some chance that one will not suffer a loss, even if
one does not invest in protection (the SPD games).
There are several reasons why individuals may decide to undertake
cooperative action in some period t of a DPD or SPD game even
though non-cooperative behavior with its inferior payoffs is the Nash
equilibrium. An individual might decide to choose actions that she
would most like the other person to choose so that both parties gain in
the process. This commitment theory implies that in a two
person DPD or SPD game individual A will choose to cooperate
under the assumption that individual B will do the same; the
expected payoffs to A and B of this action is
higher than if both persons did not cooperate (Laffont, 1975;
Harsanyi, 1980). This may be the principal reason why there was more
cooperative behavior in the DPD game than in the SPD games and why
there is more cooperation in an SPD game with full feedback than in one
with partial feedback. (See H1 and H4). Commitment theories are
consistent with voluntary behavior in social dilemmas such as water
conservation (Laffont, 1975), tax evasion (Baldry, 1987) and voting
(Struthers & Young, 1989).
An alternative view of such behavior is that an individual will be
altruistic by being concerned with her counterpart’s
welfare and trying to enhance it. In a two person game, individual A
might be altruistic so that a higher return obtained by
individual B is treated positively as an attribute in
A’s utility function (Becker, 1974; Andreoni, 1989,
1990). Altruistic behavior has been used by economists to explain
intergenerational bequests and social security (Coate, 1995) as well
helping others employees in a workplace setting (Rotemberg, 1994).
A more self-interested view of behavior would be anticipated by
reciprocity whereby individual A decides to cooperate in
period t-1 with the expectation that B will then cooperate in
period t. Models of reciprocity have been used to explain
helping in the work place (Frey, 1993) and labor markets (Akerlof,
1982) as well as voluntary contributions to public goods (Sugden,
1982). The above theory of reciprocity might also imply retaliation,
so that if individual A learned that B did not cooperate in period
t then A would also decide not to cooperate in period
t+1. One reason that there may have been more cooperation in
a DPD world than in an SPD environment (H1) is that individuals knew
that if they followed such a tit-for-tat (TFT) strategy they could hurt
the other opponent. In an SPD game if one learned that an opponent had
not cooperated, a TFT strategy may not punish the other player since
there is some chance of not suffering a loss even if both players do
not cooperate (i.e. do not invest in protection).
8 Suggestions for Future Research
An IDS setting with two equilibria opens up the possibility of tipping
behavior in the spirit of Schelling (1978) and others. Future
experiments could study when tipping is likely to occur if all players
in the group are identical or when there is heterogeneity among the
players. In either situation one could force one or more of the
players to make a decision as to whether or not to invest, as Hess,
Holt and Smith (2007) did this in their sequential model where the
probability of suffering an indirect loss is uncertain (i.e.
q<1). One could then determine whether tipping
occurs because other players follow suit. A related line of
experiments would examine individual behavior in either a simultaneous
or sequential game when the probability of a loss is very low
(i.e. p, q < .1) and the loss L is very
high. One could also vary the size of the loss depending on whether
the cause is due to one’s own failure to invest or from
the counterpart’s decision not to protect herself.
At a prescriptive level one could also design experiments that
induced one or more players to invest in protection by imposing
positive economic incentives (e.g. subsidies) to encourage this actions
or negative sanctions (e.g. fines) for failure to do so. Given the
much larger proportion of pairs of individuals who failed to invest in
protection when outcomes were uncertain than when they were
deterministic, it may be necessary to intervene in these ways to
improve both individual and social welfare in the many IDS-like
situations that we are facing in today’s interdependent
world.
This research
represents only one data point in the large “hypercube” of possible
IDS games. We expect very soon to complete a web-based IDS tool that
will allow researchers from other universities and research
institutions to run IDS games with differing values of p, q, c, L,
vary the number of players, examine context effects as well as
undertake other analyses. We would also add process survey questions
to understand why individuals behaved as they did. This promises to
provide additional clarity as to individuals’ decision processes when
there are uncertain outcomes and use these findings to suggest ways of
inducing cooperation among agents, thus improving both individual and
social welfare.
References
Akerlof, G. (1982). Labor Contracts as Partial Gift
Exchange. Quarterly Journal of Economics,
97, 543–569.
Andreoni, J. (1989). Giving with impure altruism:
Applications to charity and Ricardian equivalence.
Journal of Political Economy, 97, 1447–1458.
Andreoni, J. (1990). Impure altruism and donations to
public goods: A theory of warm-glow giving.
Economic Journal, 100, 464–477.
Andreoni, J., & Miller, J. (1993). Rational
cooperation in the finitely repeated prisoner’s
dilemma: experimental evidence. Economic
Journal 103, 570–585.
Axelrod, R. (1984). The evolution of cooperation. Basic
Books: New York.
Axelrod, R., & Dion, D. (1988). The further
evolution of cooperation. Science 242,
1385–1389.
Axelrod, R., & Hamilton, W. D. (1981). The evolution
of cooperation. Science 211, 1390–1396.
Baldry, J. (1987). Income Tax Evasion and the Tax
Schedule. Public Finance, 42, 357–383.
Becker, G. (1974). A theory of social
interaction. Journal of Political Economy,
82, 1063–1093.
Bendor, J. (1987). In good times and bad: reciprocity
in an uncertain world. American Journal of
Political Science, 31, 531–538.
Bendor, J. (1993). Uncertainty and the evolution of
cooperation. Journal of Conflict
Resolution, 37, 709–734
Bendor, J., Kramer, R. M., & Stout, S. (1991). When
in doubt... cooperation in a noisy prisoner’s
dilemma. Journal of Conflict Resolution
35, 691–719.
Bereby-Meyer, Y., & Roth, A. E. (2006). The speed of
learning in noisy games: partial reinforcement and the sustainability
of cooperation. American Economic Review
96, 1029–1042.
Bostian, A., Holt, C., & Smith, A. (2007). The
Newsvendor Pull-to-Center Effect: Adaptive Learning
in a Laboratory Experiment. Forthcoming in
Manufacturing and Service Operations Management.
Coate, S. (1995). Altruism, the
Samaritan’s Dilemma, and Government Transfer
Policy. American Economic Review, 85,
46–57.
Cooper, R., Dejong, D. V., Forsythe, R., & Ross, T. W. (1996).
Cooperation without reputation: experimental
evidence from the prisoner’s dilemma
games. Games and Economic Behavior 12,
187–218.
Coricelli, G., Critchley, H. D., Joffily, M., O’Doherty,
J. D., Sirigu, A., & Dolan, R. J. (2005). Regret and
its avoidance: A neuroimaging study of choice
behavior. Nature Neuroscience, 8, 1255–1262.
Crawford, V. (1995). Adaptive dynamics in
coordination games. Econometrica, 63,
103–143.
Crawford, V., & Broseta, B. (1998). What price coordination? The
efficiency-enhancing effect of auctioning the right to buy.
American Economic Review, 88, 198–225.
Dawes, R. M. (1980). Social dilemmas Annual review of
psychology, 31, 169–193.
Donninger, C. (1986). Is it always efficient to be nice? A computer
simulation of Axelrod’s computer tournament. In A. Diekmann and P.
Mitter (Eds.), Paradoxical effects of social behavior, pp.
123–134. Heidelberg: Physica-Verlag.
Frey, B. (1993). Shirking or work morale? The impact
of regulating. European Economic Review,
37, 1523–1532.
Gelman, A., Carlin, J. B., Stern, H. S., & Rubin, D. B. (2004).
Bayesian data analysis, second edition. Boca Raton, FL:
Chapman and Hall.
Gelman, A., & Rubin, D. B. (1992). Inference from
iterative simulation using multiple sequences (with
discussion). Statistical Science, 7,
457–511.
Gibbons, R. (1992). Game theory for applied economists.
Princeton, NJ: Princeton University Press.
Harsanyi, J. (1980). Rule utilitarianism, rights, obligations and the
theory of rational behaviour. Theory and Decision, 12,
115–133.
Hauk, E., & Nagel, R. (2001). Choice of partners in multiple
two-person prisoner’s dilemma games: An experimental study.
Journal of Conflict Resolution, 45, 770–793.
Heal, G., & Kunreuther, H. (2005). You only die once: Interdependent
security in an uncertain world. In H. W. Richardson, P. Gordon, & J.
E. Moore II (Eds.), The economic impacts of terrorist
attacks, pp. 35–56. Cheltenham, UK: Edward Elgar.
Hess, R. Holt, C., & Smith, A. (2007). Coordination
of Strategic Responses to Security Threats: Laboratory
Evidence. Experimental Economics, 10,
235–250.
Kahneman, D., Knetsch, J. L., Thaler, R. H., (1991). The endowment
effect, loss aversion, and status quo bias: Anomalies. Journal
of Economic Perspectives, 5, 193–206.
Kreps, D., Milgrom, P., Roberts, J., & Wilson, R. (1982). Rational
cooperation in the finitely repeated prisoner’s dilemma.
Journal of Economic Theory, 27, 245–252.
Kunreuther, H., & Heal, G. (2003). Interdependent
security. Journal of Risk and Uncertainty,
26, 231–249.
Kunreuther, H. (2006). Comprehensive disaster insurance: Has its time
come? In Risk and disaster: Lessons from hurricane katrina.
In R. J. Daniels, D. F. Kettl, & H. Kunreuther (Eds.), On
risk and disaster: Lessons from Hurricane Katrina, pp. 175–201.
Philadelphia: University of Pennsylvania Press.
Laffont, J. J. (1975). Macroeconomic constraints,
economic efficiency and ethics: An introduction to Kantian
economics. Economica, 42, 430–437.
Molander, P. (1985). The optimal level of generosity
in a selfish, uncertain environment.
Journal of Conflict Resolution, 29, 611–618.
Mueller, U. (1987). Optimal retaliation for optimal
cooperation. Journal of Conflict
Resolution, 31, 692–724.
Rotemberg, J. (1994). Human relations in the
workplace. Journal of Political Economy,
102, 684–717.
Samuelson, W., & Zeckhauser, R. (1988). Status quo
bias in decision making. Journal of Risk
and Uncertainty, 1, 7–59.
Schelling, T. J. (1978). Micromotives and macrobehavior.
New York: Norton.
Selten, R., & Stoecker, R. (1986). End behavior in
sequences of finite prisoner’s dilemma supergames: a
learning theory approach. Journal of
Economic Behavior and Organization, 7, 47–70.
Stockard, J., O’Brien, R. M., & Peters, E. (2007). The use of mixed
models in a modified Iowa Gambling Task and a prisoner’s dilemma
game. Judgment and Decision Making, 2, 9–22.
Struthers, J., & Young, A. (1989). The economics of
voting: Theories and evidence. Journal of
Economic Studies, 16, 1–43.
Sugden, R. (1982). On the economics of
philanthropy. Economic Journal, 92, 1982,
341–350.
=0em
Appendix. Instructions to subjects
1. Instructions Presented to Subjects in the Deterministic
Prisoner’s Dilemma Condition
[Opening Instruction Page:]
This is a game in which the outcomes of your decisions depend not only
on what you do, but also on what your counterpart
does.
You will be paired with another person in the room whose identity is not
known to you. In each of 10 rounds, you and your counterpart will
independently make a decision about whether or not to invest funds to
avoid a financial loss from a negative event.
• If both of you choose to INVEST then it will cost
each of you 12 talers, but neither of you will experience a financial
loss from a negative event.
• If one of you INVESTS and the other does NOT
INVEST, it will cost the one who INVESTS 12 Talers. In addition, both
people will suffer an equal financial loss of 10 Talers from a negative
event.
• If both of you choose to NOT INVEST, then each of
you suffers an equal financial loss of 16 Talers from a negative
event.
Below is the summary of the possible outcomes:
| | | Your Counterpart |
| | | INVEST | NOT INVEST |
| 2.3inYou | INVEST | • You lose 12. • Your counterpart loses 12. | • You lose 22. • Your counterpart loses 10. |
| | NOT INVEST | • You lose 10. • Your counterpart loses 22. | • You lose 16. • Your counterpart loses 16. |
You and your counterpart are each given 300 Talers (10 talers = $1)
before you start making decisions. You will not know the decision your
counterpart has made until the end of the round. Before the start of
the next round you will be given feedback on what each of you did and
the status of your assets.
One pair will be chosen at random to receive the dollar equivalent of
the talers they have at the end of the game (10 talers = $1).
[Each subject sees the following screen before making his/her decision
for the first round:]
[After each person in the pair has made a decision, subjects see their
decisions and payoffs highlighted in a table:]
[In subsequent rounds each subject sees a history report of past
decisions in the supergame. The subject sees this on the decision
screen:]
2a. Instructions Presented to Subjects in the Stochastic
Full-Feedback Condition (for p=0.2):6
[Opening Instruction Page:]
This is a game in which the outcomes of your decisions depend not only
on what you do, but also on what your counterpart
does.
You will be paired with another person in the room whose identity is not
known to you. In each of 10 rounds, you and your counterpart will
independently make a decision about whether or not to invest funds to
avoid a financial loss from a random negative event.
Financial losses will be measured in a fictitious currency called
“Talers.”
• If both you and your counterpart choose to
INVEST, then the investment cost to each of you is 12 talers.
• If you INVEST and your counterpart does NOT
INVEST, then there is a 20% chance that your counterpart will lose 50
talers and you will lose 62 talers; and there is an 80% chance that
your counterpart will lose 0 talers and you will lose 12
talers.
• If you do NOT INVEST and your counterpart
INVESTS, then there is a 20% chance that your counterpart will lose 62
talers and you will lose 50 talers; and there is an 80% chance that
your counterpart will lose 12 talers and you will lose 0
talers.
• If both you and your counterpart choose to NOT
INVEST, then each of you has an 36% chance of losing 50 talers, and a
64% chance of losing 0 talers.
Probabilistic outcomes will be determined by the following Random Number
Generator, where it is equally likely that any number between 1 and 100
is chosen.
For Example: If the Random Number generated is 6, then 6 will flash as
follows:
Below is a summary of the possible outcomes:
| | | Your Counterpart |
| | | INVEST | NOT INVEST |
| 70.37685984inYou | 3.63inINVEST | • You lose 12 talers.
• Your counterpart loses 12 talers. | • You definitely lose 12 talers and have a 20%
chance of losing an additional 50 talers.
• Your counterpart has a 20% chance of losing 50
talers and an 80% chance of losing 0 talers. |
| | 4.63inNOT INVEST | • You have a 20% chance of losing 50 talers and an
80% chance of losing 0 talers.
• Your counterpart definitely loses 12 talers and
has a 20% chance of losing an additional 50 talers. | • You have a 36% chance of losing 50 talers and a
64% chance of losing 0 talers.
• Your counterpart has a 36% chance of losing 50
talers and a 64% chance of losing 0 talers. |
You and your counterpart are each given 300 Talers before you start
making decisions. You will not know the decision your counterpart has
made until the end of each round. Before the start of the next round
you will be given feedback on what each of you did, whether or not a
negative event occurred and the status of your assets.
One pair will be chosen at random to receive the dollar equivalent of
the talers they have at the end of the game (10 talers = $1).
[The payoff screen (what each pair sees after making their decisions for
a round) looks like this:]
[The “Results of previous
rounds” history table on the decision screen looks
like this:]
Round | Negative Event | Your Decision | Your Outcome | Your Ending Balance | Counterpart’s Decision | Counterpart’s Outcome | Counterpart’s Ending Balance |
1 | No | Not Invest | -0 | 300 | Not Invest | -0 | 300 |
2 | Yes | Invest | -62 | 238 | Not Invest | -50 | 250 |
3 | No | Not Invest | -0 | 238 | Invest | -12 | 238 |
4 | No | Not Invest | -0 | 238 | Not Invest | -0 | 238 |
2b. Instructions Presented to Subjects in the Stochastic Full-Feedback
Condition (for p=0.4):
[Opening Instruction Page is analogous to the p=0.2 condition, but with
the following changes to the color-grid and the payoff matrix:]
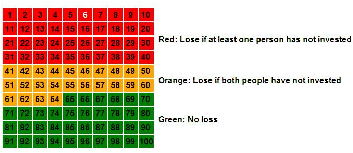
| | | Your Counterpart |
| | | INVEST | NOT INVEST |
| 70.37685984inYou | 3.63inINVEST | • You lose 12 talers. • Your counterpart loses 12 talers. | • You definitely lose 12 talers and have a 40%
chance of losing an additional 25 talers. • Your counterpart has a 40% chance of losing 25
talers and a 60% chance of losing 0 talers. |
| | 4.63inNOT INVEST | • You have a 40% chance of losing 25 talers and a
60% chance of losing 0 talers. • Your counterpart definitely loses 12 talers and
has a 40% chance of losing an additional 25 talers. | • You have a 64% chance of losing 25 talers and a
36% chance of losing 0 talers. • Your counterpart has a 64% chance of losing 25
talers and a 36% chance of losing 0 talers. |
[Other screens are formatted analogously to those shown above for
p=0.2.]
2c. Instructions Presented to Subjects in the Stochastic Full-Feedback
Condition (for p=0.6):
[Opening Instruction Page is analogous to the p=0.2 and p=0.4
conditions, but with the following changes to the color-grid and the
payoff matrix:]
| | | Your Counterpart |
| | | INVEST | NOT INVEST |
| 70.37685984inYou | 3.63inINVEST | • You lose 12 talers. • Your counterpart loses 12 talers. | • You definitely lose 12 talers and have a 60%
chance of losing an additional 19 talers. • Your counterpart has a 60% chance of losing 19
talers and a 40% chance of losing 0 talers. |
| | 4.63inNOT INVEST | • You have a 60% chance of losing 12 talers and a
40% chance of losing 0 talers. • Your counterpart definitely loses 12 talers and
has a 60% chance of losing an additional 19 talers. | • You have an 84% chance of losing 19 talers and a
16% chance of losing 0 talers. • Your counterpart has an 84% chance of losing 19
talers and a 16% chance of losing 0 talers. |
[Other screens are formatted analogously to those shown above for
p=0.2.]
3. Instructions Presented to Subjects in the Stochastic Partial-Feedback
Condition:
[The Stochastic Partial-Feedback condition differs from the
Full-Feedback as follows:]
[1. Opening Instructions in the Partial-Feedback condition are the same
as in the Full-Feedback condition except that the penultimate paragraph
reads as follows:]
You and your counterpart are each given 300 Talers before you start
making decisions. You will not know the decision your counterpart has
made. Before the start of the next round you will be given feedback on
what you did and the status of your assets.
[2. The payoff screen does not indicate counterpart’s decision
or counterpart’s talers lost.]
[3. The history table (“Results of previous
rounds”) does not show columns relating to
counterpart information.]
This document was translated from LATEX by
HEVEA.