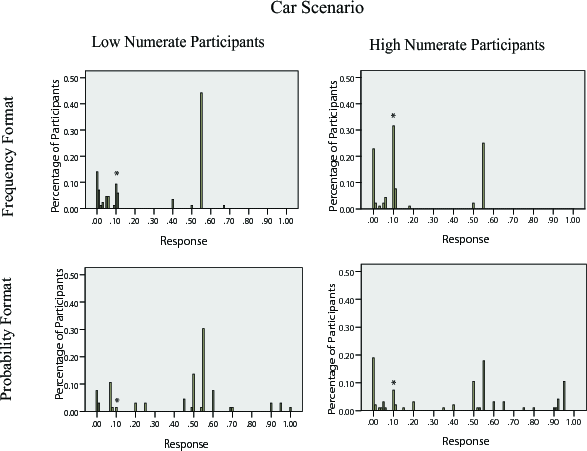
| Figure 1: Distribution of responses among high- and low-numerate participants in the probability and frequency versions of the car scenario. |
Judgment and Decision Making, vol. 4, no. 1, February 2009, pp. 34-40
Numeracy, frequency, and Bayesian reasoningGretchen B. Chapman* |
Previous research has demonstrated that Bayesian reasoning performance is improved if uncertainty information is presented as natural frequencies rather than single-event probabilities. A questionnaire study of 342 college students replicated this effect but also found that the performance-boosting benefits of the natural frequency presentation occurred primarily for participants who scored high in numeracy. This finding suggests that even comprehension and manipulation of natural frequencies requires a certain threshold of numeracy abilities, and that the beneficial effects of natural frequency presentation may not be as general as previously believed.
Keywords: natural frequency, probability, numeracy, Bayesian, base
rate.
Bayesian reasoning performance can be improved if uncertainty information is presented as natural frequencies. Gigerenzer and Hoffrage (1995, p. 697) argue that “an evolutionary point of view suggests that the mind is tuned to frequency formats, which is the information format humans encountered long before the advent of probability theory.” Although there is some disagreement among researchers about the reason why natural frequency presentations facilitate Bayesian reasoning (see Barbey & Sloman, 2007, and subsequent commentaries), the result that they do improve performance is well established.
In the current paper we examine whether the natural frequency presentation facilitates Bayesian reasoning among some people more than others. One result that suggests that it does is a study by Bramwell, West, and Salmon (2006). They presented a Bayesian pregnancy screening scenario to obstetricians, midwives, pregnant women, and the women’s companions. Participants were told the base rate of a birth defect and the hit rate and false alarm rate of a prenatal test. They were asked to estimate the posterior probability that, given an abnormal test result, the baby actually has the birth defect. Accurate responses were more frequent when the scenario was presented in terms of natural frequencies rather than probabilities. Interestingly, this effect of presentation format was limited to the obstetricians. For the other three groups, performance was equally poor for both presentation formats. Thus, the facilitative effect of the natural frequency format does not appear to be universal. Natural frequencies benefit only some types of reasoners.
One factor that may help to explain this result is numeracy. Numeracy skill, defined as “the ability to process basic probability and numerical concepts” (Peters et al., 2006), has been studied in association with a number of decision tasks because many judgments and decisions rely heavily on mathematical concepts (see Reyna & Brainerd, 2007, for a review). For example, Gurmankin, Baron, and Armstrong (2004) found that more numerate people are more trusting of and more comfortable with a physician’s risk communication when it includes a numeric statement of risk than when it does not, whereas less numerate people are more trusting if given non-numeric risk statements. Peters et al. (2006) found that, compared to their counterparts, highly numerate individuals are more likely to retrieve and use appropriate numerical principles, thus making themselves less susceptible to framing effects in tasks involving numbers.
It is of interest to explore whether high numerates benefit more than low numerates from uncertainty information that is presented as natural frequencies rather than single-event probabilities. In the present study, college students solved two Bayesian reasoning problems. For each participant, one problem was presented in a probability format and the other in a natural frequency format. We also assessed the numeracy level of participants.
The participants were 346 college students (44% female) who participated in partial fulfillment for a course requirement. The study was administered as part of a longer online survey. Each participant responded to two scenarios and completed a numeracy measure.
The two scenarios each presented a Bayesian reasoning problem. One was a medical scenario taken from Bramwell et al. (2006), and the other was an automobile scenario written for this experiment. We varied presentation format of the uncertainty information across the scenarios. For each participant, one problem was presented using probabilities and the other was presented using natural frequencies, as shown.
Medical scenarioProbability Version: The serum test screens pregnant women for babies with Down’s syndrome. The test is a very good one, but not perfect. Roughly 1% of babies have Down’s syndrome. If the baby has Down’s syndrome, there is a 90% chance that the result will be positive. If the baby is unaffected, there is still a 1% chance that the result will be positive. A pregnant woman has been tested and the result is positive. What is the chance that her baby actually has Down’s syndrome? ______ %
Frequency Version: The serum test screens pregnant women for babies with Down’s syndrome. The test is a very good one, but not perfect. Roughly 100 babies out of 10,000 have Down’s syndrome. Of these 100 babies with Down’s syndrome, 90 will have a positive test result. Of the remaining 9,900 unaffected babies, 99 will still have a positive test result. How many pregnant women who have a positive result to the test actually have a baby with Down’s syndrome? _____ out of ______
Car scenarioProbability Version: 1% of car trips in New Brunswick result in an accident. According to police records, in 55% of the car trips that resulted in an accident, the driver was drunk. In 5% of the car trips that did not result in an accident, the driver was drunk. If the driver is drunk, what is the probability of an accident? _______%
Frequency Version: 100 out of 10,000 car trips in New Brunswick result in an accident. According to police records, among the 100 car trips that resulted in an accident, the driver was drunk in 55 of them. Among the 9,900 car trips that did not result in an accident, the driver was drunk in 500 of them. How many car trips where the driver was drunk result in an accident? ___ out of ___.
We counterbalanced which scenario was presented in the probability version and which in the frequency version. Each participant completed the 11-item numeracy scale from Lipkus, Samsa, and Rimer (2001), as shown in the appendix. This scale tests comprehension of probabilistic information.
Figure 1: Distribution of responses among high- and low-numerate participants in the probability and frequency versions of the car scenario.
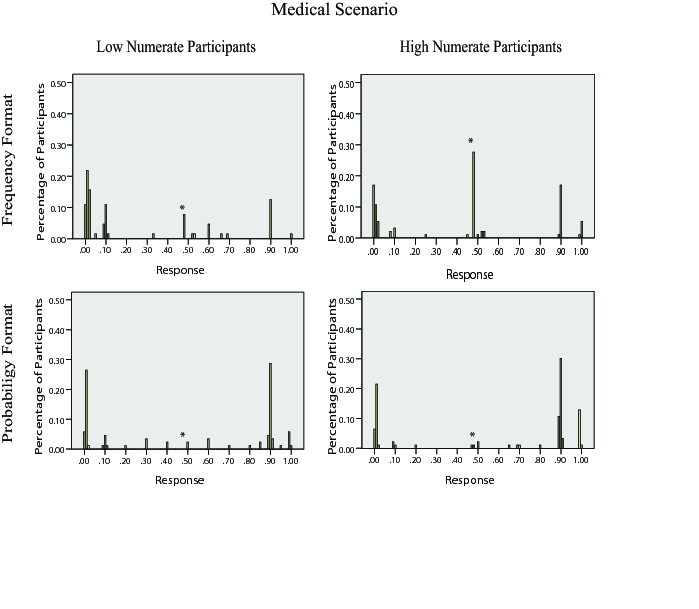
Figure 2: Distribution of responses among high- and low-numerate participants in the probability and frequency versions of the medical scenario.
The mean numeracy score was 8.08 (median = 9, range 0 to 11). We used a median split to form a high-numerate group (n=190) and a low-numerate group (n=156).
In the frequency version of each scenario, we computed the ratio between the two numbers that participants provided as the numerator and denominator requested. A few participants (2 in the car scenario and 4 in the medical scenario) gave a numerator that was larger than the denominator. These responses were coded as missing (in addition to one response that actually was missing).
Figures 1 and 2 show the frequency distribution of responses to each scenario in the probability and frequency conditions for low and high numerate participants. Correct responses are marked with an asterisk. Correct responses were infrequent, with the overall level of performance about as low as that seen in Bramwell et al. (2006) and lower than that seen in some other studies (Brase 2008, 2009).
In the car scenario, the correct answer was 9.91% (55 out of 555)1, and response between 9.5% and 10.5% are marked with an asterisk in Figure 1. As shown in this figure, correct responses were rare, but were most frequent among high numerate participants in the frequency format condition. The most common incorrect response was 55%, which is the hit rate given in the scenario. Responses less than 1% were also common, especially in the frequency format. This was primarily due to participants giving responses of 55 out of 10,000 (in other words, the correct numerator, but using the entire reference class as the denominator).
In the medical scenario the correct answer was 47.62% (90 out of 189), and responses between 47.5% and 48.5% are marked with an asterisk in Figure 2. Again, correct responses were rare but most frequent among high numerate participants in the frequency format condition. The most common incorrect responses were 90%, which is the hit rate given in the scenario, and 1%, which is both the base rate and the false positive rate given in the scenario. Responses less than 1% were also somewhat common, especially in the frequency format, and primarily the response 90 out of 10,000 (again, the correct numerator, but using the entire reference class as the denominator).
Table 1 shows the percentage of correct responses for each scenario in the frequency and probability formats for both low- and high-numerate participants (with correct responses coded the same as in Figures 1 and 2). Correct responses were almost nonexistent in the probability format. Participants gave correct responses more often in the frequency format than in the probability format. This effect of uncertainty format was present for both high and low numerates, but it was especially pronounced among the high numerate participants.
| Table 1: Percentage of correct responses. |
| High Numerates (n=190) | Low Numerates (n=156) | |||
Format | Medical Scenario | Car Scenario | Medical Scenario | Car Scenario |
Probability | 1% | 7% | 0% | 1% |
Frequency | 27% | 31% | 7% | 10% |
χ2 value | 26.38 | 17.17 | 6.86 | 4.73 |
p value | <.0001 | <.0001 | .009a | .03b |
| a Fisher’s Exact Test p=.01 | ||||
| b Fisher’s Exact Test p=.04 | ||||
We performed a logistic regression using the dichotomous coding of responses (correct/incorrect) as the dependent variable. The independent variables included probability vs. frequency format, scenario (medical or car) and numeracy as a continuous variable. Format and scenario were both within-subject variables, but because of the mixed design, their interaction was between-subjects (corresponding to the counterbalance condition). Table 2 shows the chi square and log odds ratio for each main effect and interaction. Of primary interest, there was a significant interaction between probability/frequency format and numeracy, indicating that participants higher in numeracy were more affected by format than were low numerate subjects. There was also a main effect of numeracy.
Table 2: Logistic regression results.
aIn a logistic regression, the lnOR coefficient of a main effect represents the effect of that variable when the variables it interacts with are at their reference levels. For example, the lnOR for numeracy represents the effect of numeracy when UF = probability and S=medical. The overall effect of a variable, as reflected in the χ2, can be found by adding the lnOR coefficients for the main effect and all interactions the variable participated in.
The current study replicated previous work in finding that performance on Bayesian problems is better when the problem uses a natural frequency format rather than a probability format. The results are also in line with previous research in showing that people higher in numeracy perform better on computational tasks. The study extends previous research in demonstrating that the benefits of the natural frequency format occurred primarily for participants who were high in numeracy. This result suggests that even comprehension of natural frequencies may require a certain threshold of numeracy abilities. Accurate performance in the probability format was near zero for participants of all numeracy levels, suggesting a floor effect. These Bayesian problems are obviously quite difficult for participants, and even modest levels of accuracy are found only under the dual condition that the problem appears in a frequency format and the participant has a high level of numeracy.
A number of previous studies (e.g., Peters et al., 2006) have found that numeracy is associated with performance on decision tasks. The usual result is that high numerates are less susceptible to framing effects than their low numerate counterparts. For example, Peters et al. (2006) examined a framing effect that entailed probability and frequency presentation of equivalent information. Whereas low numerates rated a 10 out of 100 risk as larger than a 10% risk, high numerates gave equivalent risk ratings in these two formats. Thus, low numerates were more influenced than high numerates by whether the format of the risk information was probability or frequency. In contrast, in the present study it was high numerates who were more influenced by whether the problem was presented as frequencies or probabilities. The Peters et al. (2006) result is perhaps not surprising given that the ability to see that 10% is equivalent to 10 out of 100 is central to numeracy measures. Several items on the numeracy scale ask participants to translate percentages to frequencies or vice versa. Thus, one would expect that higher numerate subjects would be more likely to treat 10% as equivalent to 10 out of 100.
What is more surprising is that the high numerate subjects in the current study were more influenced by the format of the risk information. Although probability and natural frequency versions of a Bayesian problem could be considered two equivalent frames, perhaps the enhanced performance facilitated by the frequency format is not analogous to a framing effect. Instead, the effect of format on performance might be more appropriately considered a decision aid or intervention to enhance comprehension. But here again the current results contrast with previous studies. In a study by Peters, Dieckmann, Dixon, Hibbard, & Mertz (2007), low and high numerate adults compared hospitals by considering information that was presented as the ratio between patients and nurses. Among low numerate participants, comprehension and choice accuracy were better in an easier, higher-is-better ratio format (number of nurses per 100 patients) than in a harder, lower-is-better format (number of patients per nurse). Among high numerates, information format had little effect. Thus, in the Peters et al. study it was low numerates who benefited more from a presentation format designed to aid comprehension. This result is quite the reverse of the present study which finds that it was high numerates who benefitted more from a presentation format that typically aids comprehension.
Thus, the current study is somewhat unique in demonstrating that high numerate participants are more influenced by the format of numerical information than are low numerates. No previous study has examined the association between numeracy and Bayesian reasoning. Bramwell et al. (2006) found that a frequency format enhanced Bayesian reasoning for doctors but not for midwives or patients. To the extent that doctors have higher numeracy than midwives and patients, the Bramwell result is consistent with the current results.
The reason that the current result contrasts with previous findings may be because the Bayesian task used in the current study is importantly different from the decision tasks used in previous studies of numeracy. A Bayesian problem requires participants not only to understand risk information but also to manipulate it to compute a conditional probability. In the Peters et al. (2006, 2007) studies, the key to accurate performance was understanding the risk or other numerical information that was presented. Comprehension of the information presented led directly to the correct answer. For example, understanding what the patient-to-nurse ratio means leads directly to the choice of the hospital with the lowest ratio. In a Bayesian problem, however, participants must not only comprehend the numerical information presented but also manipulate that information to compute the posterior conditional probability. The natural frequency format facilitates that manipulation. Although there is disagreement in the field regarding the mechanism by which the natural frequency format has its beneficial effects (for discussion, see Barbey & Sloman, 2007; Reyna & Brainerd, 2008), it is generally agreed that the natural frequency format leads to better performance because it facilitates computation of the conditional probability.
One possibility is that high numerates have a better grasp of the concept of conditional probability or set relationships in the first place and are therefore better able to benefit from the frequency format that makes clear which numbers to include in the conditional probability computation, whereas, low numerates may lack a firm understanding of conditional probability. Thus even though the frequency format facilitates understanding of the risks in low numerates, computation of the conditional frequency is still blocked by a poor grasp of the conditional probability concept. Another possibility is that although both high and low numerates understand conditional probability, the low numerates lack the numerical facility even to understand from the natural frequency format which numbers to include in the computation, given that a Bayesian problem presents three separate risks (the base rate, hit rate, and false alarm rate). An interesting avenue for future research would be an examination of uncertainty format on each phase in the Bayesian computing process.
Few studies other than the current study and Bramwell et al. (2006) have examined individual difference variables in Bayesian reasoning, but another notable study in this vein is Brase (2008). He found that, when Bayesian problems were presented in an ambiguous format of “chances” (e.g., there are 6 chances out of 100 of having the disease), most participants interpreted this format to imply single-event probabilities, but a sizeable minority interpreted it as frequencies. Furthermore, those that interpreted the problem in terms of frequencies were more likely to give the correct answer. Thus, as in the current study, Bayesian performance varied systematically across participants. One possible link between that study and the current study is that interpreting an ambiguous format in terms of frequencies may be a marker for high numeracy, which is why those participants performed better. Brase (2009), however, found that pictorial presentations that encouraged one interpretation over the other affected Bayesian performance, making a marker account less likely. Another possibility is that in the current study even the explicit frequency format was sufficiently ambiguous that not all participants interpreted it in terms of frequencies, and the high numerate participants were more likely to do so. It is also possible that interpretation of ambiguous formats and numeracy are two separate factors that both moderate Bayesian performance.
The fact that the benefits of the natural frequency presentation are concentrated in a subset of decision makers may call into question evolutionary accounts of why natural frequencies improve Bayesian reasoning (Gigerenzer & Hoffrage, 1995), in as much as evolutionary forces shape species rather than individuals. In any event, such individual differences imply that people with different levels of numeracy abilities need different decision making assistance.
Barbey, A. K. & Sloman, S. A. (2007). Base-rate respect: From ecological rationality to dual processes. Behavioral and Brain Sciences, 30, 241–297.
Bramwell, R., West, H., & Salmon, P. (2006). Health professionals’ and service users’ interpretation of screening test results: experimental study. British Medical Journal, 333, 284–289.
Brase, G. L. (2008). Frequency interpretation of ambiguous statistical information facilitates Bayesian reasoning. Psychonomic Bulletin and Review, 15, 284–289.
Brase, G. L. (2009). Pictorial representations in statistical reasoning. Applied Cognitive Psychology, 23, 369–381.
Gigerenzer, G. & Hoffrage, U. (1995). How to improve Bayesian reasoning without instruction: Frequency formats. Psychological Review, 102, 684–704.
Gurmankin, A. D., Baron, J., & Armstrong, K. (2004). The effect of numerical statements of risk on trust and comfort with hypothetical physician risk communication. Medical Decision Making, 24, 265–271.
Lipkus, I. M., Samsa, G., & Rimer, B. K. (2001). General performance on a numeracy scale among highly educated samples. Medical Decision Making, 21, 37–44.
Peters, E., Dieckmann, N., Dixon, A., Hibbard, J. H., & Mertz, C. K. (2007). Less is more in presenting quality information to consumers. Medical Care Research and Review, 64, 169–190.
Peters, E., Vastfjall, E., Slovic, P., Mertz, C. K., Mazzocco, K., & Dickert, S. (2006). Numeracy and decision making. Psychological Science, 17, 407–413.
Reyna, V. F. & Brainerd, C. J. (2007). The importance of mathematics in health and human judgment: Numeracy, risk communication, and medical decision making. Learning and Individual Differences, 17, 147–159.
Reyna, V. F. & Brainerd, C. J. (2008). Numeracy, ratio bias, and denominator neglect in judgments of risk and probability. Learning and Individual Differences, 18, 89–107.
1. Imagine that we roll a fair, six-sided die 1,000 times. Out of 1,000 rolls, how many times do you think the die would come up even (2, 4, or 6)?
2. In the BIG BUCKS LOTTERY, the chances of winning a $10.00 prize are 1%. What is your best guess about how many people would win a $10.00 prize if 1,000 people each buy a single ticket from BIG BUCKS?
3. In the ACME PUBLISHING SWEEPSTAKES, the chance of winning a car is 1 in 1,000. What percent of tickets of ACME PUBLISHING SWEEPSTAKES win a car?
4. Which of the following numbers represents the biggest risk of getting a disease? 1 in 100, 1 in 1000, 1 in 10
5. Which of the following represents the biggest risk of getting a disease? 1%, 10%, 5%
6. If Person A’s risk of getting a disease is 1% in ten years, and Person B’s risk is double that of A’s, what is B’s risk?
7. If Person A’s chance of getting a disease is 1 in 100 in ten years, and Person B’s risk is double that of A, what is B’s risk?
8A. If the chance of getting a disease is 10%, how many people would be expected to get the disease out of 100?
8B. If the chance of getting a disease is 10%, how many people would be expected to get the disease out of 1000?
9. If the chance of getting a disease is 20 out of 100, this would be the same as having a ____% chance of getting the disease.
10. The chance of getting a viral infection is .0005. Out of 10,000 people, about how many of them are expected to get infected?
This document was translated from LATEX by HEVEA.