Judgment and Decision Making, vol. 3, no. 6, August 2008, pp.
449-456
“Feeling more regret than I would have imagined”: Self-report and
behavioral evidenceDiego Fernandez-Duque*
and Jessica Landers
Department of Psychology
Villanova University |
People tend to overestimate emotional responses to future events. This
study examined whether such affective forecasting errors occur for
feelings of regret, as measured by self-report and subsequent
decision-making. Some participants played a pricing game and lost by a
narrow or wide margin, while others were asked to imagine losing by
such margins. Participants who experienced a narrow loss reported more
regret than those who imagined a narrow loss. Furthermore, those
experiencing a narrow loss behaved more cautiously in a subsequent
gambling task. Thus, the study provides self-report and behavioral
evidence for a reversal of the affective forecasting phenomenon for
feelings of regret.
Keywords: regret, affective forecasting, emotion, future events.
1 Introduction
People want to be happy: when confronted with a decision, they’d
rather choose the path to joy than the path to misery. If only it were
that simple! One problem is that the paths are rarely labeled; instead
people have to imagine the feelings that the outcome of their
decisions would trigger. And, although people are relatively skilled at
predicting how a certain outcome will make them feel, they are less
skilled at predicting the intensity and duration of those emotions.
You can guess that getting tenure will make you happy, but the elation
will dissipate faster than you would imagine. This asymmetry between
anticipating and experiencing emotions has been
studied in the laboratory, as well as in natural settings, under the
banner of “affective forecasting” (Wilson & Gilbert, 2003).
In a typical laboratory study of affective forecasting, participants
first report their general happiness and next engage in some
experimental procedure with uncertain outcome. Finally, some participants
are asked to predict how happy they would feel after receiving a
particular outcome, while others are told the outcome first and then are
asked to report the happiness they experience. This allows researchers
to measure the extent to which anticipated and
experienced feelings depart from the baseline level of
happiness reported at the beginning of the session. The typical result
is that participants overestimate the duration of their forecasted
emotions, which leads them to overestimate how intense their feelings
will be some time after the outcome. For example, when asked to imagine
how they would feel 10 minutes after losing money in a gambling task,
people predict more unhappiness than the unhappiness they experience 10
minutes after actually losing (Kermer, Driver Linn, Wilson, & Gilbert,
2006). People also overestimate the intensity of their initial reaction
(Buehler & McFarland, 2001).
Considerable evidence has accumulated over the last 10 years in support
of the basic finding that people overestimate the impact that future
events will have on their emotional response (Gilbert, Pinel, Wilson,
Blumberg, & Wheatley, 1998). Most of these studies have equated
emotional response with changes in valence. For example, some studies
have asked participants to report their happiness on a scale ranging
from not happy to very happy. Other studies have
asked participants to report the intensity of several different
emotions and those reports were later converted into composites scores
of positive and negative valence (Buehler & McFarland, 2001). This
emphasis on the pleasant/unpleasant dimension has proved useful for the
study of affective forecasting. However this approach also begs the
question of whether the forecast bias extends beyond the
pleasant/unpleasant dimension to include biases when predicting the
intensity of specific emotions. We know that people are relatively
skilled at predicting which specific emotions (e.g., anger,
fear, disgust, etc.) they will experience in different situations
(Robinson & Clore, 2002). We know less about how accurate people are
at predicting the intensity and duration of those specific emotions. A
few studies have started to examine this question particularly for the
feeling of regret. The current study is another step in that direction.
Regret can be defined as “a negative, cognitively based emotion that
we experience when realizing or imagining that our present situation
would have been better, had we decided differently” (Zeelenberg,
1999, p .94). Thus, regret is unique among emotions in its reliance
on counterfactual thinking: “If I had chosen differently,
then things would have turned out better.” When counterfactuals are
readily available, regret seems to grow more intense. For example,
people’s intuition is that poor choices are most regretful when they
are unusual choices; in those cases, the conventional approach is
readily available as a counterfactual. For a similar reason, people
believe that they will experience more regret when the desired outcome
is narrowly missed than when it is missed by a wide margin.
Presumably, a loss by a narrow margin highlights the unfulfilled
success (Medvec, Madey, & Gilovich, 1995). As a consequence, people
believe that missing a flight by 5 minutes should cause more regret
than missing it by an hour. Psychologists have shared that same
intuition for over 20 years (Kahneman & Tversky, 1982).
The intuition that narrow margins of loss are highly effective at
triggering regret has been challenged by a recent study on affective
forecasting (Gilbert, Morewedge, Risen, & Wilson, 2004). In a
naturalistic setting, people who missed the subway by a narrow margin
reported no more regret than those who missed it by a wide margin.
This result was in stark contrast to the predictions people made when
interviewed before the train arrived. The finding was replicated in an
experimental setting. For this, a new set of participants was
recruited to play a game inspired by the TV show The Price is
Right. Before starting the game, participants were asked to report
their emotional state at the time, including a report on their level
of regret and of disappointment. Next, people were asked to rank
several household products by price. Participants had to create two
arrangements that exemplified their two best guesses, and then
proceeded to choose the best one for an opportunity to win a prize.
Some participants were asked to predict how much regret they would
feel if they were to find out that the correct arrangement was the one
they did not choose (a narrow margin of loss). This condition
aimed to experimentally recreate the situation in which a participant
is asked to imagine having narrowly missed a desired outcome (e.g.,
catching the subway). Participants’ predictions in this condition were
compared to the actual feelings of regret, as reported by participants
who actually experienced a narrow margin of loss. Other participants
were asked to predict how much regret they would feel if they found
out that neither of the two arrangements was correct (a wide margin of
loss). As hypothesized by the authors of the study, participants
predicted they would feel more regret after losing by a narrow margin,
but in reality they did not. In other words, there was an asymmetry
between the amount of regret anticipated and the amount of regret
experienced.
These results were consistent with a theory of affective forecasting
that has received substantial empirical support over the years (Wilson
& Gilbert, 2003). At the same time, some aspects of the experimental
design cast doubt on the generalizability of the findings. In
particular, participants in Gilbert et al.’s (2004) study were offered
a consolation prize after being told they had lost. This small prize
may have helped participants to re-conceptualize the loss as a minor
win, thus reducing the amount of regret experienced. In fact, previous
research shows that people recover most quickly from negative events
when it is easier for them to rationalize the outcome to their favor
(Gilbert et al., 1998). Thus, the absence of a consolation prize
might lead to a very different pattern of results, one in which the
experience of regret is stronger than anticipated. Our study tested
this hypothesis.
Another limitation of the 2004 study by Gilbert et al. is its reliance
on a self-report measure. While this approach has been validated for
basic emotions such as happiness, its use for assessing more complex
emotions such as regret is a matter of debate. Asking people directly
to report how much regret they are feeling assumes that people can
easily associate their feelings with the verbal label. Although some
researchers claim this is indeed possible (Zeelenberg et al., 1998),
others argue that such direct questioning fails to discriminate regret
from other negative emotions such as disappointment (Connolly &
Butler, 2006; Marcatto & Ferrante, 2008). Furthermore, self-report
measures are subject to possible carry-over effects when the same
emotion is probed twice, as is often the case in studies of affective
forecasting.
One way to overcome the limitations of self-report measures is to
explore the influence that regret has on future behavior. Some
researchers have argued that emotions in general, and regret in
particular, exist for the sake of guiding behaviors (Zeelenberg,
Nelissen, Breugelmans, & Pieters, 2008). Many of the choices people
make aim to minimize the experience of regret, and anticipation of
regret serves to deter risk taking (Mellers, Schwartz, & Ritov, 1999;
Zeelenberg, 1999). Merely imagining the regretful consequences of our
potential actions is sometimes enough to make us decide differently
(Kahneman & Tversky, 1982; Simonson, 1992). Thus, by measuring risky
behavior after a narrow loss it should be possible for us to assess
whether experiencing or imagining the narrow loss is more effective in
triggering the emotion.
We explored this possibility with a variant of a gambling task first
introduced by Slovic (1966), which our participants completed after
participating in The Price is Right task. Participants viewed
ten cards face down on a computer screen with the instructions that
nine of the cards were good (i.e., selecting any of them would earn the
participant a dollar per card), but one of the cards was a disaster
card (i.e., choosing it would cause the loss of every dollar collected
up to that point and end the game). Following these instructions,
participant reported how many cards they would like to turn. After
turning the initial number of cards, participants made a second and
more important decision. They had to decide whether to stop and walk
away with the money or continue and pick one more card for the chance
to win another dollar. Thus, the opportunity of winning a relatively
small prize was pitted against the risk of losing a larger amount
(i.e., a regret prone situation).
In sum, using self-report and behavioral measures of regret, we aimed
to show that in the absence of a consolation prize, the experience of
regret is larger than anticipated. More precisely, we hypothesized
that, after losing by a narrow margin, participants would express
increased regret and behave more cautiously, the cautiousness being
mediated by the regret.
2 Method
Participants. Ninety-two participants who
had signed up for course credit in an introductory psychology course
were recruited for this experiment. Demographic information was not
gathered, but based on the composition of the student population at
this private institution, the majority of the sample was White,
Catholic, and upper-middle class.
Regret manipulation task. The task was
adapted from the television show The Price is Right.
Stimuli. Two identical sets of seven common household
products were placed on two shelves, one above the other. The items
were randomly clustered in the center of each shelf. The left end of
the shelves was labeled “lowest price” and the right end was labeled
“highest price.” The price of the items ranged from $ 2.59 to
$8.59.1
Procedure. In a 2 x 2 between-participants
design, participants either experienced making the wrong
choice or imagined doing so. Participants in the
experience condition were correctly told they would have an
opportunity to win $10. Participants in the imagine condition
were told that the task was at a pilot stage and thus there would be no
money involved. In each group, half of the participants were told that
the forgone choice was correct (narrow loss) while the other half was
told that both choices were wrong (wide loss). Participants were tested
individually.
Participants were asked to arrange the products by price, creating the
two arrangements (one on each shelf) that exemplified their two best
guesses. Next, each participant was asked to choose the arrangement
s/he thought was most likely to be correct. At that point,
participants in the imagine/narrow-loss condition were asked
to report how much regret they would feel if they were to find out
that the chosen arrangement was wrong and the forgone choice was
right. Participants in the imagine/wide-loss condition were
asked the same question but imagining that both options were wrongly
arranged. Participants reported their answers in a sheet of paper by
drawing a slash through a 225 mm line. One end of the line was labeled
“very slightly or not at all” and the other was labeled
“extremely.”
Participants in the experience condition arranged the
products following the same instructions as the imagine
group. After selecting their preferred set, participants in this
group were told to enter the data in the computer to find out whether
they had made the right choice. The reliance on a computer to provide
feedback was intended to minimize suspicions about the feedback
accuracy. Participants’ skepticism was a concern particularly in the
experience-narrow condition, which required participants to
believe the rather unlikely scenario that their choice was wrong but
the forgone option was indeed correct. Participants typed the items in
the same order as they had placed them on the shelves, and clicked the
mouse to identify their preferred choice. After the mouse click, a
message to the right of the arrangements provided feedback. In the
narrow loss condition, the feedback said that the selected
set was incorrect and the forgone set was the correct one. In the
wide loss condition, the message stated that both selected
and forgone sets were wrongly arranged. Immediately after receiving
the feedback, participants were asked to report their feelings of
regret using the same scale as participants in the imagine condition,
as already described.
Card gambling task. Immediately after completing the
regret scale, participants completed the Card Gambling task.
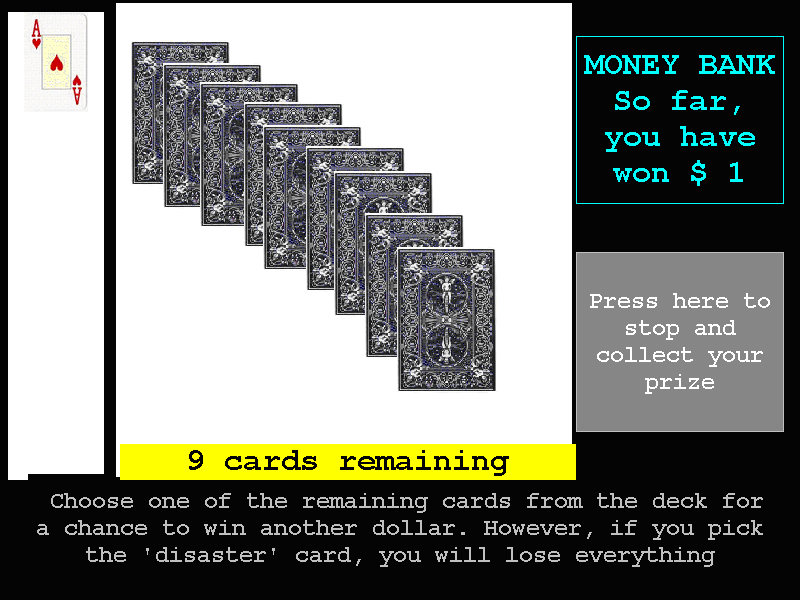
| Figure 1: The stimulus screen following the selection of the first
card. The nine cards remaining appear face down in the middle of the
screen. To the left, the selected card appeared face up. To the
right the amount of money won up to that point was displayed. In the
lower right part of the screen, there was a box where participants
could click after having selected the cards, to stop playing and
collect the prize. In the bottom part of the screen, a yellow banner
reminded participants of the number of cards remaining, below which
were the main instructions for the task. |
Stimuli. The game stimulus screen was identical to that of
our previous studies (Fernandez Duque & Wifall, 2007) (see
Figure 1). Using the mouse, participants played by selecting a face
down card. When a card was selected, one of the good cards was
displayed on the feedback screen for two seconds. The identity of the
cards was fixed to ensure that all participants received the same
feedback.2
Following the feedback screen, an updated version of the stimulus
screen appeared. The updated information included a reduction in the
number of cards available for selection, an increase in the amount of
money won, and the addition of the most recently selected card to the
pile of cards already chosen. These updates occurred each time a card
was selected. Unbeknownst to participants, the game was rigged so that
the disaster card was displayed only when/if the participant turned
the ninth card.
Procedure. At the beginning of the task, participants were
read the following instructions from the computer screen:
In the deck there are 10 cards. Nine cards are good and one is bad.
You will win one dollar for each “good” card you turn but if you
turn the bad card you will lose everything and the game will end. You
will get to keep whatever money you win, so try to play as well as
possible. Choose one card at a time by clicking on it.
Participants were asked to decide how many cards to turn before
beginning to select which cards to turn. The instructions were read
out-loud from the stimulus screen by the experimenter, asking:
How many cards would you like to turn over before stopping? You don’t
need to decide at this point “which” cards you will choose, but you
do need to decide how many you will turn.
After reporting how many cards they would like to turn, participants
selected which cards they wanted turned, by clicking on them. After
completing this initial bet, participants were given the option to stop
and collect their money or turn another card for the opportunity to win
an extra dollar. This decision to stop or continue was the main
dependent variable in the task.
At the end of the session, participants completed a debriefing form
reporting whether they believed that money would be awarded in the
game/s and that the games were not rigged. They also reported whether
they thought the pricing task had influenced their decision on the card
task. Finally, participants were debriefed and paid the money they had
won.
3 Results
Twelve participants in experience-narrow condition reported
not believing some aspect of the instructions when debriefed at the
end of the session (i.e., they thought that one or both games were
rigged and/or that money would not be awarded). In contrast, only
three of the participants who experienced a loss by a wide margin were
skeptical about the instructions. Thus, experiencing a loss by a
narrow margin led to greater skepticism about the instructions than
the other conditions, χ2 (1, N = 92) = 5.3,
p = .02.3 Furthermore,
participants who were skeptical after experiencing a narrow loss
reported less regret than those who believed such an outcome
(Mskeptics = 95; Mbelievers = 145),
t(28) = .025 (CI: 6.6 - 93.7). For these reasons,
data from skeptical participants were excluded from the analyses.
Self-report measure: Amount of regret reported. Data from
the remaining 69 participants (43 females) were analyzed in a 2 x 2
design with Game Style (Imagined, Experienced) and Margin of Loss
(Narrow, Wide) as between-participants factors (see Table
1).4
| Table 1: Self-reported regret, number of cards initially chosen, and
percentage of participants who declined turning an extra card, as a
function of condition in the “Price Is Right
task”. Standard deviations appear in parentheses. |
| Condition | n | Self-reported regreta | Cards chosen | Declined extra card |
| Imagine Narrow | 19b | 104.37 (48.37) | 5.37 (1.21) | 33.33% |
| Experience Narrow | 18b | 145.50 (52.29) | 5.22 (1.11) | 77.78% |
| Imagine Wide | 16b | 169.31 (36.77) | 5.13 (1.26) | 53.33% |
| Experience Wide | 16b | 166.12 (40.45) | 5.31 (1.20) | 50.00% |
| a Scale ranged from 0 to 225 millimeters. |
| b One participant in this group initially chose 9
cards and therefore was not asked whether to turn an extra card. |
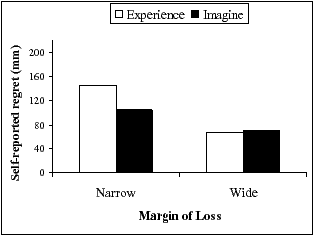
| Figure 2: Self-reported regret in a 225 mm line, as a function of
participants’ game style and margin of loss. |
Participants reported more regret following a narrow margin of loss than
a wide margin of loss, F(1, 65) = 27.3, p
< .001. This is consistent with the idea that
regret stems from counterfactual thinking: in losing by a narrow
margin, the person is aware that s/he could have won had s/he selected
the forgone choice. More interestingly, the effect of margin of loss
interacted with the game style, F(1, 65) = 4.1, p =
.05. (See Figure 2.) In particular, participants who
experienced a narrow loss reported more regret than those who
imagined such a loss, t(35) = 2.48, p = .02,
(CI: 7.5–74.7).5 In contrast, losing by a wide margin led to
similarly low levels of regret across the experience and
imagine conditions, t(30) = .8, ns. This
makes sense, as participants in the wide margin of loss conditions were
told that the forgone choice would have also led to a loss. Therefore,
there was no reason for these participants to regret the choice they
had made.
Participants in the imagine groups were told upfront that the
feedback was going to be hypothetical and that they would not be
playing “for real.” Those instructions aimed to prevent actual
regret from influencing participants’ behavior in the subsequent task.
Nonetheless, the instructions may have dampened participants’ ability
or motivation to simulate their future emotions. To test this
alternative hypothesis, a new batch of participants was run in the
imagine-narrow condition. These participants were engaged in
the task as actual contestants, except they had to forecast
their feelings. Even with this procedure, forecasted regret of a
narrow loss (M = 86.67, SD = 39.9) was lower than
experienced regret (M = 145.50), t(25) = 2.96,
p = .007.
Behavioral measure: Declining to turn an extra
card. Two of the 69 participants were excluded from analysis on this
variable because they chose to turn nine cards, thus hitting the
disaster card. Therefore, the question of whether they wanted to
continue did not apply to them. Of the remaining 67 participants,
46.3% decided to continue risking once the initial goal was reached.
In other words, these participants chose to engage in a bet that they
most likely would have come to regret if it turned bad. On the other
hand, 53.7% of participants preferred to stop, thus avoiding the
possibility of future regret.
Was the decision to stop gambling influenced by the
conditions in the previous task? One might expect that after
experiencing a loss by a narrow margin, people will be reluctant to put
themselves in a position that could lead them to experience more
regret. To examine this hypothesis, we ran a chi square analysis on the
decision to take an extra card by the four conditions of the preceding
task (experience-narrow, experience-wide, imagine-narrow,
imagine-wide). The analysis revealed a marginally significant effect,
χ2 (3, N = 67) = 7.3, p = .06. To
explore the source of this effect, we ran follow-up chi square tests
for each level of Margin of Loss. As predicted, when the margin of loss
was narrow, participants who experienced the loss were more
reluctant to continue gambling than those who merely imagined
the loss, χ2 (1, N = 36) = 7.2, p =
.007. When the loss was by a wide margin, the decision to continue
gambling did not vary between those who experienced and those
who imagined the loss (see Figure 3).
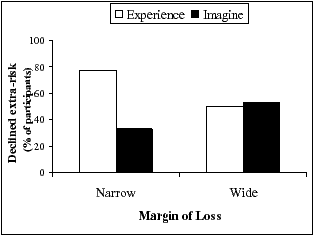
| Figure 3: Percentage of participants who declined to turn an
extra card in the Card task as a function of game style and margin of
loss in the Pricing task. |
The risk of turning an extra card is a function of the number of cards
initially chosen: turning an extra card is relatively safe after an
initial bet of 4 cards, but much riskier after a bet of 8. Thus, the
reluctance to turn an extra card after experiencing a narrow loss might
have been an artifact of unusually high initial bets in the
experience-narrow group. To rule out this alternative interpretation,
we ran an analysis of variance on the initial bets, with Game Style
(imagine, experience) and Margin of Loss (narrow, wide) as the
between-subjects factors. This ANOVA revealed no significant effects
(ps > .3). Furthermore, the overall
initial bet was similar to that of another study in which participants
only did the Card task [Current study: 5.26 cards (SD: 1.17);
without Pricing task: 5.38 cards (SD: 1.02)] (Fernandez Duque
& Brown, 2008). Thus, it seems that the Price Is Right Task
had little or no impact on the initial bet of the Card task. Therefore,
differences in the initial bet cannot account for the cautious behavior
that followed the experience of a narrow margin loss.
Was the reluctance to turn an extra card linked to the
regret elicited by the preceding task?
This question asks about the correlation between self-reported regret in
the Pricing task and rejection of an extra card in the Gambling task as
a function of the experimental manipulation. The idea is that
regret (as measured by self-report after a narrow loss in the Pricing
task) will make participants more reluctant to engage in a bet that
they would come to regret if it turns bad.
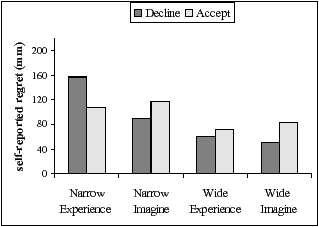
| Figure 4: Self-reported regret in the Pricing task as a function of its
game style, margin of loss, and whether the option to turn an extra
card in the Card task was accepted or declined. |
To test this hypothesis, we examined self-reported regret in the Pricing
task as a function of whether participants declined to turn the extra
card in the Gambling task. More precisely, we used
self-reported regret in the Pricing task as the dependent
variable for an ANOVA with three between-subjects factors: Decision
about the Extra Card (Decline, Continue), Game Style (experience,
imagine), and Margin of Loss (narrow, wide). This analysis revealed a
3-way interaction, F(1, 59) = 4.9, p = .03. (See
Figure 4.) To explore that interaction, we ran follow-up t-tests in
each of the four conditions of the Game Style x Margin of Loss design.
Each of those t-tests contrasted the self-reported regret of
participants who declined to turn another card to the regret of those
who decided to continue.
These tests revealed that participants who declined an extra card after
experiencing a narrow loss were more regretful of the narrow
loss than participants who took the extra risk, t(8) = 2.3,
p =.05. That is, the t-test revealed a correlation between the
amount of regret experienced and the reluctance to turn another card,
for participants who narrowly missed the prize. In other words,
self-reported regret after experiencing a narrow loss biased
participants toward regret-averse behavior. In sum, for this
experimental condition, the decision to take an extra card was mediated
by the level of regret experienced. The t-tests in each of the other
three groups revealed no significant differences in the level of regret
based on the decision to stop or continue gambling.
Were people aware of the influence that the preceding outcome
had on their future behavior? We asked participants whether “the
outcome of the pricing task influenced your decision in the card
task.” Participants answered on a 5-point scale (1= strongly
disagree; 5 = strongly agree). Participants who experienced a
narrow loss agreed that the outcome influenced their future behavior
to a larger extent than any other group, as revealed by Mann-Whitney
tests comparing the experience-narrow group to each of
the other groups, (MExperience-Narrow = 3.0;
MImagine-Narrow = 1.2; MExperienceWide
= 1.6; MImagine-Wide = 1.6), Zs
> 2.5, ps < .02. Participants who
declined turning an extra card claimed that the previous outcome
influenced their behavior more than those who took the extra risk did
(Mstop = 1.14,
Mcontinue = 0.52), U = 434,
Z = 1.9, p = .06.
4 Discussion
After finding out that they could have won had they chosen differently,
participants in our study reported more regret than was anticipated by
those who were asked to imagine that same scenario. Besides
the increase in self-reported regret, experiencing a loss by a narrow
margin also led participants toward more cautious behavior. In other
words, those who experienced a narrow loss were most likely to decline
the opportunity to turn an extra card in the following task. Having
already suffered one regretful outcome, it seems they were reticent to
risk another one.
Although these findings contradict the ones reported by Gilbert and
collaborators (2004), they are not necessarily incompatible with
affective forecasting theory. To reconcile findings and theory, it is
necessary to focus on a key methodological difference between the
studies: the consolation prize. Participants in Gilbert et al.’s study
were promised a consolation prize if they chose
incorrectly.6 This
small prize may have helped participants to re-conceptualize the loss
as a minor win, thus reducing the amount of regret experienced. In
contrast, no consolation prize was offered to participants in our
study. In the absence of a rationalization argument (e.g., “at least
I won something”), our participants may have found it difficult to
reduce their dissonance. Future studies should explore this
possibility in more detail by systematically varying the presence and
magnitude of the consolation prize.
A second methodological difference between the studies, namely, the
delay in reporting the feelings, points toward the same interpretation.
In the Gilbert et al. study, participants were probed about
their feelings of regret 3 minutes after receiving the outcome. In
contrast, in our study they were probed immediately after the outcome.
Re-conceptualization requires some amount of time, and longer intervals
between outcome and assessment usually lead to less intense emotions.
Whether feelings of regret are so ephemeral that they evaporate in a
delay of 3 minutes remains an open question. The answer might depend,
once again, on whether an alternative interpretation is easily
available for participants to re-conceptualize the outcome.
Opportunities for re-conceptualization may also explain the findings
from naturalistic setting studies (Gilbert et al., 2004, experiment 2).
In other words, a participant who misses the train but gains an
opportunity to earn money answering a brief questionnaire may
re-calibrate how regretful the experience was. On the other hand, there
are important differences between the naturalistic setup and its
experimental counterpart. In the naturalistic set-up, the difference
between a narrow-margin loss and a wide-margin loss runs on a
continuum: one can miss a flight by 5 minutes, 20 minutes or any number
of minutes. In contrast, in the experimental setup there is a
qualitative difference between a narrow margin of loss and a
wide margin of loss. In this context, losing by a narrow margin means
that the forgone choice was correct, while losing by a wide margin
means that the forgone choice was not correct. It remains an open
question whether, when it comes to experienced and imagined regret,
this qualitative difference is akin to the quantitative difference of
naturalistic contexts.
It is also possible that the contrasting findings between our study and
the Gilbert et al. study stemmed in part from improvements we
made to the protocol. For example, we took special care to ensure that
participants believed the instructions. We were most concerned about
participants who were told that they had lost by a narrow margin. Such
feedback required participants to believe the rather unlikely scenario
that their choice was wrong but the forgone option was indeed correct.
We reasoned that this feedback would be more believable if delivered by
a computer program instead of an experimenter. Both experience
groups received feedback by the computer, thus controlling for a
possible influence of computer-based feedback on feelings of regret.
Despite our efforts to minimize the suspicion from our participants,
many became skeptical after experiencing a narrow loss. Fortunately, we
were able to filter out those participants. It is unclear whether the
same was done in the study by Gilbert et al. Another improvement in the
protocol was the method for estimating self-reported regret. Gilbert
and collaborators (2004) measured imagined and
experienced regret relative to baseline levels reported at the
beginning of the session. Furthermore, participants were asked about
their feelings of disappointment at the same time they were
asked about feelings of regret. In contrast, our participants reported
exclusively their feelings of regret and did so only once. Thus, our
approach may have prevented carry-over effects from earlier reports
and/or contamination effects from reports on other feelings.
A potential criticism of our methodology is that participants were not
asked about their feelings of disappointment. As a consequence, they
may have confounded the two emotions when reporting their feelings of
regret. However, when asked about feelings of disappointment, people’s
responses are independent of the margin of loss (Gilbert et al.,
2004). In other words, people are equally disappointed by a narrow or
a wide loss, but are more regretful after a narrow loss (“if
I had selected the other set, I would have won”) than after a loss by
a wide margin (“if I had selected the other set, I would still have
lost”). Therefore, even if the emotional response were a combination
of regret and disappointment, it would remain true that in our study
the emotional reaction experienced in a narrow loss was more intense
than anticipated.
Differences in opinion about the best way to probe feelings of regret
and disappointment point to a larger problem. Namely, are self-report
methodologies well-suited for addressing these questions? In our study,
behavioral evidence was gathered to complement self-reported measures
of regret. Behavioral and self-report measures converged to show that
experiencing a narrow loss causes more regret than imagining it. The
addition of a behavioral measure thus served a dual purpose: it
provided convergent evidence for the self-report measure and in doing
so it validated such self-reports.
The most consistent finding in the affective forecasting literature is
that people overestimate how long their emotions will last. Such a
bias is often expressed as an overestimation of how intense the
feeling would be at later time. Evidence that initial emotional
reactions are overestimated is less abundant, although it has been
reported on occasion (Buehler & McFarland, 2001; Gilbert et al.,
2004; Sevdalis & Harvey, 2007). Accurate forecasting and even of
underestimation of future regret have also been reported (Crawford,
McConnell, Lewis, & Sherman, 2002; Mellers et al., 1999). For
example, people underestimate how much they will regret having
followed bad advice, but overestimate how much regret they will
experience after refusing good advice. The context of the methodology
also seems to play an important role: while naturalistic studies have
consistently shown overestimation of the initial regret response
(Gilbert et al., 2004; Mellers et al., 1999; Sevdalis & Harvey,
2007), experimental studies have yielded a more variable pattern of
results (Crawford et al., 2002; Mellers et al., 1999). Trying to
reconcile the findings from these two traditions is the challenge
ahead of us, and the use of behavioral methods should help in that
endeavor.
References
Buehler, R., & McFarland, C. (2001). Intensity bias in affective
forecasting: The role of temporal focus. Personality and Social
Psychology Bulletin, 27, 1480–1493.
Connolly, T., & Butler, D. (2006). Regret in economic and psychological
theories of choice. Journal of Behavioral Decision Making, 19,
139–154.
Crawford, M. T., McConnell, A. R., Lewis, A. C., & Sherman, S. J.
(2002). Reactance, compliance, and anticipated regret. Journal
of Experimental Social Psychology, 38, 56–63.
Fernandez Duque, D., & Brown, T. (in revision). Actor/observer
asymmetry in gambling: Optimism, reward, or perceived control?
Journal of Behavioral Decision Making.
Fernandez Duque, D., & Wifall, T. (2007). Actor/observer asymmetry in
risky decision making. Judgment and Decision Making, 2, 1–8.
Gilbert, D. T., Morewedge, C. K., Risen, J. L., & Wilson, T. D. (2004).
Looking forward to looking backward: The misprediction of regret.
Psychological Science, 15, 346–350.
Gilbert, D. T., Pinel, E. C., Wilson, T. D., Blumberg, S. J., &
Wheatley, T. P. (1998). Immune neglect: A source of durability bias in
affective forecasting. Journal of Personality and Social
Psychology, 75, 617–638.
Kahneman, D., & Tversky, A. (1982). The psychology of preferences.
Scientific American, 246, 160–173.
Kermer, D. A., Driver Linn, E., Wilson, T. D., & Gilbert, D. T. (2006).
Loss aversion is an affective forecasting error. Psychological
Science, 17, 649–653.
Marcatto, F., & Ferrante, D. (2008). The regret and disappointment
scale: An instrument for assessing regret and disappointment in
decision making. Judgment and Decision Making, 3, 87–99.
Medvec, V. H., Madey, S. F., & Gilovich, T. (1995). When less is more:
Counterfactual thinking and satisfaction among Olympic medalists.
Journal of Personality and Social Psychology, 69, 603–610.
Mellers, B., Schwartz, A., & Ritov, I. (1999). Emotion-based choice.
Journal of Experimental Psychology: General, 128, 332–345.
Robinson, M. D., & Clore, G. L. (2002). Belief and feeling: Evidence
for an accessibility model of emotional self-report.
Psychological Bulletin, 128, 934–960.
Sevdalis, N., & Harvey, N. (2007). Biased forecasting of postdecisional
affect. Psychological Science, 18, 678–681.
Simonson, I. (1992). The influence of anticipating regret and
responsibility on purchase decisions. Journal of Consumer
Research, 19, 105–118.
Slovic, P. (1966). Risk-taking in children: Age and sex differences.
Child Development, 37, 169–176.
Wilson, T. D., & Gilbert, D. T. (2003). Affective forecasting. In M.
Zanna (Ed.), Advances in experimental social psychology (Vol.
35 pp. 345–411). New York: Elsevier.
Zeelenberg, M. (1999). Anticipated regret, expected feedback and
behavioral decision making. Journal of Behavioral Decision
Making, 12, 93–106.
Zeelenberg, M., Nelissen, R., Breugelmans, S.M. & Pieters, R. (2008).
On emotion specificity in decision making: Why feeling is for doing.
Judgment and Decision Making, 3, 18–27.
Zeelenberg, M., van Dujk, W. W., van der Pligt, J., Manstead, A. S. R.,
van Empelen, P., & Reinderman, D. (1998). Emotional reactions to the
outcomes of decisions: The role of counterfactual thought in the
experience of regret and disappointment. Organizational
Behavior and Human Decision Processes, 75, 117–141.
This document was translated from LATEX by
HEVEA.