Age-related differences in adaptive decision making:
Sensitivity to expected value in risky choice
Irwin P. Levin1 Joshua A. Weller, Ashley A. Pederson, and Lyndsay A. Harshman
Department of Psychology
University of Iowa
Judgment and Decision Making, vol. 2, no. 4, August 2007, pp. 225-233.
Abstract
While previous research has found that children make more risky
decisions than their parents, little is known about the developmental
trajectory for the ability to make advantageous decisions. In a sample
of children, 5-11 years old, we administered a new risky decision
making task in which the relative expected value (EV) of the risky and
riskless choice options was varied over trials. Younger children (age
5-7) showed significantly less responsiveness to EV differences than
their parents on both trials involving risky gains and trials involving
risky losses. For older children (age 8-11) this deficit was smaller
overall but was greater on loss trials than on gain trials. Children
of both ages made more risky choices than adults when risky choices
were disadvantageous. We further analyzed these results in terms of
children's ability to utilize probability and outcome
information, and discussed them in terms of developing brain structures
vital for decision making under uncertainty.
Keywords: risky decision making, child-adult differences, reward
sensitivity
1 Introduction
A traditional goal of risky decision making studies has been to
compare the incidence of risky choices between groups or experimental
conditions. One particular group difference of interest is the
decision making ability of children versus adults. In fact, a number
of studies have found that children make more risky choices than
adults (e.g., Harbaugh, Krause, & Vesterlund, 2002; Levin & Hart,
2003; Levin, Hart, Weller, & Harshman, 2007; Reyna & Ellis, 1994;
Schlottmann, 2000). In the typical risky decision making study,
however, the expected value of risky and riskless choice options is
the same (e.g., Tversky & Kahneman, 1981), so there is nothing
inappropriate per se in making risky choices. Yet, excessive
risk-taking has been implicated in real-world problems encountered in
childhood and adolescence (Parker & Fischhoff, 2005). In an attempt
to deal with this important issue, the present study focuses on
age-related differences in the ability to make advantageous decisions
and avoid disadvantageous decisions.
Although the study of risky decision making in children has been
relatively rare, several investigators have developed
"child-friendly" tasks that appear to capture developmental trends
in risky decision making processes (e.g., Harbaugh et al., 2002; Reyna
& Ellis, 1994; Schlottmann, 2000). Thus, they are able to address
questions such as the following: At what age does the assessment of
riskiness develop? At what age do children develop the capacity to
utilize information about risk (probability) and outcome magnitude in
evaluating choice options? Recent studies by Levin and Hart (2003;
Levin, et al., 2007) illustrate these points. Using the "cups" task
in which probability is conveyed simply by the number of cups from
which to choose, these researchers showed that children as young as
age 6 adjusted their choices on the basis of both probability and
outcome information, but they made more risky choices than adults
(their parents).
Levin and Hart's results, like those of earlier related studies, were
confined to the case of equal expected value of choice options. Thus,
for example, a sure gain of one coin was pitted against choosing from
five cups, one of which contained five coins and the others zero.
Although Schlottmann (2000) found that children as young as 5 years of
age have a basic understanding of expected value when evaluating the
riskiness of a particular decision, it is still unclear whether
children actually utilize this information in order to make adaptive
decisions. We test this in the present study by extending the cups
task to include trials where the risky option has higher or lower
expected value than the riskless or "sure thing" option (See Weller,
Levin, Shiv & Bechara, in press, for parallel application of this
methodology to brain-lesion patients). An auxiliary finding of the
Levin and Hart studies was that children's risky choices were less
affected by changes in probability level (number of cups from which to
choose) than were adults'. With equal expected value between choice
options, this result cannot be used to infer decision-making deficits
in children. However, if children can be shown to be less responsive
than adults to expected value differences between choice options, then
a value judgment can be made that children of a certain age have less
developed decision making skills than adults, at least in the area of
risky decision making.
In order to capture this element of disadvantageous or
"non-adaptive" risk taking in a controlled study, we administered a
risky choice task where the relative expected value of risky and
riskless choice options was varied over trials. Some trials had equal
expected value for the two options; some trials had more favorable
expected value for the risky option; and some trials had more
favorable expected value for the riskless option. This allowed us to
gauge performance not only in terms of overall risk taking but also in
terms of sensitivity to differences in expected value between choice
options. We use these measures of performance in a risky decision
making task to differentiate between (a) choices of children of two
different age groups and choices of adults and (b) choices
involving potential gains and choices involving potential losses.
There is some precedence for predicting age-related developments in
decision making competence. In an earlier study related to the
present one in terms of children's reliance on numerical contextual
cues, Jacobs and Potenza (1991) studied base rate neglect in children
of different ages. Children in the first, third, and sixth grades, as
well as college students, were asked questions such as "Which bike
should Jim buy?" When base rate information said that most people
prefer Bike A but individuating information said that Jim's neighbor
prefers Bike B, the researchers report that the use of base rates to
make such choices increased with age and that younger children were
more apt to use idiosyncratic strategies. More examples of children's
decision making competence can be found in the recent book edited by
Jacobs and Klaczynski (2005). In the present study EV is akin to base
rates in that it provides information regarding the relative
likelihood of different events. Thus, the major new contribution of
the present study is to show how children's risky decision making at
two different age levels compares to adults, not only in terms of
overall riskiness, but also in terms of sensitivity to expected value
differences that lead risky choices to be either advantageous or
disadvantageous.
1.1 Hypotheses
Hypothesis 1. Based on the assumption that risk-taking skills develop
during childhood and adolescence (e.g., Jacobs and Potenza, 1991) and
the specific results of Levin and Hart (2003) that children are less
responsive to probability differences in the cups task than adults, we
predict that children, the younger group in particular, will be less
responsive than adults to expected value differences that render the
risky choice more or less advantageous in the long run.
Hypothesis 2. Related to Hypothesis 1 but based on a separation of
factors that contribute to expected value, we predict that the extent
to which risky choices vary as a function of variations in probability
and outcome magnitude will be less for children than for adults.
2 Method
2.1 Participants
Participants were 37 children of age 5-7 (range 62-86 months, mean
72.92, SD 6.44, 17 girls, 20 boys), 43 children of age 8-11 (range
97-134 months, mean 111.61, SD 15.94, 21 girls, 22 boys), and each
child's accompanying parent (53 mothers, 12 fathers; 11 were parents
of two children in the study and 2 were parents of three children in
the study). Participants were recruited from the child research
participant pool at the University of Iowa Department of Psychology.
Each child-parent pair was paid $15 plus what they earned in the
decision making task.
2.2 Procedure
To assess individuals' decision propensities under risk, we used a
computerized version of Levin and Hart's (2003) cups task (Weller et
al., in press). The cups task was originally designed to provide a
simple and direct way of depicting probability by merely counting the
number of cups from which to choose in risky decision making (Levin &
Hart, 2003). For example, the risky option might require a choice
between three cups, one of which contains coins and the other two not.
The current extension included manipulation within-participants of the
relative EV of the risky and riskless options, which allows the
examination of a decision maker's sensitivity to contingencies that
make the risky choice advantageous or disadvantageous in the long run.
We are particularly interested in how children of different ages
compare to adults (parents) on this measure, examined separately for
risky choices involving potential gains and potential losses.
The cups task consisted of 54 trials representing 3 trials each of all
combinations of 2 levels of domain (gain, loss), 3 levels of
probability (.20, .33, or .50) and 3 levels of outcome magnitude for
the risky option (2, 3, or 5 quarters) compared to 1 quarter for the
riskless option. Some combinations of probability and magnitude
created equal EV for the risky and riskless options: .20 x 5, .33 x 3,
and .50 x 2 on both gain and loss trials. Some combinations were
risk-advantageous in the sense that the EV for the risky option was
more positive (on gain trials) or less negative (on loss trials) than
the sure gain or loss of one coin: .33 x 5, .50 x 3, .50 x 5 on gain
trials; .20 x 2, .20 x 3, .33 x 2 on loss trials. Some combinations
were risk-disadvantageous in the sense that the EV for the risky
option was less positive or more negative than the sure gain or
loss: .20 x 2, .20 x 3, .33 x 2 on gain trials; .33 x 5, .50 x 3, .50
x 5 on loss trials. Gain and loss trials were presented as blocks,
counterbalanced in order across participants in each group. Within a
block of gain or loss trials, probability and outcome combinations
were presented in random order and the left-right position of riskless
and risky options was also randomized.
All participants were individually tested during a 20 minute session.
Parents independently completed the exact same task as the children
and were given the same instructions verbatim. The task performed by
both parent and child was administered using a computer game
specifically designed for this experiment. The computer task was
presented as a game of chance in which participants could win or lose
quarters which were displayed on the computer screen. To help
simulate the effects of using real money, participants were informed
that based on the final score on the computer game, they would receive
actual monetary compensation determined by a points-based pay scale.
Gain trials involved the choice between an option that offered a sure
gain of one quarter and another option that offered a designated
probability of winning multiple quarters or no quarters. Loss trials
involved the choice between a sure loss of one quarter and a
designated probability of losing multiple quarters or no quarters.
Participants started the block of loss trials with enough quarters in
the bank to ensure that they would not end up with a losing total. On
each trial, an array of 2, 3, or 5 cups was shown on each side of the
screen. One array was identified as the certain side where one
quarter would be gained (lost) for whichever cup was selected. The
other array was identified as the risky side where the selection of
one cup would lead to a designated number of quarters gained (lost)
and the other cups would lead to no gain (loss). At the bottom of the
screen was a depiction of a bank where coins were shown being added to
(subtracted from) the decision maker's account. The outcome on each
trial depended on which side was selected and, if it was the risky
side, the choice of one cup determined whether quarters were added
(taken away). A random process with p = 1/(number of cups)
determined whether the risky choice led to a gain (loss). When the
participant completed all 54 trials, their total amount won appeared
on the screen. Participants were compensated based on the money that
they won on the task.
2.3 Statistical plan
Our research design allowed two levels of analysis of decision making
under risk. First, to measure how participants adapted to differences
in EV between riskless and risky options, we calculated the percentage
of risky choices at each of the three EV levels: risk advantageous
trials (RA; the EV of the risky choice was more favorable than that of
the riskless choice), equal EV trials (EQEV; the EVs for the riskless
and risky option were equal), and risk disadvantageous trials (RD; the
EV was more favorable for the riskless option than the risky option).
These measures were computed separately for the gain and loss domain
and are particularly important for identifying when children's
decisions are less advantageous/more disadvantageous than adults.
Second, because we factorially manipulated probability level and
outcome magnitude level for the risky option in each domain, we were
able to assess how each of these components of EV independently
affected risky choice. This is particularly important for
understanding children's ability to utilize these two sources of
information.
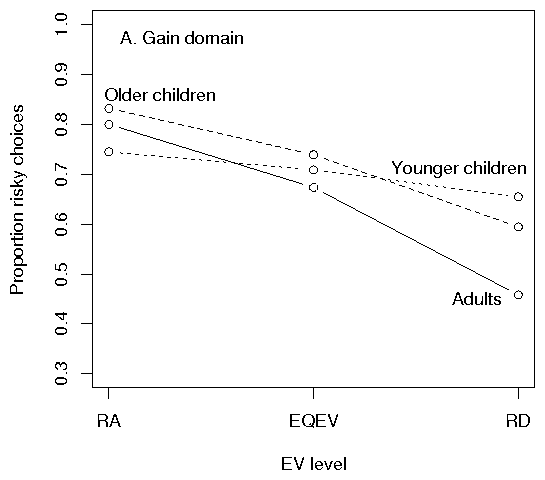
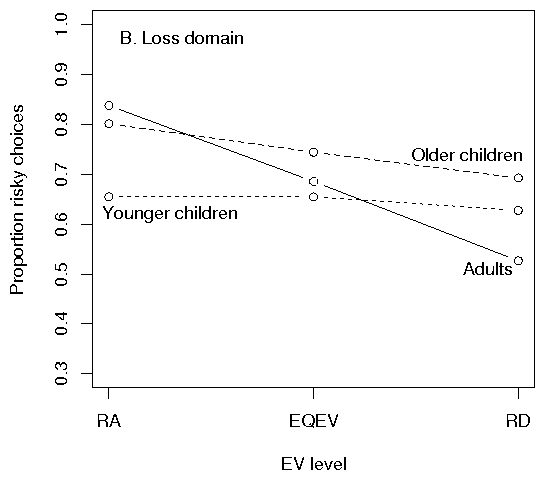
Figure 1: Adaptive decision making as a function of age, domain, and
EV level. RA = Risk Advantageous trials. EQEV = Equal Expected
Value trials. RD = Risk Disadvantageous trials.
3 Results
3.1 Adaptive risky decision making
Figure 1 displays the proportion of risky choices for each child age
group and adults as a function of EV level, plotted in separate
panels for gain trials and loss trials. The elevation of lines in
each panel represents level of risk-taking, the slopes of the lines
represent responsiveness to expected value differences, and the
differences between the two panels represent domain (gain vs. loss)
effects. The major trends observed in Figure 1 are: (1) Consistent
with Hypothesis 1, younger children were substantially less responsive
than their parents to expected value differences on both gain and loss
trials, with the net result being a much smaller difference in the
proportion of risks taken on risk advantageous versus risk
disadvantageous trials by the children; (2) also consistent with
Hypothesis 1 but with domain-specific effects, the older children
displayed results intermediate between those of younger children and
adults. While they showed approximately the same sensitivity to EV
differences as their parents on gain trials, they showed much less
responsiveness to EV differences on loss trials. (3) In terms of
overall risk-taking, we observed that older children made more risky
choices than their parents. In contrast, we did not find that younger
children's overall risk taking was greater than either their parents
or older children. However, children of both age groups were
especially apt to make more risky choices than their parents on trials
in which it was disadvantageous in the long run to take a risk. (4)
Only adults displayed the classic preference shift (Tversky &
Kahneman, 1981) of more risky choices to avoid a loss than to achieve
a gain across all EV levels.
Table 1: Summary of analysis of variance tests for responsiveness to
EV differences
| Source | df | SS | F | Significance |
|
Age group | 2, 142 | 0.66 | 1.64 | .197 |
| EV level | 2, 284 | 4.77 | 57.01 | < .001 |
| Domain | 1, 142 | 0.00 | 0.13 | .910 |
| Group x EV | 4, 284 | 1.85 | 11.03 | < .001 |
| Group x Domain | 2, 142 | 0.41 | 2.54 | .083 |
| EV x Domain | 2, 284 | 0.21 | 3.57 | .030 |
| Group x EV x Domain | 4, 284 | 0.09 | 0.73 | .575 |
|
|
An ANOVA was conducted to support these observations where the factors
were age group (younger children, older children, adults), EV level
(RA vs. EQEV vs. RD trials), and gain/loss domain. Results are
summarized in Table 1. The most important age-related results were a
significant interaction (p < .001) between age group and EV
level, and an interaction between age group and domain that approached
significance (p < .10). Several specific contrasts were
conducted to follow up these results. The age group by EV level
interaction was broken down into the following four independent
contrasts: younger children vs. adults on gain trials, younger
children vs. adults on loss trials, older children vs. adults on
gain trials, older children vs. adults on loss trials. A Bonferroni
correction was applied and thus significance level was adjusted to
p < .01. Younger children were significantly less
responsive to differences in relative EV between options than adults
on both gain and loss trials, F(2,202) = 10.60 and 10.41,
p < .001 for the gain and loss domain, respectively.
Older children were significantly less responsive to EV level than
adults on loss trials, F(2, 212) = 6.68,
p < .01, but not on gain trials, F(2, 212) = 1.99, p=.14.
Furthermore, irrespective of domain, younger children were not only
more likely to take risks than their parents when it was
disadvantageous to do so (RD trials), t(100) = 2.94,
p < .01, but they were also less likely to take risks when it
was advantageous to do so (RA trials), t(100) = -2.62,
p < .01. Older children took significantly more risks on RD
trials than their parents t(106)=2.85, p < .01 but
there was no significant difference on RA trials,
t(106)=-.30, p=.76.
3.2 Preference shifts
With respect to domain-specific differences in risk-preference, we
conducted three parallel paired-samples t-tests to examine the
preference shift in children and adults. Indeed, we found that adults
exhibited the traditional pattern of more risk-taking in losses
(M=17.32, SD=6.31) than in gains (M=18.5, SD=6.44,t(64) = 1.73, p < .05, one-tailed). In contrast, neither child group showed
such an effect, t(36) = 1.36 and t(42) = .73, ns, for younger and
older children, respectively.
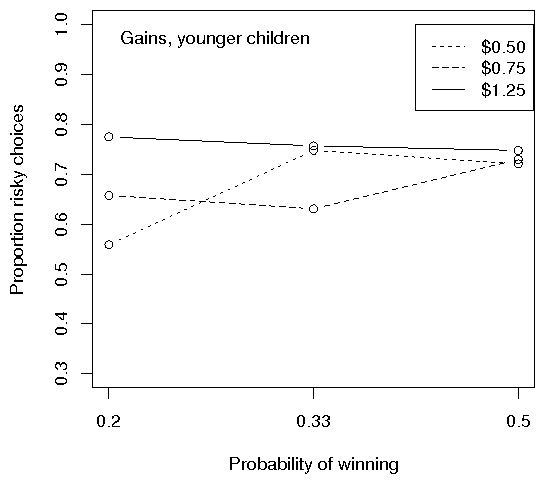
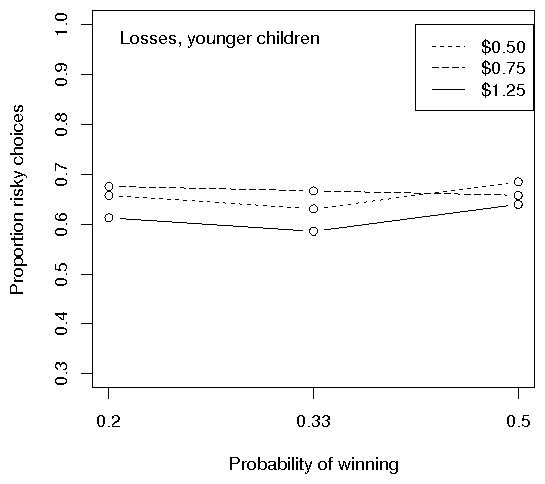
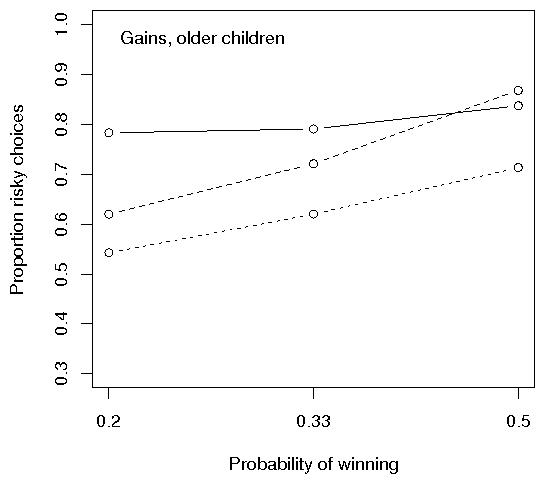
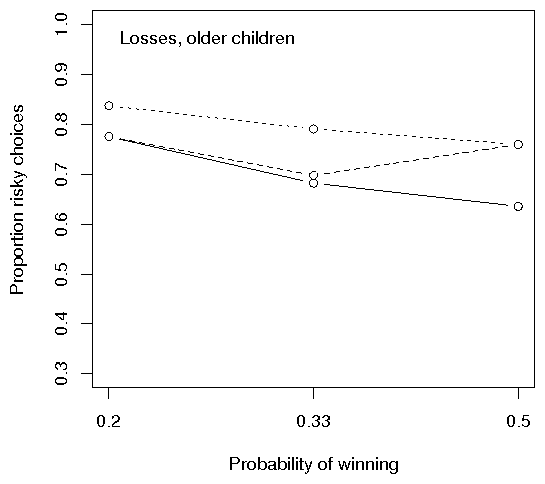
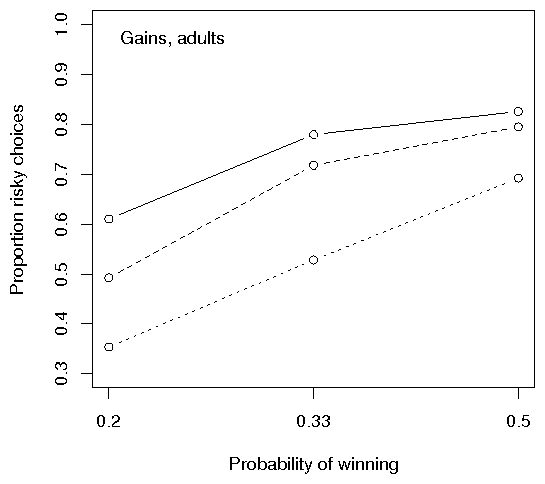
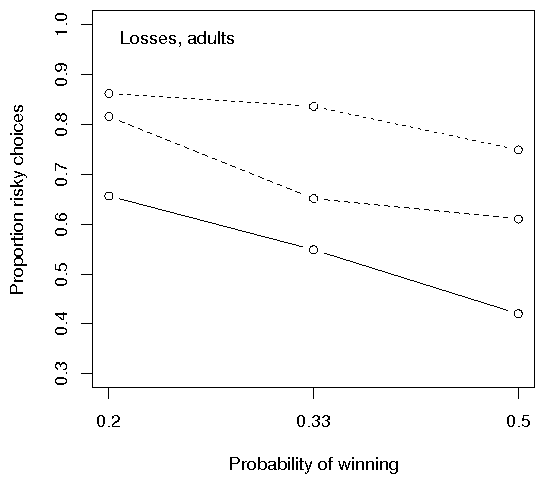
Figure 2: Risk taking as a function of outcome, probability level, and
age group.
3.3 Responsiveness to probability and outcome information
Age-related differences in response to EV variations were further
broken down into the independent effects of probability and outcome
information. The factorial manipulation of probability level and
outcome magnitude within each domain for each age group allowed us to
examine risk taking as a function of probability
level (.50, .33, .20), outcome magnitude (2, 3, or 5 quarters at stake
with a risky choice), and gain/loss domain. These results, summarized
in Figure 2, are supportive of H2. As plotted in Figure 2, risk
taking on gain trials should increase with increasing probability and
increasing outcome magnitude. Conversely, risk taking on loss trials
should decrease with increasing probability and increasing outcome
magnitude which in this case is negative. The slopes and separation
of lines in each panel display the size of these effects for each age
group-domain combination.
We start with the adults because they represent the "baseline"
comparison for the children. As expected, adults show large effects
of probability and outcome magnitude on both gain and loss trials.
However, their responses do not conform exactly to the patterns
predicted by the normative multiplicative model of
probability-by-outcome (assuming that proportion of risky choices
depends linearly on the EV of that choice). This model predicts a fan
of lines that diverge upward to the right in the case of gains and
diverge downward to the right in the case of losses (Anderson, 1991).
Only the loss pattern conforms.
The panels for the younger children show an irregular pattern. On
gain trials the children made the most risky choices when the amount
to be won was greatest and on loss trials they made the least risky
choices when the amount to be lost was greatest. As a group, however,
they were clearly not responsive to differences in
probability level. Consistent with our earlier analyses, the older
children were like adults on gain trials, displaying differences in
risk taking as a function of both probability and outcome magnitude.
On loss trials they were like adults in responding to extreme
outcomes, but showed irregular responding to the intermediate outcome
level.
Table 2: Mean regression weights predicting risky choices as a
function of age group, probability level, and outcome
magnitude.
| Source | Mean | Standard |
|
| coefficient1 | error |
|
|
|
Younger children | | |
|
Probability | .023 | .011 |
| Outcome | .030 | .014 |
|
Older children | | |
|
Probability | .049 | .011 |
| Outcome | .056 | .010 |
|
Adults | | |
|
Probability | .095 | .015 |
| Outcome | .066 | .010 |
|
|
|
Younger children | | |
|
Probability | -.002 | .011 |
| Outcome | .017 | .013 |
|
Older children | | |
|
Probability | .027 | .011 |
| Outcome | .031 | .011 |
|
Adults | | |
|
Probability | .060 | .015 |
| Outcome | .089 | .012 |
|
|
For each participant, we regressed risky choice (1 or 0) against outcome
and probability of winning, separately for gains and losses.
(Actually, instead of probability, we used its reciprocal, the number
of cups, which provided a slightly better fit.) Note that we are not
carrying out significance tests on individual participants. Rather, we
are examining these regression coefficients, which simply represent
the effect of each variable on the proportion of risky choices for
each participant. The independent variables were orthogonal.
Table 2 provides results, means and standard deviations, for the
analyses. Upon inspection of this table, one can see several
interesting trends. In the gain domain, adults, as expected, were able
to adjust their choices based on variations of both probability and
outcome magnitude. Older children also displayed sensitivity to these
contextual cues, albeit to a lesser degree than adults,
and younger children used the cues even less.
Younger children did not systematically use
probability or outcome magnitude when trying to avoid a loss.
In the light of these findings, we tested the degree of consistency in
responses for children and adults. Children, especially the younger
children, were less consistent overall. In particular, children were
more likely to violate dominance. For example, if a participant
chooses the gamble (in gains) for 2 cups and 2 quarters, but does not
choose it for 2 cups and 3 quarters, that is a violation. The percent
of violations (out of the possible violations that could occur) in the
gains domain were 16%, 11% and 8% for younger children, older
children, and adults, respectively. The respective percents for
losses were 16%, 12% and 8%. All age differences were highly
significant.
Moreover, the lack of consistency did not result at all from
across-participant variability in the relative weights of probability and
outcome. If anything, adults were more variable than children in the
within-participant difference between the weight of probability and that
of outcome, but the differences in variability were small.
Taking all the analyses together, these results demonstrate that the
younger children were the most impaired in their risky decision
making. They were the group least responsive to EV differences
between risky and riskless choice options. At a more microscopic
level, the younger children were the least responsive to changes in
the components of EV, especially in probability level. This occurred
both on those trials in which a risky choice could lead to a substantial
loss and those trials where a risky choice had a high probability of
zero gain. For older children, results were mixed. They were clearly
responsive to EV differences and probability and outcome magnitude
differences on gain trials. Nevertheless, when coupled with overall
greater risk-taking, the result was that these children still made
more risky choices than adults on risk-disadvantageous gain trials.
It was in the domain of losses, however, where the responses of this
group particularly deviated from those of their parents. The extent
to which older children adjusted their risky choices based on EV
differences was much less than their parents' adjustments.
While older children showed evidence of a more refined decision
strategy compared to their younger counterparts, both groups of
children made substantially more than 50% risky choices even when it
was disadvantageous to do so.
4 Discussion
The major contribution of this study is to directly test for
age-related differences in the ability to make choices which take into
account differences in expected value between choice options. Through
our methodology, we uncovered differences between the way children of
different ages and adults react to risky decision making. While the
task was presented as a game of chance using "house money" and
consequently there may have been a premium on making risky choices
(see Levin et al., 2007), we nevertheless found that adults and older
children made more risky choices when it was advantageous to do so
than when it was disadvantageous.
As expected, adults were the most able to adjust their risk-taking
based on EV differences between choice options in both gain and loss
domains while the youngest age group was the least able to do this.
Older children demonstrated an intermediate level of adaptive decision
making. Specifically, older children displayed a sensitivity to EV
differences in the gain domain, but much less so in the loss domain.
On the basis of earlier studies, the current authors (Levin, et al.,
2007) and others (e.g., Harbaugh, et al., 2002; Reyna & Ellis, 1994;
Rice, 1995; Schlottmann & Tring, 2005) concluded that young children
possess the basic understanding and ability to consider both
probability and outcome information in making risky choices. However,
earlier studies did not require decision makers to discriminate
between situations in which in the long run it was advantageous or
disadvantageous to make risky choices. Present results, related to the
earlier finding that children were less responsive than adults to
changes in probability (Levin & Hart, 2003), clearly show that
younger children are less able than adults to use probability
information to discriminate between advantageous and disadvantageous
risky choices.
These results seem to suggest a continuum from nonsystematic to
systematic responding to the components of risky choice across age
groups. The risk taking of adults, who were benchmarks for assessing
children's decision making, clearly depended on the relative expected value
of choice options and the components of EV, probability and outcome
magnitude. At the other extreme, younger children showed signs of
responding on the basis of an overall preference for risk, with only
slight adjustment to the particular circumstances of any single risky
choice even when the probability of an unfavorable outcome was great.
What appears to be the case is that children and adults respond to a
risky choice on the basis of an underlying attitude to seek or avoid
risks which is probably primarily emotional in nature, and then adjust
employing a computational process operating on probabilities and
outcomes. Age-related maturation clearly affects the computational
component. Results with the older children reveal the possibility that
this maturation may occur at different rates for dealing with risky gains
and risky losses.
Such findings concerning age-related differences in adaptive decision
making can add to research in developmental neuropsychology which
suggests that during childhood and adolescence there are pronounced
changes in patterns of decision making which may be heavily influenced by
affective processes, especially the ability to anticipate the future
consequences of one's actions (Crone, Vendel, & Van der Molen, 2003).
Researchers have associated these changes with functional maturation
of the prefrontal cortex, which is presumed to be the latest to
functionally mature (Luna & Sweeney, 2001). With such immaturity
comes less ability for affective control (mediated by the ventromedial
prefrontal cortex or VMPC), which may lead to impaired decision making
(Bechara, Damasio, Damasio, & Lee, 1999). In fact, Weller et al. (in
press) found that individuals with bilateral VMPC lesions, much like
the younger children in the present study, demonstrated a pattern of
non-adaptive decision making, taking risks without regards to EV
differences in both the gain and loss domain of the cups task. Future
research may be able to track how different stages of neural
development separately impact the emotional and cognitive components
of adaptive decision making.
Additionally, our results reinforce research from a variety of areas
which strongly suggests that negative information and positive
information involve different processing resources (for a review, see
Baumeister, Bratslavsky, Finkenauer, & Vohs, 2001). Our finding that
both child groups performed sub-optimally in the loss domain even when
older children showed signs of adult-like sensitivities in the gain
domain may indicate that risk seeking in the loss domain is an early
learned decision strategy (see Reyna, 1996). There are, however, situations in
everyday life in which the sacrifice incurred by a sure but small loss
benefits the decision maker in the long run by avoiding even larger
losses. We propose that these types of decisions, like those on RD loss
trials in the current study, especially rely on the ability of the
individual to control an emotional reaction towards a decision
involving a possible loss. For this to occur, the ventromedial
prefrontal cortex must be mature and intact.
So, are children of the ages studied here poor decision makers when it
comes to choices involving risk? It depends. In activities in which
parents and teachers are likely to provide positive reinforcements
such as trying out for sports teams or musical performances, the
child's natural tendency to take risks will likely be welcome. By
contrast, insensitivity to risk levels for activities with potential
dire consequences such as excessive thrill-seeking or experimenting
with dangerous substances may be especially worrisome with children.
References
Anderson, N.H. (1991). Contributions to information integration theory:
Vol. 1. Cognition. Hillsdale, NJ: Erlbaum.
Baumeister, R.F., Bratslavsky, E., Finkenauer, C. & Vohs, K.D. (2001).
Bad is stronger than good. Review of General Psychology, 5,
323-370.
Bechara, A., Damasio, H., Damasio, A. R., Lee, G. P. (1999).
Different contributions of the human amygdala and ventromedial
prefrontal cortex to decision-making. Journal of
Neuroscience. 19, 5473-5481.
Crone, E. A., Vendel, I., & Van der Molen, M. W. (2003).
Decision-making in disinhibited adolescents and adults: insensitivity
to future consequences or driven by immediate reward?
Personality and Individual Differences, 35(7), 1625-1641.
Harbaugh, W. T., Krause, K., & Vesterlund, L. (2002). Risk attitudes
of children and adults: Choices over small and large probability gains
and losses. Experimental Economics, 5, 53-84.
Jacobs, J. E.,& Klaczynski, P. A. (Eds). (2005). The
development of judgment and decision making in children and
adolescents. Mahwah, NJ: Lawrence Erlbaum Associates Publishers.
Jacobs, J. E., & Potenza, M. (1991). The use of judgment heuristics to
make social and object decisions: A developmental perspective.
Child Development, 62, 166-178.
Levin, I. P., & Hart, S. S. (2003). Risk preferences in young
children: Early evidence of individual differences in reaction to
potential gains and losses. Journal of Behavioral Decision
Making, 16, 397-413.
Levin, I. P., Hart, S. S., Weller, J. A., & Harshman, L. A. (2007).
Stability of choices in a risky decision making ask: A 3-year
longitudinal study with children and adults. Journal of
Behavioral Decision Making, 20, 241-252.
Luna, B., & Sweeney, J. A. (2001). Studies of brain and cognitive
maturation through childhood and adolescence: A strategy for testing
neurodevelopmental hypotheses. Schizophrenia Bulletin, 27,
443-455.
Parker, A. M., & Fischhoff, B. (2005). Decision-making competence:
External validation through an individual-differences approach.
Journal of Behavioral Decision Making, 18, 1-27.
Reyna, V. F. (1996). Conceptions of memory development with
implications for reasoning and decision making. Annals of
Child Development, 12, 87-118.
Reyna, V. F., & Ellis, S. C. (1994). Fuzzy-Trace Theory and framing
effects in children's risky decision making.
Psychological Science, 5, 275-279.
Rice, C. (1995). The Effects of Outcome Attractiveness and
Framing on Children's Risky Decision Making.
Unpublished masters thesis, University of Arizona, Tucson.
Schlottmann, A. (2000). Children's judgments of
gambles. Journal of Behavioral Decision Making, 13, 77-89.
Schlottmann, A., & Tring, J. (2005). How children reason about gains
and losses: Framing effects in judgment and choice. Swiss
Journal of Psychology, 64, 153-171.
Tversky, A., & Kahneman, D. (1981). The framing of decisions and the
psychology of choice. Science, 211, 453-458.
Weller, J. A., Levin, I. P., Shiv, B., & Bechara, A. (in press); Neural
correlates of adaptive decision making in risky gains and
losses. Psychological Science, forthcoming.
Footnotes:
1This research was supported by NSF Grant Nos. SES 02-17620 and SES
03-50984 awarded to the first author. The authors would like to thank
Antoine Bechara for his insights on neural development related to
decision-making competence. Correspondence regarding this manuscript
should be directed to Irwin P. Levin, Department of Psychology,
University of Iowa, E11 Seashore Hall, Iowa City, IA 52242-1407,
irwin-levin@uiowa.edu, (319) 335-2451 or Joshua Weller, Decision
Research, 1201 Oak Street, Eugene, OR 97401,
jweller@decisionresearch.org, (541) 485-2400.
File translated from
TEX
by
TTH,
version 3.74.
On 25 Aug 2007, 11:48.