Judgment and Decision Making, Vol. 17, No. 5, September 2022, pp. 1072-1093
Voting under time pressureCarlos Alós-Ferrer* Michele Garagnani# |
Abstract: In a controlled laboratory experiment we investigate whether time pressure influences voting decisions, and in particular the degree of strategic (insincere) voting. We find that participants under time constraints are more sincere when using the widely-employed Plurality Voting method. That is, time pressure might reduce strategic voting and hence misrepresentation of preferences. However, there are no effects for Approval Voting, in line with arguments that this method provides no incentives for strategic voting.
Keywords: voting, time pressure, sincerity, approval voting
Many real-world elections are based on Plurality Voting (PV), where voters are asked to report only their most-preferred alternative, i.e., the maximum of their respective preferences, hence disregarding all other information contained in those preferences. However, an extensive theoretical and empirical literature has put forward a variety of alternative methods and investigated their virtues and vices, and in particular their possible advantages against PV (e.g., Riker, 1988). In particular, it has been frequently argued that strategic voting, where voters cast votes contrary to their actual preferences, might be widespread under PV, e.g., because voting for the own most-preferred alternative might lead to a “wasted vote” if that alternative is unlikely to win.
Among all other voting methods discussed in the literature, one in particular has been argued to entail no incentives for strategic voting. This is Approval Voting (AV), where each voter is allowed to vote for (or “approve of”) as many alternatives as wished (BramsFishburn, 1978). This latter voting method requires that voters reveal which alternatives are acceptable, i.e., each voter needs only to report the alternatives she approves of. The alternative with the highest number of approvals then becomes the winner of the election.1 Hence, even if the most-preferred alternative is unlikely to win, there is no reason not to approve of it, since this approval does not detract from other approvals.2 In other words, decisions under AV should involve few deliberative considerations and be reasonably easy, leading to sincere behavior (which is defined as approving of every alternative which is preferred to another approved alternative).
AV is also interesting for a number of other reasons. For instance, empirical work suggests that AV might reduce biases toward one’s own group to the detriment of others (parochialism; Baron et al., 2005), it might facilitate the selection of compromises (Alós-FerrerBuckenmaier, 2021), and it might be robust to distortions as those arising from framing (e.g., Alós-Ferrer et al., 2021).
To study sincere and strategic voting in PV and AV, we investigated how time pressure affects voting behavior, and in particular sincerity. We tested the hypothesis that time pressure reduces strategic voting, leading to a larger share of sincere votes. This prediction follows from dual-process models of reflective and intuitive thinking (e.g., Sloman, 1996,Kahneman, 2003,Evans, 2008,Alós-FerrerStrack, 2014). Strategic voting dictates to avoid the most-preferred option and consider instead how the own choice influences the actual result taking into account others’ likely decisions. This is a resource-consuming, slow, deliberative decision process. If a decision maker is under pressure to decide quickly, the reliance on such deliberative processes should be reduced in favor of more automatic (and hence quicker) ways of deciding. Thus, we expected that decision makers would vote less strategically under time pressure for PV, under which strategic considerations play a substantial role. In contrast, if AV eliminates incentives to vote strategically, decisions using this voting method should not be significantly affected by the time-pressure manipulation.
The results of our experimental study were as expected. We found that time pressure reduces strategic voting under Plurality Voting, but not under Approval Voting. This conclusion is robust to the method used to measure sincerity (induced or elicited preferences).
Generally, studies investigating the effects of time pressure on decision making have shown that individuals often switch to simpler, less cognitively demanding decision strategies or heuristics when time is limited or costly (Svenson et al., 1990,Payne et al., 1996,DharNowlis, 1999). A number of works have examined how time pressure affects truth-telling in non-voting tasks. For example, (Köbis et al., 2019) showed that when dishonesty results in harm to concrete others, promoting intuition by using time pressure has no significant effect on dishonesty. On the contrary, (Capraro, 2017) and (Capraro et al., 2019) found a significant (positive) effect of time pressure on truth-telling in a deception game. Systematic evidence on the effect of time pressure on voting behavior, however, is lacking. An exception is the experimental study of (Hansson et al., 1974), which used hypothetical voting decisions and reported that subjects under time-pressure voted more conservatively on political issues taken from real bills of the Washington State legislature (15 conservative items, 15 liberal ones). The authors interpreted this conservative shift as due to informational overload.
The majority of previous studies on the effects of time pressure on decision making relied on fixed time limits (e.g., WegierSpaniol, 2015,Conte et al., 2016) where the time to make the decision is constrained, but as long as the time constraint is not violated, decision time does not affect payoff. In contrast, we decided to implement opportunity costs for spending time on a decision (e.g., Alós-FerrerGaragnani, 2020). The reasons for this particular implementation are as follows. First, there is a substantial heterogeneity regarding participants’ response times, rendering it difficult to determine a reasonable time limit that would put all subjects under a comparable degree of time pressure. Second, response times are related to the strength of people’s preferences, a phenomenon called the chronometric effect (e.g., Dashiell, 1937,MoyerLandauer, 1967,Alós-FerrerGaragnani, 2022a,Alós-FerrerGaragnani, 2022b). That is, for participants with strong preferences (one way or the other), decisions are naturally faster than for those who are closer to indifference. This is a problem for a fixed time limit manipulation because the threshold might not be binding for some participants, rendering the time-pressure manipulation ineffective for them. Third, for decisions in small committes as, e.g., boards of directors, there might be no specific, absolute time constraints, but there are often opportunity costs of time, in the sense that the time to vote for a specific motion is costly. These issues can be avoided by using opportunity time costs. In particular, we decided to implement time pressure as a simple, easy-to-understand mechanism that reduces payoff as a direct function of time spent for voting, i.e., as the clock ticks down participants lose money. By making every second count, time pressure becomes binding for all participants independently of their preference strength. That is, independently of how quickly participants’ answers would have been without the manipulation, every participant experienced time pressure, albeit of course of different intensity depending on the own strength of preference (see Alós-FerrerGaragnani, 2020 for a detailed discussion on the merits of this manipulation). Similar, time-dependent incentive schemes have been used in a number of previous decision-making studies (e.g., Payne et al., 1996,KocherSutter, 2006).
Our results might also be of interest for political science. It has been argued that some voters do make last-minute decisions. A post-election review carried out after the 2019 Australian federal election found that over a quarter of voters in the sample had not made up their minds before the closing weeks, and as many as 11% made their decision on polling day (Murphy, 2019). Also, effective voting time is often constrained. Almost every state in the U.S. enforces constraints limiting the allowed time in the voting booth (ReitmanDavidson, 1972). For example, the states of Washington and Indiana have 2-minute time limits (Revised Code of Washington, 1965, c9; 29.51.220, Title 3 Article 11 of Indiana Code).
The paper is structured as follows. Section 2 introduces the experimental design and procedure, followed by the presentation of the results in Section 3. This section reports the analysis of sincerity and reports on the actual voting behavior. Section 4 concludes.
The basic experimental task was a voting paradigm based on (Forsythe et al., 1993), (Forsythe et al., 1996) (see also Granić, 2017,Alós-Ferrer et al., 2021). Participants voted in groups to select one among a number of alternatives, which were associated with different monetary payoffs for different types of voters. Every voter was informed about the full payoff table in each election, hence the payoff associated with each alternative for each voter type was common knowledge for all group members. In this work, the experimental design followed a 2 (voting method: Plurality Voting vs. Approval Voting) × 2 (manipulation: time pressure vs. no time pressure) within-subjects design.
Subjects were randomly allocated to groups of 6 voters that were kept fixed throughout the experiment. All subjects took part in 24 elections. To minimize repeated-game effects and to prevent learning, subjects did not receive any feedback regarding the outcomes of the elections, or on the behavior of their group’s members, until the end of the experiment.
Voting decisions were structured in three blocks. In one block, comprising 10 voting rounds, Plurality Voting (PV) was used. In another block, also comprising 10 voting rounds, Approval Voting (AV) was used. To avoid order effects, the order of the two voting methods of interest was counterbalanced between subjects: half of the participants started with PV in the first block and continued with AV in the second block; for the other half of participants the order was the opposite. At the beginning of each block subjects received a detailed description of the voting method on screen.
The third block, which always came at the end, comprised only four voting rounds and used a random-dictator mechanism used to elicit participants’ preferences over the given alternatives, which we will discuss below. Hence, there were a total of 24 voting rounds (10+10+4). All voting methods were neutrally framed and labeled as Voting Method 1–3.
Under PV, voters had to vote for exactly one of the alternatives with the winner being the alternative that received the most votes. Since voters were not allowed to cast empty ballots, abstention was excluded by design. Under AV, voters could approve of as many alternatives as they preferred, but had to approve of at least one alternative (abstention in the sense of casting the full ballot was allowed) and the winner was the alternative that received the highest number of approvals. For both voting methods, ties between two or more alternatives were broken randomly.
Within each voting block, each group faced a sequence of payoff profiles. All payoffs were presented in terms of Experimental Currency Units (ECU) that were converted to EUR at the end of the experiment at a fixed rate of 0.12 EUR for 1 ECU. Each profile featured 4 alternatives (A, B, C, and D) and 3 voter types that differed with respect to the monetary rewards associated with each of the alternatives. Within each group of 6 voters, exactly 2 voters were randomly assigned to each type, which was kept constant through the experiment.
Table 1: Payoff profiles used in the experiment. Profiles 1 to 4 are given as presented, except for the primes in the names of types and alternatives, added to avoid confusion. Profiles 3 and 4 are transformations of profiles 1 and 2, respectively, obtained by reordering alternative and type designations and slightly perturbing the payoffs without changing any preference ordering. The last row presents the back-transformations of profiles 3 and 4 showing their (ordinal) equivalence with profiles 1 and 2.
Payoff Profile 1 Voter # A B C D Type 1 2 63 46 74 78 Type 2 2 72 79 53 62 Type 3 2 71 58 83 52
Payoff Profile 2 Voter # A B C D Type 1 2 81 58 53 72 Type 2 2 66 83 54 59 Type 3 2 46 71 82 60
Payoff Profile 3 Voter # A’ B’ C’ D’ Type 1’ 2 72 83 51 61 Type 2’ 2 59 70 77 53 Type 3’ 2 67 54 59 78
Payoff Profile 4 Voter # A’ B’ C’ D’ Type 1’ 2 51 72 58 81 Type 2’ 2 82 47 63 69 Type 3’ 2 49 78 73 62
Transformed Payoff Profile 3 Voter # A B C D Type 1 2 59 53 70 77 Type 2 2 67 78 54 59 Type 3 2 72 61 83 51
Transformed Payoff Profile 4 Voter # A B C D Type 1 2 78 62 49 73 Type 2 2 72 81 51 58 Type 3 2 47 69 82 63
We aimed to use two qualitatively different voting situations but present each of them twice, with perturbed payoffs and juggled alternative names and type designations. That is, we used four different payoff profiles, but they correspond to just two qualitatively different situations (see Table 1). They were all designed to avoid salient or focal options, as, e.g., extreme differences in equity or efficiency.
Payoff profiles 1 and 3 correspond to the same situation, in the sense that after a renaming of the alternatives and the types, they induce the same preferences (payoff orderings) for each type.3 Since every participant had a fixed type but played both profiles, 4 out of each 6 participants actually made the decision of each type (or the corresponding, equivalent type). That is, 4 out of 6 participants decided either as type 1 in Profile 1 or as type 2 in Profile 3 (type 2’ in the table), which actually corresponds to type 1 in the decision situation (see Transformed Payoff Profile in Table 1), and hence we obtain 4 decisions for that type from each group of 6 voters. The same is true for payoff profiles 2 and 4.4 For the reader’s convenience, Table 1 presents the profiles how they were actually presented in the experiment (with the exception of adding primes to alternative and type names to avoid confusion) and the transformed profiles 3 and 4 to show their ordinal equivalence with profiles 1 and 2. In the rest of the discussion, type designations and alternative names refer to those type in profiles 1 or 2 (first row of the table) and in the transformed versions of profiles 3 or 4 (third row of the table).
The two situations are qualitatively different. Payoff profiles 1 and 3 build an example of a conflicting voting situation, where the decision is not easy. Specifically, they do not have neither a Condorcet winner nor a Condorcet loser, and hence there might be a conflict between sincerity and obtaining a clear outcome. Alternative A, however, can be seen as maximizing equity since it has the smallest absolute difference between voters’ payoffs. In contrast, the most efficient alternative (maximizing the sum of payoffs) is C.
In contrast, payoff profiles 2 and 4 are an example of a voting situation where an efficiency criterion should be easy to implement. They have both a Condorcet winner (B) and a Condorcet loser (C), and hence voting sincerely might be more natural. The Condorcet winner of profiles 2 and 4 also corresponds to the most efficient option, and the Condorcet loser is also the least efficient option in terms of sum of payoffs. However, the option which maximizes equity (in the sense of having the smallest absolute difference between voters) is D, i.e., neither the Condorcet Winner nor the Condorcet Loser.
Hence, the payoff profiles capture a conflict between efficiency and equity, but efficiency is supported as a Condorcet Winner in profiles 2 and 4 (which should make coordination or cooperation easier5). The profiles were chosen such that the gap between the most-efficient option (in terms of sum of payoffs) and the most-equitable one (in terms of minimizing payoff differences) was not too large, in order to maintain the tension between them. For payoff profiles 1 and 3, the efficient option (C) gives a slightly higher total sum of payoffs than the second-best option, which coincides the alternative with the smallest absolute difference between the voters (A).
In both the first and the second voting blocks (PV and AV), each of the four payoff profiles was presented twice (with participants being of the same voter type), once under time pressure and once without time pressure. Rounds with and without time pressure were intermixed. Further, to reduce the possibility that participants recognized the payoff profiles when they encountered the same profile again, we added two filler profiles to each block (given in Appendix A). Accordingly, both the first and the second voting blocks consisted of 10 election rounds. The profiles were presented in a pseudo-randomized order that was the same for both blocks (PV and AV), which allows for a clean comparison of voter behavior for a given profile (and type) across the two voting methods of interest. Table 2 presents the order of payoff profiles in the first and the second voting blocks (PV and AV).
Table 2: Sequence of Voting Rounds in the PV and AV blocks (10 rounds each). The table displays the order in which participants experienced each condition (time pressure or not) and payoff profile.
Voting Round 1 2 3 4 5 6 7 8 9 10 Time Pressure No Yes Yes No No No Yes No No Yes Payoff Profile 1 2 3 4 Filler Filler 1 2 3 4
Time pressure was implemented as follows. Before each voting round, the subject was informed of whether the upcoming round would afford the opportunity to gain additional ECU by means of a fast decision. If this was the case, the subject was endowed with additional 30 ECU for that voting round, but continuously lost 1 ECU per second, until she cast her vote (by confirming the selection of alternatives via mouse-click). For instance, given a response time of 10 seconds for voting, the subject would receive 20 ECU. After 30 seconds the endowment would have reduced to zero, but it was still possible to cast a vote (i.e., there was no time constraint). The remaining sum of ECU was visually indicated by an onscreen counter, which was displayed above the ballot and counted down from 30 to 0.
In the third voting block, participants faced the four profiles in four rounds of preference elicitation without time pressure. We employed a random-dictator mechanism designed to elicit the subject’s preferences over alternatives for each of the payoff profiles in the experiment in an incentive-compatible way (used also in Alós-FerrerBuckenmaier, 2021). To that end, subjects were informed that, for each round under this voting method, one participant would be selected at random among the 6 group members, and she would choose an alternative for the whole group. However, since the identity of the dictator was only revealed at the very end of the experiment, we asked every voter to indicate the alternative they would choose in case they were selected to be the dictator. In order to elicit the full preference over alternatives, subjects were informed that there was a small probability of 5% that their most preferred alternative could not be implemented. Hence, in a second step they were asked to name a second alternative to be implemented in that case. Again, for this second-most-preferred alternative there was a 5% probability of not being implemented, and hence participants had to indicate their third-most-preferred alternative. In this way, participants sequentially provided a complete ranking of the 4 alternatives.
At the end of the experiment, one of the 24 elections was selected at random for each group, and each subject received a certain amount of ECU according to the outcome of this randomly selected election. Further, one of the 8 rounds involving time pressure was randomly selected for each subject, and the subject additionally received the amount of ECU remaining from the 30 ECU endowment, depending on the time spent for voting.
When analyzing the data we focus on the effects of the two voting methods (AV vs. PV) on the sincerity of the ballots cast. Consider a voter with a strict preference over alternatives. Under PV only voting for one’s most preferred alternative is sincere. For AV a ballot is sincere if and only if for any approved alternative the voter also approves of all alternatives that are preferred to that alternative. For instance, suppose a voter has the preferences given by A ≻ C ≻ D ≻ B. This implies that C ≻ D for her, therefore a cast ballot containing only alternatives A and D would not be sincere.6
To analyze sincerity we consider individual averages on the subject level, pooling the four different payoff profiles. That is, we take the individual percentage of sincere votes as a single observation. For each individual, we can compare this percentage between voting methods and between rounds with and without time pressure.
We first analyze the data under the assumption that voters’ preferences are as induced by the monetary payoffs associated with the alternatives; that is, as standard in voting experiments, we assume that voters prefer their own maximum payoff, disregarding the payoffs of the other group members. We say that a vote/ballot is induced-sincere if it is sincere with respect to this induced strict preference.
As a robustness check, we also consider elicited preferences. The third voting block in the experiment served to elicit the voters’ true preferences over the given alternatives (see Section 2). Those preferences might in principle differ from the preferences induced by means of monetary rewards, e.g., due to fairness concerns or efficiency considerations. We call a vote/ballot elicited-sincere if it is sincere with respect to the elicited strict preference obtained from the preference-elicitation task.
In order to test for differences in the share of sincere votes, we rely on non-parametric, two-tailed Wilcoxon Signed-Rank (WSR) tests. These tests are appropriate since, due to our 2×2 within-subject design, for each participant we have observations for both voting methods and time pressure conditions.
The study was conducted at the Cologne Laboratory for Economic Research (CLER) using z-Tree (Fischbacher, 2007). Participants were recruited via ORSEE (Greiner, 2015) among the student population at the University of Cologne, excluding students majoring in psychology (who frequently participate in experiments with deception and might, in our experience, not have believed our truthful instructions). In exchange for participation, they received a payment based on the outcomes of the voting task and the time pressure task, plus a show-up fee of 4 EUR.
Before the start of the experiment, participants read through the instructions of the voting task and answered several control questions to ensure they understood the rules of the voting task properly (see Section 2 and Appendix C).
Prior to the experiment, we computed that the required sample size for a WSR to have enough power (0.8) to detect a medium effect size (d=0.3) was N=94. Anticipating possible exclusions and no-shows, we predetermined a sample size of 120 and conducted 4 group sessions, each with 5 groups of 6 participants. Five participants were excluded from data analysis due to severe problems understanding the voting task, which in the case of two participants was due to language problems.7 The remaining 115 participants (62 females) ranged in age from 18 to 32 years (average: 22.73, SD = 2.62). Participation lasted around 60 minutes, and participants earned on average 14.84 EUR (SD = 1.82), including the show-up fee.
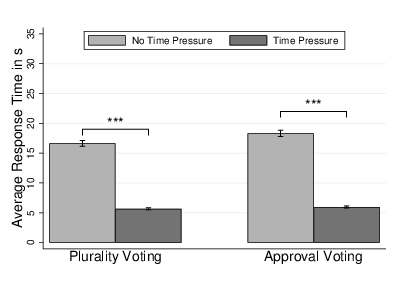
The analysis of response times (see Appendix B and Figure 3) demonstrate that participants cast their votes much faster in election rounds under time pressure (on average 5.67 seconds) compared to the rounds without opportunity time costs (average 16.63 seconds). Participants’ payoffs due to the time-pressure manipulation were on average 23.73 ECU (SD = 3.97).8
Time pressure also affected the number of selected alternatives under Approval Voting: When there was no opportunity to gain additional ECU through a fast decision, participants selected on average 1.86 out of the four presented alternatives. Under time pressure, this number was slightly but significantly reduced (M = 1.71), WSR test, N=115, z = 3.94, p = .0001.
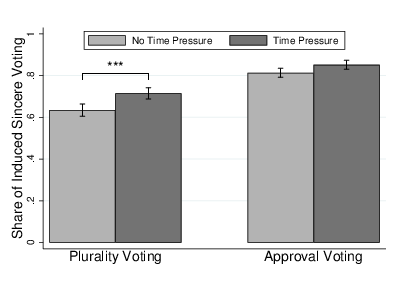
Figure 1 displays the proportion of induced-sincere votes depending on the presence of time pressure, on the left-hand side for Plurality Voting and on the right-hand side for Approval Voting. The average share of induced sincerity under PV was 63.48% when there was no time pressure, compared to an average of 71.52% when time pressure was implemented via opportunity costs. The difference is significant according to a WSR test, N=115, z = 2.78, p = 0.0055. Under AV, the average percentage of induced-sincere votes was 83.70% without and 85.43% with time pressure, which is not significantly different (WSR test, N=115, z = 0.10, p = 0.9204). Hence, the manipulation affected behavior only under Plurality Voting, but not under Approval Voting. This was confirmed by a further test comparing the change induced by the time-pressure manipulation across the two methods. That is, for each fixed method and each participant, we computed the difference in induced sincerity between rounds with time pressure and rounds without it. A WSR test showed that this measure is significantly different between the two voting methods, N=115, z = 2.02, p = 0.0430. That is, the difference between the proportion of sincere decisions with and without time pressure was larger under PV than under AV.
Figure 1 also shows that the share of sincere voting was larger under Approval Voting than under Plurality Voting, in line with the literature and with our assumptions. WSR tests confirm that the effect was present both under time pressure (N=115, z = 4.71, p < .0001) and without time pressure (N=115, z = 5.80, p < .0001).
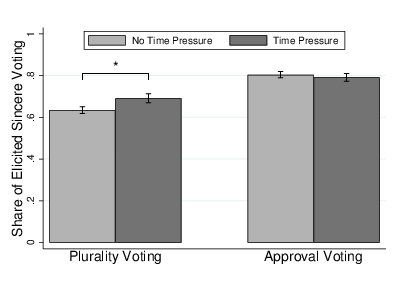
As a robustness check, Figure 2 depicts the share of elicited-sincere votes depending on voting method and time pressure. Under Plurality Voting, the average share of elicited-sincere votes was 63.48% when there was no time pressure, and 69.13% when time pressure was present. Under Approval Voting, it was 80.43% without and 79.13% with time pressure. WSR tests show a differential effect of the manipulation: Under PV, there was more sincere voting under time pressure than under no time pressure, although the effect missed significance at the 5% level: N=115, z = 1.92, p = 0.0543. In contrast, the manipulation clearly did not affect the percentage of sincere votes under AV, N=115, z = 0.75, p = 0.4528. A further test showed that that the effects of the time-pressure manipulation, as in the case of induced sincerity, were significantly different between the two voting methods. That is, the difference in sincere voting with and without time pressure was significantly larger in PV than in AV (WSR; N=115, z = 1.98, p = 0.0475).
Again, as can be seen in Figure 2, the share of sincere voting was larger under Approval Voting compared to Plurality Voting. According to WSR tests, the effect was significant both without time pressure (N=115, z = 4.89, p < .0001) and under time pressure (N=115, z = 3.31, p = .0009).
We found that during the preference-elicitation block participants did not always rank the four alternatives according to monetary payoff, meaning that elicited preferences did not correspond to induced preferences one-to-one. The differences, however, were not large. When considering the most-preferred alternative only, preferences were consistent in 85.00% of cases. That is, in 85.00% of cases participants first chose the alternative maximizing their own monetary outcome during the preference-elicitation mechanism. If one considers the full rankings (from most preferred to third-most preferred), those are identical in 72.61% of cases.
When comparing the fraction of votes that were induced-sincere with the fraction of votes that were elicited-sincere, there was no difference under PV, neither under time pressure (WSR test, N=115, z = −0.66, p = .5089) nor without time opportunity costs (N=115, z = −0.19, p = .8524). In contrast, the fraction of induced-sincere votes was significantly larger than the fraction of elicited-sincere votes when participants cast their votes under AV. WSR tests confirmed that this was the case both under time pressure (N=115, z = 3.18, p = .0015) and without time pressure (N=115, z = 2.02, p = .0432).
In this subsection we examine insincere (strategic) votes. In particular, we consider whether strategic choices concentrate on the efficient alternative, which is alternative C for payoff profiles 1 and 3 and alternative B for payoff profiles 2 and 4.
For payoff profiles 1 and 3, type 3’s sincere maximizer is also the efficient alternative, hence a deviation from sincerity is also a deviation from efficiency. This is also the case for type 2 in payoff profiles 2 and 4. Hence, we concentrate on the remaining types. For those, Tables 3 and 4 report the distribution of sincere and insincere voting under PV and AV, respectively, distinguish between time pressure conditions.
Table 3: Distribution of sincere and insincere votes in PV for types whose payoff-maximizing alternative was not payoff maximizing. The last four columns report the distribution of insincere votes. Rows indicate the voter’s type (1 to 3), the preference profile (PP 1 and 3 or 2 and 4), and the treatment (Time Pressure or No Pressure)
2*Profile 2*Type 2*Condition 2*Sincere 2*Insincere Insincere votes for 4*1 and 3 2*Type 1 No-P 33 45 TP 48 30 2*Type 2 No-P 46 30 TP 50 26 4*2 and 4 2*Type 1 No-P 62 14 TP 62 14 2*Type 3 No-P 35 41 TP 49 27
The data in Table 3 reveal a simple pattern for insincere votes under PV: insincere voters overwhelmingly select their second-best option. In preference profiles 1 and 3, this is option C for type 1 voters and option A for type 2. In preference profiles 2 and 4, this is option D for type 1 voters and option B for type 3. For type 1 voters in profiles 1 and 3 ,and for type 3 voters in profiles 2 and 4, their second-best option happens to be the efficient alternative. In both of these cases, support for this alternative (conditional on insincere voting) was smaller under time pressure (test of proportions; type 1 in profiles 1 and 3, z=−1.740, p=0.041; type 3 in profiles 2 and 4, z=−2.103, p=0.018).
Since there is generally less insincerity under AV, Table 4 captures less data and no patterns can be seen. The only exception is that, in preference profiles 1 and 3, type 1 voters who voted insincerely tended to approve of the efficient alternative C less often under time pressure (test of proportions, z=−2.685, p=0.004).
In Appendix D we further report the entire distribution of voting behavior under each condition, i.e., voting method, preference profile, voter’s type, time pressure condition. In line with the analyses presented above, we observe that most people vote or approve of their payoff-maximizing option, and otherwise go mostly for their second-best alternative.
Table 4: Distribution of sincere and insincere ballots in AV for types whose payoff-maximizing alternative was not payoff maximizing. The last four columns report the distribution of approvals in the insincere ballots. Rows indicate the voter’s type (1 to 3), the preference profile (PP 1 and 3 or 2 and 4), and the treatment (Time Pressure or No Pressure)
2*Profile 2*Type 2*Condition 2*Sincere 2*Insincere Insincere approvals of 4*1 and 3 2*Type 1 No-P 65 13 TP 71 7 2*Type 2 No-P 63 13 TP 60 16 4*2 and 4 2*Type 1 No-P 63 13 TP 65 11 2*Type 3 No-P 61 15 TP 67 9
Whether voting methods capture true preferences or rather induce strategic behavior is an important question with relevant policy implications. While previous work has often investigated sincerity for given voting methods (e.g., Bassi, 2015), we focus on how sincerity is affected by the interaction of the voting method with other factors, and in particular time pressure.
We show that people under time pressure tend to display higher sincerity under Plurality Voting, but not under Approval Voting, which has been defended as a method generating no incentives for strategic behavior. In line with the literature (BramsFishburn, 1978), sincerity is also higher under Approval Voting than under Plurality Voting. Moreover, we implement the time-pressure manipulation using the opportunity of cost of time compared to a fixed threshold. That is, the potential earnings decrease the more time is spent deciding. This implementation overcomes some of the limitations of the fixed-deadline method and arguably increases the external validity of the experiment. That is, the implementation reproduces real-world situations where people are under (time) pressure not only because there is a fixed deadline, but because time is valuable and could be spent in other activities.
As expected, our results suggest that Approval Voting is robust to time pressure, in the sense that the sincerity of decisions is unaffected by this manipulation, and sincerity is high in either case; thus decisions mostly follow sincerity and are accordingly easy. In contrast, when people are under time pressure (and, presumably, when they are distracted or their working memory is taxed), voting decisions under the most commonly used voting method (Plurality Voting) become more sincere, confirming that decisions not made under time pressure might usually reflect (deliberative) strategic considerations. Taking together, these results suggest that voting decisions are easier under Approval Voting than under Plurality Voting.
Necessarily, our study rests on a number of specific design choices. We have concentrated on a particular manipulation (time pressure), but the dual-process logic underlying our study could be implemented in different ways, e.g., cognitive load (see, however Achtziger et al., 2022). We have focused on the punctual comparison of Approval Voting and Plurality Voting, but other methods have also been argued to be less susceptible to manipulation and strategic behavior than Plurality Voting, e.g., Single-Transferable Vote or “Instant Runoff” (BartholdiOrlin, 1991), which is actually used in Australia and San Francisco. Last, our experimental design employs only two particular preference profiles, implemented through four specific payoff tables. Although those are meant to capture voting situations of interest, it would be desirable to examine the robustness of the result to alternative payoff profiles, as well as the size of the voting group (see, e.g., Alós-FerrerBuckenmaier, 2021).
Table 5: Filler payoff profiles used in the experiment.
Filler Profile 1 Voter # A B C D Type 1 2 92 48 57 64 Type 2 2 56 91 49 66 Type 3 2 47 54 93 67
Filler Profile 2 Voter # A B C D Type 1 2 87 46 53 92 Type 2 2 78 93 48 54 Type 3 2 43 57 94 49
Figure 3 depicts the effect of time pressure on response times, separated for Plurality (left-hand side) and Approval (right-hand side) Voting. The average response time under Plurality Voting is 16.63 s when there is no time pressure, and 5.67 s in the voting rounds with opportunity time costs. The difference is highly significant according to a WSR test (N=115, z = 9.30, p < .0001). Under Approval Voting, participants decide, on average within 18.32 s without time pressure, and again significantly faster when time opportunity costs are present (M = 5.96 s; WSR test, N=115, z = 9.31, p < .0001). Hence, not surprisingly, participants cast their votes much faster in the manipulation rounds in order to gain additional ECU.
When comparing response times for sincere votes with those for insincere votes, the sample size for the WSR tests is reduced because not every participant has observations for both cases. This is particulary true under Approval Voting, where on average only 15−20% of votes are not sincere.
Under Plurality Voting and no time pressure, induced-sincere votes take, on average, 18.65 s, while insincere votes take 21.42 s. A WSR test confirms that response times for insincere votes are longer than those for sincere votes (N=65, z = 2.55, p = .0107). When time pressure is present, the mean response time of induced-sincere votes is 6.68 s, and 7.00 s for insincere votes. A WSR test reveals no significant differences (N=53, z = 1.08, p = .2821).
Under Approval Voting, response times of sincere and insincere votes do not differ, either without time pressure (WSR test; sincere, M = 21.45 s; insincere, M = 22.77 s; N=31, z = 0.84, p = .3994) or when participants face time opportunity costs (sincere, M = 6.14 s; insincere, M = 6.74 s; N=34, z = 1.03, p = .3010).
Under Plurality Voting and no time pressure, response times for elicited-insincere votes (M = 20.02 s) are longer than response times for elicited-sincere votes (M = 18.67 s), but the difference is not significant at the 5% level according to a WSR test (N=74, z = 1.70, p = .0892). There is also no difference under time pressure (sincere, M = 6.83 s; insincere, M = 7.14 s; WSR test, N=58, z = 1.20, p = .2316).
Under Approval Voting, response times of elicited-sincere and elicited-insincere votes do not differ, either without time pressure (WSR test; sincere, M = 18.83 s; insincere, M = 22.77 s; N=43, z = 1.52, p = .1281) or with it (sincere: M = 6.12 s; insincere: M = 6.54 s; N=46, z = 0.51, p = .6114).
Our results are consistent with the assumption that under Plurality Voting, participants often vote strategically, which takes time. This is reflected in longer response times for insincere votes. However, such an effect is not present under time pressure, where participants’ capacities for deliberative processes are reduced and where in general decisions are very quick (and more often sincere). Further, we do not find longer response times for insincere votes under Approval Voting, where strategic distortions should play a lesser role or none at all.
which alternative wins the electionwhich alternative I vote for
every voting decisiona random choice
correctnot correct
2 voters1 voter
78 48 88
every rounda randomly drawn round
20 10 0
Our sample size was computed to test for sincerity at the level of the entire population, and not restricting to individual types. For completeness, however, here we briefly (and descriptively) summarize the actual voting decisions in our experiment. We aggregate the decisions in payoff profiles 1 and 3, and the decisions in payoff profiles 2 and 4 (of course after transforming the alternative and type names appropriately).
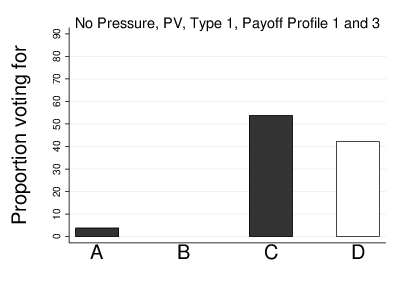
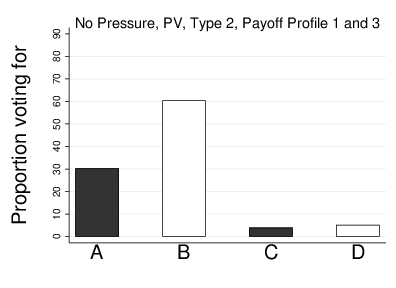
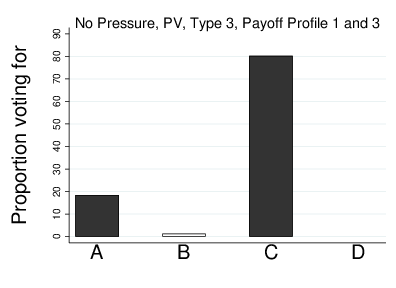
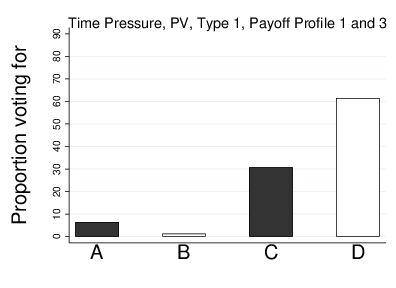
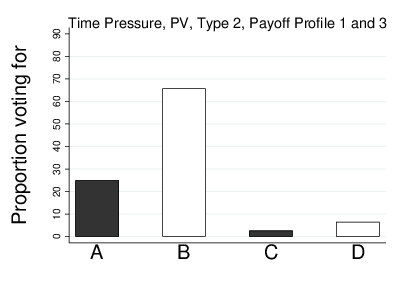
We consider PV first. For payoff profiles 1 and 3 (Figure 4), where there is no Condorcet winner, without time pressure type 1 mostly voted for the efficient option C, followed by the sincere maximizer D. With time pressure, support for D (and hence sincerity) increased. Type 2 mostly voted for B (the own sincere maximizer) with or without time pressure. Last, type 3’s most-voted-for option was C, which is both efficient and this type’s sincere maximizer.
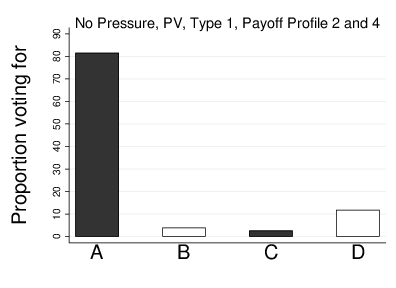
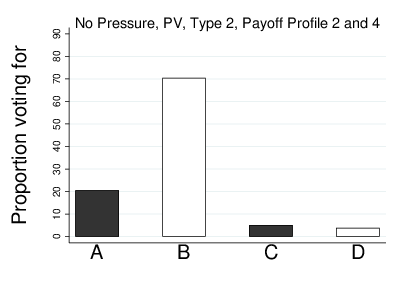
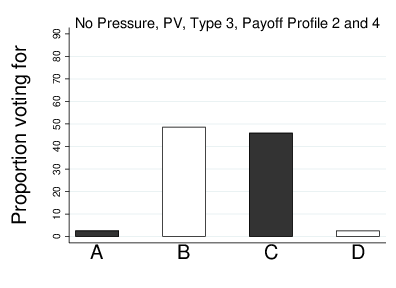
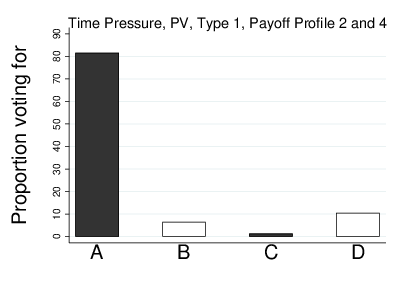
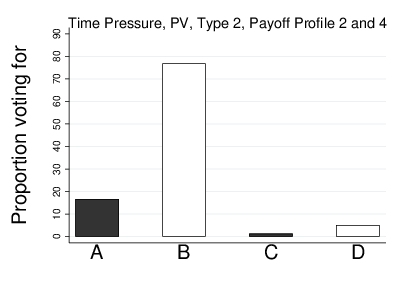
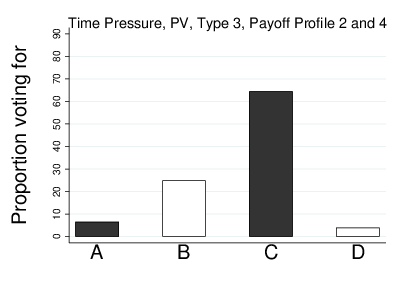
For payoff profiles 2 and 4 (Figure 5), under PV type 1 mostly voted for the own sincere maximizer A, with or without time pressure. Type 2 mostly voted for the Condorcet winner B, which is also this type’s sincere maximizer. Last, without time pressure type 3 mostly voted for the Condorcet winner B, closely followed by the own sincere maximizer (and Condorcet loser) C. With time pressure, support for the latter, hence sincerity, increased.
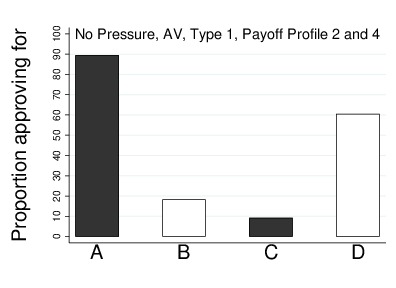
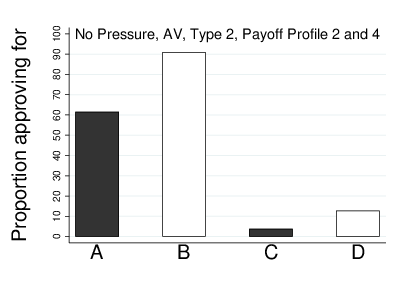
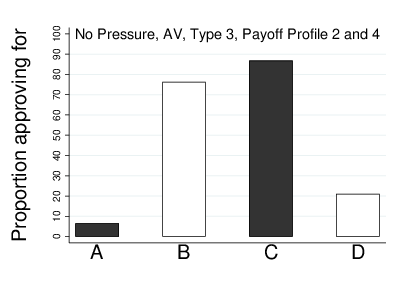
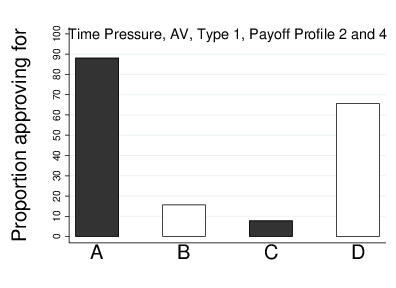
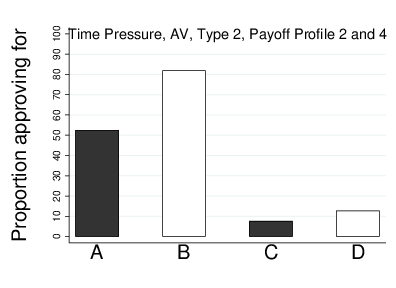
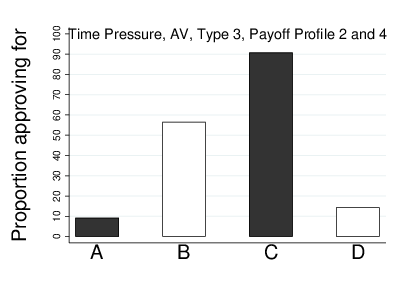
Under AV, the distributions of approvals with and without time pressure were similar. They are also less informative in themselves, since an approval of a non-payoff-maximizing alternative might be part of a sincere ballot.
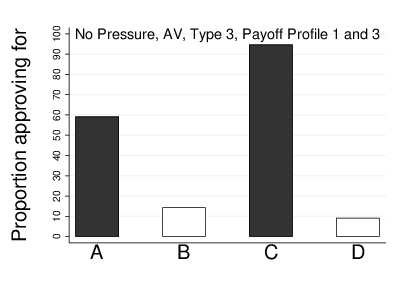
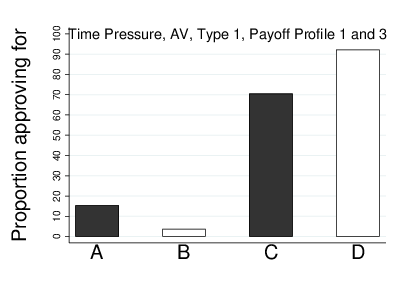
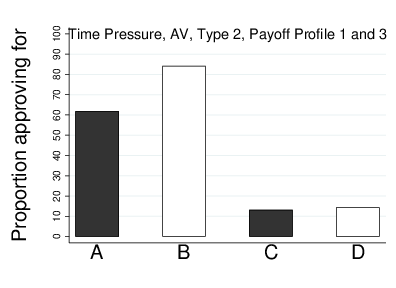
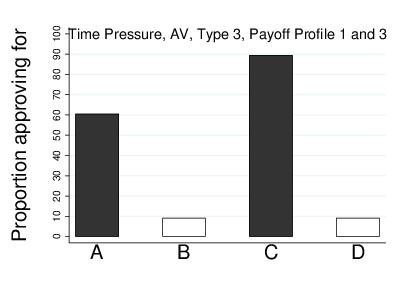
For payoff profiles 1 and 3 (Figure 6), type 1 overwhelmingly approved of the efficient option C and of the sincere maximizer D, but the support for C did decrease under time pressure. As in the case of PV, type 2 did support the own preference maximizer B, but also equity, A. For type 3, the most-approved-of option was C, which is both efficient and this type’s sincere maximizer, and was followed by equity, A.
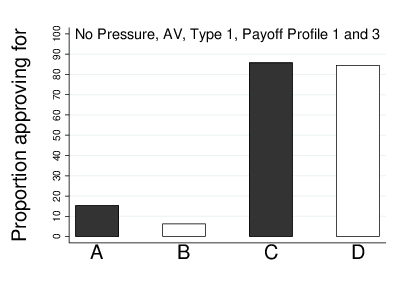
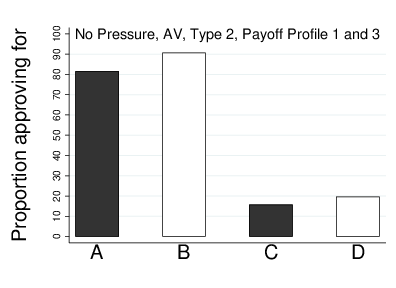
For payoff profiles 2 and 4 (Figure 7), under AV type 1 mostly approved of A and D, her first- and second-best options. Type 2 showed high approval levels for B followed by A, again the first- and second-best options. Finally, type 3 mostly approved of the own sincere maximizer C, followed by the second-best alternative, B.
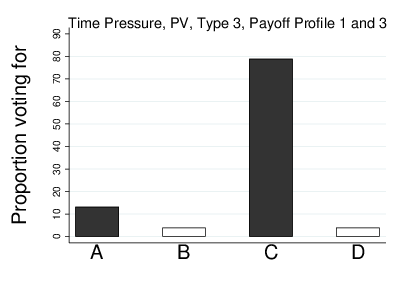
Figure 4: Proportion of people who voted for each option under PV in payoff profiles 1 and 3 by type, under No Pressure (top row) and with Time Pressure (bottom row).
Financial support from the German Research Foundation (DFG) through project AL-1169/2 and through the Research Unit “Psychoeconomics” (FOR 1882) is gratefully acknowledged. The studies were conducted at the CLER (Cologne Laboratory for Economic Research). The CLER gratefully acknowledges financial support from the German Research Foundation (DFG).
Copyright: © 2022. The authors license this article under the terms of the Creative Commons Attribution 4.0 License.
This document was translated from LATEX by HEVEA.