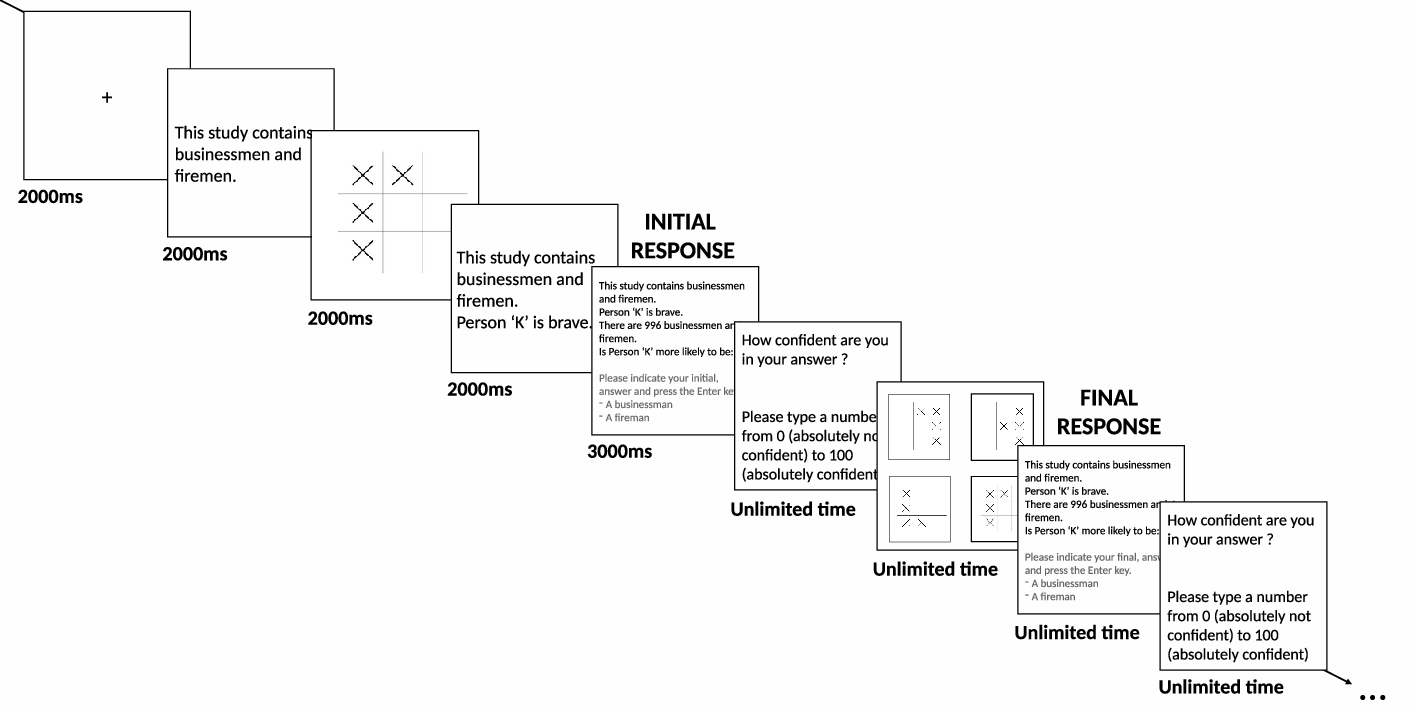
| Figure 1: Time course of a complete two-response base-rate item. |
Judgment and Decision Making, Vol. 17, No. 4, July 2022, pp. 646-690
Debiasing System 1: Training favours logical over stereotypical intuitingEsther Boissin* Serge Caparos# Aikaterini Voudouri$ Wim De Neys! |
Abstract: Whereas people’s reasoning is often biased by intuitive stereotypical associations, recent debiasing studies suggest that performance can be boosted by short training interventions that stress the underlying problem logic. The nature of this training effect remains unclear. Does training help participants correct erroneous stereotypical intuitions through deliberation? Or does it help them develop correct intuitions? We addressed this issue in four studies with base-rate neglect and conjunction fallacy problems. We used a two-response paradigm in which participants first gave an initial intuitive response, under time pressure and cognitive load, and then gave a final response after deliberation. Studies 1A and 2A showed that training boosted performance and did so as early as the intuitive stage. After training, most participants solved the problems correctly from the outset and no longer needed to correct an initial incorrect answer through deliberation. Studies 1B and 2B indicated that this sound intuiting persisted over at least two months. The findings confirm that a short training can debias reasoning at an intuitive “System 1” stage and get reasoners to favour logical over stereotypical intuitions.
Keywords: reasoning; heuristics and biases; debiasing; intuition
Although as human beings we have exceptional capacities to reason, we do not always reason correctly. Imagine, for example, you are told there is an event with 1000 people. Of the 1000 attendants, 995 are I.T. technicians and 5 professional boxers. You know that one person (“Person X”) was drawn randomly from all attendees. Next, you are informed that this person is described to be “strong”. What do you think is most likely now: Is Person X an I.T. technician or a professional boxer? Intuitively, many people will tend to say that Person X is a professional boxer based on stored stereotypical associations cued by the descriptive information (“Professional boxers are strong”). If your only piece of information were the description of the person, that might be a fair guess. In general, there might be more professional boxers than I.T. technicians who are strong. However, there are also strong I.T. technicians, and you were explicitly told that there were far more I.T. technicians than professional boxers in the sample where Person X was drawn from. If you take this extreme base-rate information into account, this should push the scale to the “I.T. technicians” side. Yet untrained people typically neglect the base-rate principle and opt for the intuitive response that it is cued by their stereotypical prior beliefs (e.g., Kahneman, 2011).
Decades of reasoning and decision-making research have shown that similar intuitive thinking is biasing people’s reasoning in a wide range of situations and tasks (Evans, 2008; Evans & Over, 1996; Kahneman & Frederick, 2002; Kahneman & Tversky, 1973). In general, this literature indicates that human reasoners have a strong tendency to base their inferences on fast intuitive impressions rather than on more demanding, deliberative reasoning. In and by itself, this intuitive or so-called “heuristic” thinking can be useful because it is fast and effortless and can often provide valid problem solutions. However, our intuitions can sometimes cue responses that conflict with more logical or probabilistic principles. As the base-rate example illustrates, relying on mere intuitive thinking will bias our reasoning in that case (Evans, 2010, 2003; Kahneman, 2011; Stanovich & West, 2000).
Cognitive scientists have long been trying to remediate people’s biased thinking and get them to reason correctly (e.g., Lilienfeld et al., 2009; Milkman et al., 2009, Nisbett, 1993). A number of recent studies have been especially successful in this respect (e.g., Boissin et al., 2021; Claidière et al., 2017; Hoover & Healy, 2017; Morewedge et al., 2015; Purcell et al., 2020; Trouche et al., 2014). These “debiasing” studies have shown that a short single-shot explanation about the intuitive bias and correct solution strategy often helps reasoners produce a correct response. Once the problem has been properly explained to reasoners, they manage to solve structurally similar problems afterward.
Such training effects are obviously promising, of course. However, the nature of the training effect is currently not clear. A key question is whether the training primarily affects people’s intuitive or deliberate thinking (or in popular dual-process terms, their fast “System 1” or slow “System 2”, e.g., Kahneman, 2011). The common assumption is that after training, participants will be more likely to deliberate properly (i.e., to engage their “System 2”) and correct the intuitively generated heuristic response (e.g., Evans, 2019; Lilienfeld et al., 2009; Milkman et al., 2009). This assumption fits with the general dual process idea that the deliberate “System 2” primarily serves to correct the intuitive “System 1” (Kahneman, 2011).
However, in theory, it is also possible that once reasoners grasp the solution, they will no longer generate an incorrect intuitive response. Instead, their initial intuitive response would often be sufficient to generate a correct response, without the need for a corrective “System 2” deliberation process. At a general level, this “training sound intuiting” idea can be likened to expertise development (e.g., Hogarth, 2010; Larrick & Feiler, 2015; Kahneman & Klein, 2009) in which the goal is also to turn processes that initially require effortful deliberate “System 2” processing into intuitive “System 1” processes (e.g., Larrick & Feiler, 2015).1
If a debiasing training actually helps people intuit correctly, this would have important implications (Boissin et al., 2021). Although it can be laudable to help people deliberate more, in many daily life situations they will simply not have the time (or resources/motivation) to deliberate. Hence, if debiasing interventions help people only to deliberately correct erroneous intuitions, their impact may be suboptimal. Ultimately, we do not only want people to learn to correct erroneous intuitions but to avoid biased intuitions altogether (Evans, 2019; Milkman et al., 2009; Reyna et al., 2015; Stanovich, 2018). The potential benefits of training sound intuition are rife in this respect.
Recent evidence provided some support for the “trained intuitor” point of view. Boissin et al. (2021) trained their participants on versions of the notorious bat-and-ball problem (i.e., “A bat and a ball together cost $1.10. The bat costs $1 more than the ball. How much does the ball cost?”; typical incorrect response: 10 cents, correct response: 5 cents) with a short debias training in which the correct solution logic was explained with a number of practice problems. Critically, they tested participants’ reasoning accuracy before and after the training with a two-response paradigm (Thompson et al., 2011). In this paradigm, participants are asked to give two consecutive responses to a reasoning problem. First, they have to respond as fast as possible with the first intuitive hunch that comes to mind. Next, they can take all the time they want to reflect on the problem and give a final response. To make maximally sure that the initial response is generated intuitively, the response needs to be given under time pressure and/or cognitive load (Bago & De Neys, 2017; Newman et al., 2017). This paradigm allows to measure the training impact on people’s intuitive (initial response accuracy) and deliberate reasoning performance (final response accuracy). In line with previous training studies (Claidière et al., 2017; Hoover & Healy, 2017; Purcell et al., 2020; Trouche et al., 2014), most people solved the bat-and-ball problem correctly after training, when they were allowed to deliberate. However, the key finding was that, for most previously biased reasoners, after training their initial, intuitive responses were already correct. The Boissin et al. (2021) findings consequently lend credence to the claim that training can help reasoners switch from biased to sound intuiting.
However, the study was but the first of its kind and focused on one single reasoning problem. Given the importance of the potential applied and theoretical implications, further validation is needed. This is especially crucial since the specific focus on the bat-and-ball problem might have distorted the training findings. That is, although the bat-and-ball problem is a popular study object and people show massive bias when solving it, in one critical sense it is also somewhat a-typical. In the bat-and-ball problem, the cued erroneous intuitive response is itself based on logico-mathematical knowledge (i.e., people arrive at $0.10 cents because they simply subtract $1 from the total $1.10 instead of applying the following correct equation: “$1 + 2x = $1.10”; e.g., De Neys et al., 2013; Kahneman, 2011; Morewedge & Kahneman, 2010).
However, most problems from the bias literature cue a conflicting intuitive response that is based on semantic and/or stereotypical background beliefs (e.g., “CEOs are male”) about which people hold (stronger) personal beliefs. This difference might have implications for the success of debiasing interventions. When the bat-and-ball training intervention informs the subject that the answer cannot be 10 cents because otherwise the bat (at a dollar more) would cost $1.10 — which makes for a total cost of $1.20 — participants will presumably not object to the mathematical fact that: $1.10 + $0.10 > $1.10 (i.e., the stated total price). That is, it might be far harder for people to discard a cued intuitive response for which they hold personal beliefs than when such beliefs are not at play (e.g., Kaplan et al., 2016; Goel, 2022). Indeed, when people’s personal belief system is challenged, they might be more likely to engage in motivated reasoning or rationalization to protect their beliefs (e.g., Ditto et al., 2019; Kahan, 2016, 2017; Kunda, 1990; Mercier & Sperber, 2011; Pennycook & Rand, 2019). In sum, the striking debiasing results of Boissin et al. (2021) might be limited to a specific problem in which the reasoners’ belief system is not challenged. In the present study we examined the robustness and generality of the intuitive training effect by testing whether it could be replicated with different types of bias problems that evoke an intuitive response based on personal, stereotypical beliefs.
In Study 1A, we focused on the popular base-rate neglect problems (e.g., Kahneman & Tversky, 1973) akin to the opening example in which a stereotypical description can conflict with base-rate information. In Study 2A, we looked at equally (in)famous conjunction fallacy problems (Tversky & Kahneman, 1983) in which a stereotypical description can trick people into violating the elementary conjunction rule (i.e., judging a conjunction of two events as more likely than one of its constituent events because it fits a cued stereotypical association). For each study, we contrasted participants’ reasoning performance with a two-response paradigm before and after a short training session and compared their performance to that of participants who received no training (the control group). In Study 1B (base-rate problems) and 2B (conjunction problems) participants were re-tested two months after the initial training to explore whether the training effect was robust and sustained over time.
The study design and research question were preregistered on the Open Science Framework (https://osf.io/674gk/). No specific analyses were preregistered.
Participants were recruited online, using the Prolific Academic website (http://www.prolific.co/). Participants had to be native English speakers from Canada, Australia, New Zealand, the United States of America, or the United Kingdom to take part. The same sample size as Boissin et al. (2021) was selected; In total, 101 individuals participated (62 females, M = 31.0 years, SD = 10.7), 50 participants were randomly assigned to the training group and 51 to the control group. In total, 38 participants had secondary school as their highest level of education, and 63 reported a university degree. We compensated participants for their time at the rate of £5 per hour.
The study consisted of three blocks presented in the following order: a pre-intervention, an intervention, and a post-intervention block. In total, each participant had to solve 12 problems during the pre-intervention block, namely, four conflict, four no-conflict, two neutral and two transfer problems (see below), and again the same number of problems during the post-intervention block. All the problems are presented in the Supplementary Material Section A.
Base-rate problems were taken from Bago and De Neys (2017). Participants always received a description of the composition of a sample (e.g., “This study contained I.T. engineers and professional boxers”), base rate information (e.g., “There were 995 engineers and 5 professional boxers”) and a description that was designed to cue a stereotypical association (e.g. “This person is strong”). Participants’ task was to indicate to which group the person most likely belonged. The task instructions stressed that the person was drawn randomly from the specified sample.
The problem presentation format was based on Pennycook et al.’s (2014) rapid-response paradigm. The base rates and descriptive information were presented serially and the amount of text that was presented on screen was minimized. First, participants received the names of the two groups in the sample (e.g., “This study contains businessmen and firemen”). Next, under the first sentence (which remained on the screen) we presented the descriptive information (e.g., Person ‘K’ is brave). The descriptive information specified a neutral name (‘Person K’) and a single word personality trait (e.g., “brave”) that was designed to trigger the stereotypical association. Finally, participants received the base rate probabilities. As in Pennycook et al., base rates varied between 995/5, 996/4, and 997/3. The following illustrates the full problem format:
This study contains businessmen and firemen.Person ‘K’ is brave.
There are 996 businessmen and 4 firemen.
Is Person ‘K’ more likely to be:
• A businessman
• A fireman
Pennycook et al. (2014) pre-tested the material to make sure that words that were selected to cue a stereotypical association consistently did so but avoided extremely diagnostic cues. As Bago and De Neys (2017) clarified, the importance of such a non-extreme and moderate association is not trivial. Note that we label the response that is in line with the base rates as the correct response. Critics of the base rate task (e.g., Gigerenzer et al., 1988; see also Barbey & Sloman, 2007) have long pointed out that if reasoners adopt a Bayesian approach and combine the base rate probabilities with the stereotypical description, this can lead to interpretative complications when the description is extremely diagnostic. For example, imagine that we have an item with males and females as the two groups and give the description that Person ‘A’ is ‘pregnant’. Now, in this case, one would always need to conclude that Person ‘A’ is a woman, regardless of the base rates. The more moderate descriptions (such as ‘kind’ or ‘funny’) help to avoid this potential problem. In addition, the extreme base rates (i.e., 997/3, 996/4, 995/5) that were used in the current study further help to guarantee that even a very approximate Bayesian reasoner would need to pick the response cued by the base-rates (see De Neys, 2014).
Note that Pennycook et al. (2014) created the rapid-response base-rate format with a single word personality trait to reduce reading time (variability) and optimize latency measurement. They showed that the single-word format did not affect accuracy results: People were as biased with their single-word associations as with lengthier descriptions.
In each block, we presented four critical “conflict” items, and four control “no-conflict” items. In the conflict items, the base rate probabilities and the stereotypical information cued conflicting responses (see example above). In the no-conflict items, they both cued the same response (i.e., the description triggered a stereotypical trait of a member of the largest group). The following is an example of a no-conflict problem:
This study contains businessmen and firemen.Person ‘K’ is brave.
There are 996 firemen and 4 businessmen.
Is Person ‘K’ more likely to be:
• A fireman
• A businessman
These control problems should be easy to solve. If participants are paying minimal attention to the task and refrain from random guessing, they should show high accuracy (Bago & De Neys, 2019).
Two sets of 16 unique items (8 pre-intervention and 8 post-intervention block items) were used for counterbalancing purposes. For each block, the conflict problems in one set were the no-conflict problems in the other, and vice-versa (i.e., the base-rates were reversed). Participants were randomly assigned to one of the two sets. Consequently, none of the pre- and post-intervention problem contents was repeated within-subjects (i.e., participants saw a total of 16 different items with a unique stereotypical association).
After the last problem of the post-intervention block, which was always a conflict problem, participants were asked to type in a justification for their final response (see Supplementary Material Section B for further details). As in Boissin et al. (2021), results indicated that most correct responses were correctly justified (training group: 35 correct justifications out of 40 correct responses; control group: 23 correct justifications out of 32 correct responses, see Supplementary Material Section B). Note that the justification was untimed and retrospective. It was collected for exploratory purposes and does not allow us to draw any conclusion regarding the intuitive or deliberate nature of participants’ processing.
We also presented two neutral base-rate problems taken from Pennycook et al. (2014). These problems were designed such that they did not cue any stereotypical association (i.e., the descriptive information was not diagnostic). Here is an example of a neutral base-rate problem:
This study contains boys and girls.Person ’T’ is young.
There are 4 boys and 996 girls.
Is Person ’T’ more likely to be:
• a boy
• a girl
The neutral base-rate items are traditionally used to track people’s knowledge of the underlying logical principles or “mindware” (Stanovich, 2011). When people are allowed to deliberate, reasoners have little trouble solving them (e.g., De Neys & Glumicic, 2008; Frey & De Neys, 2017). The neutral problems allowed us to explore whether a potential learning effect on conflict base-rate problems, in which the reasoner needs to discard a conflicting stereotypical association, leads to a more general performance boost on other untrained base-rate problems.
In addition to the base-rate problems, we presented other types of reasoning problems to test whether the “base-rate” training effect could transfer to other untrained problems with a different logical structure. In total, we used two problems taken from the Cognitive Reflection Test 2 (CRT2) based on the “race” problem from Thomson and Oppenheimer (2016), and two conjunction-fallacy problems taken from Frey et al. (2018). We presented one CRT-like and one conjunction-fallacy problem at the end of the pre-intervention block, and again one CRT-like and one conjunction-fallacy problem at the end of the post-intervention block.
Like the base-rate problems, the CRT-like problems are designed to cue a strong biasing heuristic response and consequently show low accuracy rates (Frederick, 2005):
Imagine you’re in a car race. If you pass the car in fifth place,what place are you in?
• Fourth
• Fifth
• Sixth
Here, the heuristic incorrect response is “fourth place” and the correct response is “fifth place”. The third (“sixth”) response option was used as a filler.
For each of the two conjunction problems, participants were given a short personality description of an individual and were asked to indicate which of two statements was most probable. One statement always consisted of a conjunction of two characteristics (one characteristic that was likely given the description (i.e., a stereotypical association), and one that was unlikely). The other statement contained only the unlikely characteristic. The following illustrates the structure of the conjunction problem:
Jake is 20.He grew up in a poor family in a neglected neighbourhood.
He is quite violent and already served a short sentence in prison.
Which statement is most likely?
• Jake plays the violin
• Jake plays the violin and is jobless
Given that the conjunction of two events cannot be more likely than each of the constituent events (formally: p(A&B) ≤ p(A)) the correct response was the non-conjunctive statement.
During the intervention block, the participants tried to solve three additional conflict base-rate problems without any cognitive or time constraint. In the training group, participants were given an explanation of the correct solution after having responded to each problem. Participants in the control group received no such explanation. The following example illustrates the explanation:
The correct answer to the previous problem is that person ’K’ is most likely a “businessman”. Many people think it is “fireman”, but this answer is wrong.Most people base their answer solely on the description (“Person K is brave”). If this were all information you got, this answer would be correct, as it is likely that there are more brave firemen in the world than brave businessmen.
However, in the problem you also got information about the specific number of businessmen and firemen in the group that person K got drawn from. You were informed that person K was drawn randomly from a group with 996 businessmen and only 4 firemen. Since there are so much more businessmen in the group than firemen (200 times more!), it becomes more likely that person K is a businessman. After all, although firemen might in general be braver than businessmen, there are also some businessmen who are brave. If you combine this with the vastly larger number of businessmen in the group, it will be more plausible that you’re dealing with a brave businessman.
The explanations were based on the same general principles that were adopted by Boissin et al. (2021): The explanations were as brief and simple as possible to prevent fatigue or disengagement from the task. Each explanation explicitly stated both the correct response and the typical incorrect response. To avoid promoting feelings of judgment (Trouche et al., 2014), we gave no personal performance feedback (e.g., “Your answer was wrong”). And to avoid inducing mathematical anxiety, the explanation never mentioned a formal algebraic equation (Hoover & Healy, 2017). Participants moved on to the following screen by clicking on the “Next” button.
For both the pre- and post-intervention blocks, participants responded to each problem using a two-response procedure, where they first provided a ‘fast’ answer, directly followed by a second ‘slow’ answer (Thompson et al., 2011). This method allowed us to capture both an initial ‘intuitive’ response, and then a final ‘deliberate’ one. To minimize the possibility that deliberation was involved in producing the initial ‘fast’ response, participants had to provide their initial answer within a strict time limit while performing a concurrent cognitive load task (see Bago & De Neys, 2017, 2019; Raoelison & De Neys, 2019). The load task was based on the dot memorization task (Miyake et al., 2001), given that it had been successfully used to burden executive resources during reasoning tasks (e.g., De Neys, 2006; Franssens & De Neys, 2009; Verschueren et al., 2004). Participants had to memorize a complex visual pattern (i.e., 4 crosses in a 3x3 grid) that was presented briefly before each reasoning problem. After their initial (intuitive) response to the problem, participants were shown four different patterns (i.e., with different matrices of crosses) and had to identify the one that they had memorized (see De Neys, 2006, for more details).
For all base-rate problems, a time limit of 3 seconds was chosen for the initial response, based on previous pre-testing that indicated it amounted to the time needed to read the preambles, move the mouse, and click on a response option (Bago & De Neys, 2017, 2019; Raoelison et al., 2020). For the lengthier transfer problems, the time limit was set to 6 seconds. The time limit and cognitive load were applied only for the initial response, and not for the final one (see below).
The experiment was run online using the Qualtrics platform. Participants were instructed that the experiment would take 13–15 minutes and that it demanded their full attention. A general description of the task was presented in which participants were instructed that they would read reasoning problems, for which they would have to provide two consecutive responses. They were told that we were interested in their very first, initial answer that comes to mind and that – after providing their initial response – they could reflect on the problem and take as much time as they needed to provide a final answer (see Bago & De Neys, 2017, for literal instructions). In order to familiarize themselves with the two-response procedure, they first solved two unrelated practice reasoning problems with a response deadline only. Next, they familiarised themselves with the cognitive load procedure by solving two memorization trials and, finally, they solved the same two reasoning problems as before with the full two-response procedure (i.e., deadline + load on initial response).
Figure 1 shows a typical base-rate trial, which started with the presentation of a fixation cross for 2000ms, followed by the description of the sample (e.g., “This study contains businessmen and firemen”) for 2000ms, and subsequently, by the visual matrix for the cognitive-load task for 2000ms. Afterwards, the descriptive adjective (e.g., “Person ‘K’ is brave”) was presented for 2000ms followed by the full problem which featured the base-rate information (e.g. “There are 996 businessmen and 4 firemen”) and the answer options. At this point participants had 3000ms to choose a response. After 2000ms the background of the screen turned yellow to warn participants that they only had a short amount of time left to answer. If they had not provided an answer before the time limit, they were given a reminder that it is important to provide an answer within the time limit on subsequent trials. Participants were then asked to enter how confident they were with their response (from 0%, absolutely not confident, to 100%, absolutely confident). Then, they were presented with four visual matrices and had to choose the one that they had previously memorized. They received feedback as to whether their memory response was correct. If the answer was not correct, they were reminded that it was important to perform well on the memory task on subsequent trials. Finally, the same reasoning problem was presented again, and participants were asked to provide a final deliberate answer (with no time limit) and, once again, to indicate their confidence level.
Figure 1: Time course of a complete two-response base-rate item.
Note that, given the different nature of the transfer CRT-like and conjunction problems, we adopted a slightly different timing and presentation format than for the initial response of the base-rate problems. The problems appeared in two parts. The first part of the conjunction fallacies remained on screen for 4000ms, and the first part of the CRT-like problems remained on screen for 2000ms. Then, the visual matrix appeared for 2000ms and next the full problem was shown and remained on screen for 6000ms, during which participants had to select an answer. After 4000ms the background turned yellow to warn participants for the deadline. For the transfer CRT-like and conjunction fallacy problems confidence ratings were not requested after each response, unlike the base-rate problems.
At the end of the study, participants in the control group were also presented with the explanations about how to solve the base-rate problems, and all participants were asked to complete their demographic information.
We discarded trials in which participants failed to provide their initial answer before the deadline (3.5% of all trials) or failed to pick the correct matrix in the load task (12.9% of the remaining trials), and we analysed the remaining 84.1% of all trials. On average, each participant contributed 20.5 (SEM = 0.6) trials out of 24.
For each participant, we calculated the average proportion of correct initial and final responses for the conflict and no-conflict problems, in each of the two blocks (pre- and post-intervention). We analysed the data using mixed-design ANOVAs with Block (pre- vs post-intervention) as a within-subjects factor and Group (training vs control) as a between-subjects factor.
First, we focus on accuracies for the final responses. Figure 2 shows that accuracy was low before the intervention in both the control and the training group (respectively, M = 59.6%, SEM = 5.6, and M = 53.5%, SEM = 6.1), which is in line with findings showing that many reasoners opt for the incorrect stereotypical response even when they can reflect (i.e., the necessary time and resources; Bago & De Neys, 2017; Raoelison et al., 2020). The overall performance of both groups improved following the intervention; however, the performance increase was larger in the training group (accuracy increase of M = 32.8 points, SEM = 5.5) than in the control group (accuracy increase of M = 10.6 points, SEM = 3.7). The ANOVA showed that the Block x Group interaction was significant (F(1,99) = 11.39, p = .001, ηg2= .022).
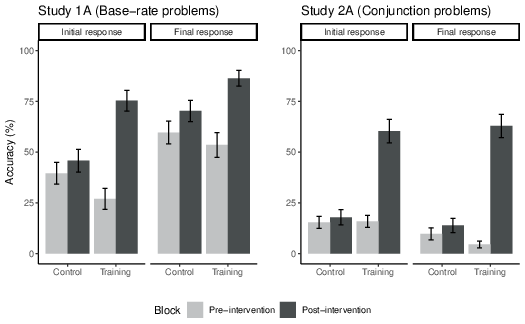
Figure 2: Average initial and final accuracy on conflict problems in Study 1A (base-rate problems) and 2A (conjunction problems). Error bars represent standard error of the mean (SEM).
To explore whether the training improved people’s intuitive reasoning performance, we repeated the analyses on accuracies for the initial responses. The results were fully consistent (Figure 2). Once again, most reasoners failed to solve the conflict problems before the intervention, both in the control and the training groups (M = 39.6%, SEM = 5.4, and M = 27.0%, SEM = 5.2, respectively), but improved after the intervention. The improvement was larger in the training group (performance increase of M = 48.3 points, SEM = 5.5) than in the control group (performance increase of M = 6.2 points, SEM = 4.4); the Block x Group interaction was again significant (F(1,99) = 36.17, p < .001, ηg2 = .07).
In sum, the training intervention helped participants to produce more correct responses. Critically, this improvement was shown not only for final “deliberate” responses, for which participants had time and resources to reflect on their response, but also for initial “intuitive” responses, where deliberation was minimized.3
Finally, we analysed the performance for the no-conflict control problems. We observed that performance was consistently at ceiling, with grand means of 96.2% (SEM = 0.8) for initial accuracy, and 97.4% (SEM = 0.7) for final accuracy (See Supplementary Material Section C). In line with previous studies (Bago & De Neys, 2020; Pennycook et al., 2015; Raoelison & De Neys, 2019), participants’ high accuracy rates on the no-conflict problems indicated that they were paying attention to the task and refrained from random guessing.
To gain some deeper insight into how people changed (or did not change) their response after deliberation, we performed a direction of change analysis (Bago & De Neys, 2017, 2019). More specifically, on each trial, people could give a correct (‘1’) or incorrect (‘0’) response at each of the two response stages (i.e., initial and final). Hence, this can result in four different types of response patterns on any single trial (“00” pattern, incorrect response at both stages; “11” pattern, correct response at both stages; “01” pattern, initial incorrect and final correct response; “10” pattern, initial correct and final incorrect response).
Figure 3 plots the direction of change distribution, for the conflict problems, in both the pre- and post-intervention blocks. As the figure shows, in the training group the intervention led to a sharp decrease in “00” patterns (32.5% drop) which was specifically accompanied by an increase in “11” patterns (48.0% rise). These trends were far less pronounced in the control group.
Critically, in the training group, the decrease in “00” patterns was driven by an increase in “11” patterns rather than an increase in “01” patterns. In fact, the latter pattern slightly decreased (15.8%) following the intervention. These results support the idea that training helped participants intuit the correct solution strategy rather than correct an initial “erroneous” response through deliberation. More specifically, it indicates that, after the training intervention, reasoners were able to apply the correct solution strategy at an intuitive level.
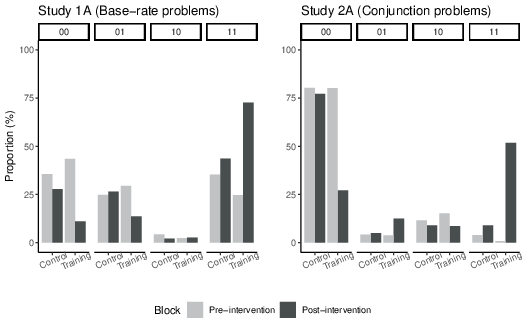
Figure 3: Proportion of each direction of change (i.e., 00 response patterns, 01 response patterns, 10 response patterns and 11 response patterns) for the conflict problems as a function of block and group in Study 1A (base rate problems) and 2A (conjunction problems).
To explore further how participants solved the problems, we performed an individual level accuracy analysis (Raoelison & De Neys, 2019). For each participant, on each conflict trial, we coded the direction of change from start to end of the experiment. This allowed us to observe, at a higher level of detail, how the intervention influenced participants’ response patterns.
First, we describe the categories of participants observed in the training group. By and large, Figure 4 suggests that we can classify the participants into three main categories. First, 12% of the participants did not benefit from the training intervention since they gave incorrect (biased) responses (i.e., “00” patterns) throughout the study. These participants were classified as “biased” respondents in Figure 4. Second, some participants gave correct initial and/or final responses (i.e., “01” or “11” patterns) from start to finish and did not require any training intervention to respond correctly to the base-rate problems. They represent 30% of the participants and were labelled as “correct” respondents. Third, some participants improved their performance after the intervention and were labelled as “improved” respondents. These were participants who showed a post-intervention increase in “01” patterns (at the expense of “00” patterns), or an increase in “11” patterns (at the expense of “00” or “01” patterns). Overall, the proportion of improved respondents in the training group represented the majority of participants (58%).
Next, we made a further subdivision based on the dominant response category within the pre- and post-intervention blocks. Participants who produced a majority of “00” patterns were labelled as “biased”, those who produced a majority of “01” patterns were labelled as “deliberators”, and those who produced a majority of “11” patterns were labelled as “intuitors”. These subdivisions allowed us to look more closely into the individual level directions of change from pre- to post-intervention. Figure 4 shows that, among correct respondents, the majority of the participants belonged to the “intuitor” sub-category (86.7%), both in the pre- and post-intervention blocks, and a minority of the participants belonged to the “deliberator” sub-category (13.3%). Critically, among improved respondents, more than half of the participants who were “biased” before the intervention became “intuitors” (66.7%) after the intervention and a smaller proportion went from being “biased” to being “deliberators” (33.3%). Finally, we note that, among improved respondents, 48.3% of the participants went from being “deliberator” before the intervention to “intuitor” after the intervention. Hence, although before the training they could already respond correctly through deliberation, after the training they were able to intuit the correct response (i.e., with no deliberation involved).
With respect to the control group, Figure 4 shows that 19.6% of the participants were biased respondents, and 43.1% were correct respondents. Note that, in the control group, some respondents (21.7%) showed an inconsistent response pattern and could not be classified based on our criteria. They were put in an “other” group. 15.6% of reasoners in the control group showed a natural improvement, in the absence of training, and started giving correct responses after the control “no-explanation” intervention block. These participants were labelled as “natural improved”. After the no-explanation intervention, 55.5% of them became “intuitors” while the remaining 45.5% were “deliberators”. However, the key point is that this natural-improved group (15.6% of reasoners) was considerably smaller than the improved group in the training condition (58.0% of reasoners). Again, this finding supports the idea that the training intervention led to an improvement in reasoning with the base-rate problems.
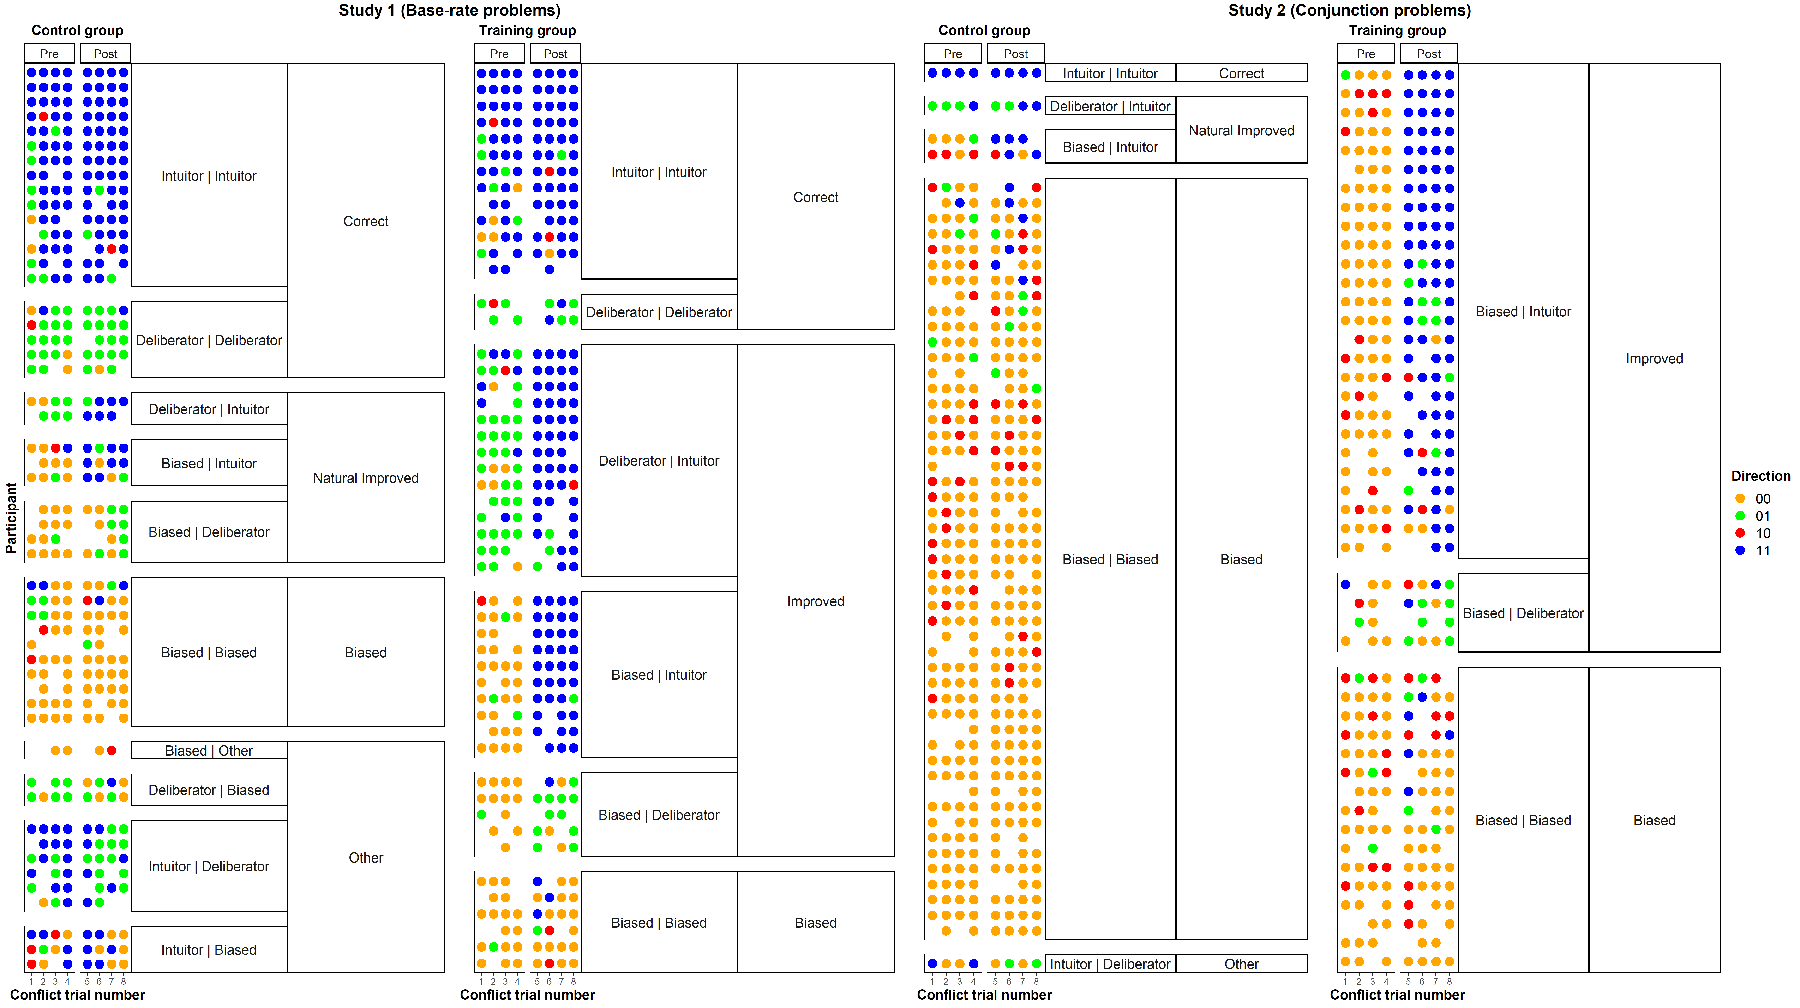
Figure 4: Individual level direction of change (each row represents one participant) of Study 1A (base-rate problems) and Study 2A (conjunction problems). Due to the discarding of missed deadline and load trials (see Trial Exclusion), not all participants contributed 8 analysable trials.
Previous studies have shown that, despite giving an incorrect response, reasoners sometimes detect their error or the presence of a response conflict (e.g., De Neys, 2013; Frey et al., 2017). This detection is often reflected in increased response doubt (i.e., lowered response confidence). In the present study, we explored whether the training intervention affected biased reasoners’ ability to detect conflict in base-rate problems. That is, although the training might not have succeeded in getting biased people to reason accurately, it might have helped them to better detect that their answer was incorrect. We used the conflict-detection index introduced in the study of De Neys et al. (2011), which contrasts confidence4 ratings for no-conflict trials that yielded a correct response to confidence ratings for conflict trials that yielded an incorrect response. We compared the conflict-detection index before and after the intervention, in both the training and control groups. A higher difference value implies a larger confidence decrease when solving conflict items, which is believed to reflect a more pronounced conflict experience (Bago & De Neys, 2019; Pennycook et al., 2015).
Table 1 indicates that, while the conflict experience (i.e., response doubt for incorrect conflict vs. baseline correct no-conflict trial responses) seemed to increase post-intervention in the training group, the opposite pattern was observed in the control group. For completeness, we analysed the data using ANOVAs on initial and final detection indices with Block (pre- vs post-intervention) as a within-subjects factor and Group (training vs control) as a between-subjects factor. For both final and initial responses, the ANOVAs revealed a trend for a Group by Block interaction (Final response: F(1,31) = 3.58, p = .07, η 2g = .03, Initial response: F(1,51) = 2.52, p = .12, η 2g = .02). In sum, although some participants failed to provide the correct response after the training, they may nevertheless have benefited from it, in that they were slightly better able to detect that their heuristic answer was not correct after the training. Clearly, given the weak nature of the trends, this conclusion remains speculative.
Table 1: Conflict detection results in Study 1A (Base-rate problems) and Study 2A (Conjunction problems). Percentage of mean difference in confidence ratings (Standard Error of the Mean) between incorrect conflict and correct no-conflict problems.
Initial response Final response Pre-intervention Post-intervention Pre-intervention Post-intervention Study 1A Control 13.3% (4.7) 7.4% (4.9) 20.6% (5.9) 13.0% (4.9) Training –0.6% (3.2) 8.1% (4.2) 7.1% (7.0) 17.7% (9.2) Study 2A Control 2.5% (2.3) 8.9% (2.7) –6.5% (8.5) 8.3% (1.8) Training 4.9% (3.6) 4.9% (4.0) 7.9% (2.8) 2.9% (3.9)
We also asked whether individual differences in ability to detect conflict (before the intervention) was predictive of the success of the training intervention. That is, we asked whether reasoners who became correct respondents after the training intervention (i.e., improved respondents in our individual level classification) showed better conflict detection (i.e., stronger response doubt when giving incorrect answers on the conflict problems) before the training compared to reasoners who did not improve after training (i.e., biased respondents). We again used the difference in confidence ratings for incorrect conflict problem responses and correct no-conflict control problem responses as our index of conflict detection. Hence, the higher the conflict detection index, the more a participant doubted their incorrect answer (i.e., the higher the error detection).
For final responses, we observed a better conflict detection for the improved (M = 17.0%, SEM = 7.9) compared to the biased respondents (M = –0.2%, SEM = 2.2; t(22) = 2.06, p = .05, d = .70). The same trend was observed for initial responses although it did not reach significance (M improved = 7.4%, SEM = 4.4; M biased = –0.3%, SEM = 0.3; t(29) = 1.75, p = .09, d = .50). Note that, for both initial and final responses, reasoners from the biased group did not show a nominal detection effect (i.e., the conflict detection index was negative), showing that these participants did not doubt their incorrect conflict responses.
We tested whether the training could lead to a performance increase with untrained neutral ,problems, in which the description did not cue a stereotypical response. Figure 5 indicates that, except for a general pre- to post-intervention increase in accuracy, there was no clear sign of a training effect on neutral problems. Specifically, for both response stages (i.e., initial, and final), there was no significant Block * Group interaction (Final response: F(1,90) = 0.32, p = .57, ηg2 = .001; Initial response: F(1,88) = 0.79, p = .38, ηg2 = .004). In sum, participants tended to improve somewhat through passive repetitive exposure, but this improvement was not boosted by the training intervention. Hence, although our conflict problems results indicate that participants learned to favour the base-rate response over a conflicting stereotypical association, they did not learn to favour base-rates more generally (either intuitively or deliberately) per se.
Finally, we asked whether the training intervention led to performance increase on untrained reasoning problems with a different logical structure than the base-rate problems (i.e., CRT-like and conjunction fallacy problem).
Figure 5 shows the average performance. The ANOVAs revealed that performance remained stable after the intervention in both groups, for final responses (no significant Block * Group interaction: F(1,96) = 0.42, p = .52, ηg2 = .001) and for initial responses as well (no significant Block * Group interaction: F(1,91) = 2.00, p = .16, ηg2 = .01). This pattern was similar for each problem in isolation (see Supplementary Material Section D). Hence, the results suggest that the training effect is highly specific to conflict base-rate problems and does not lead to an increase in (intuitive or deliberate) performance on other untrained reasoning tasks.
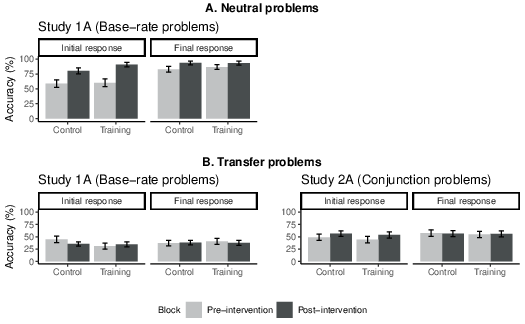
Figure 5: Average initial and final accuracy on neutral and transfer problems in Study 1A and 2A Error bars represent standard error of the mean (SEM).
Study 1A showed that our base-rate training intervention helped reasoners to intuit the correct response to conflict base-rate (but not other) problems. After training, participants favoured the response cued by the base-rates over a conflicting cued stereotypical response even when deliberation was minimized. In Study 2A, we tested the robustness of this intuitive application of a trained principle over a conflicting stereotypical association by examining whether it applied to the conjunction fallacy problem (Tversky & Kahneman, 1983). Here, a cued stereotypical association typically tricks people to violate the logical conjunction rule. Participants typically read a short personality sketch (e.g., “Perry, 36, has previously studied literature and likes poetry”). They are then asked to judge the probability of statements such as ‘(A) Perry is a carpenter’, and ‘(B) Perry is a carpenter and a novel writer’. The conjunction rule, one of the most fundamental laws of probability, holds that the probability of a conjunction of two events cannot exceed that of either of its constituents (i.e., p(A&B)≤p(A), p(B)). Thus, there should always be more individuals that are simply carpenter than individuals that are carpenters and in addition also novel writers. However, without training, people massively violate the conjunction rule and intuitively conclude that statement B is more probable than statement A based on the intuitive match with the stereotypical description (Andersson et al., 2020; Tversky & Kahneman, 1983). We tested whether an intervention in which the conjunction logic was clarified, helped people to (intuitively) disregard the tempting stereotypical association and avoid the conjunction fallacy.
Study 2A was roughly similar to Study 1A except that participants were not asked to provide a justification at the end of the experiment, and that they did not respond to neutral problems. Also, unlike in Study 1A, transfer problems consisted of CRT-like and base-rate problems. Only the specifics inherent to Study 2A will be presented.
The study design and research question were preregistered on the Open Science Framework (https://osf.io/674gk/). No specific analyses were preregistered.
Participants were recruited online, using the Prolific Academic website (http://www.prolific.ac/). Participants had to be native English speakers from Canada, Australia, New Zealand, the United States of America, or the United Kingdom to take part. As in Study 1A, 100 individuals participated (72 females, M = 35.7 years, SD = 11.8), 46 participants were randomly assigned to the training group and 54 to the control group. In total, 50 participants had secondary school as their highest level of education, and 50 reported a university degree. We compensated participants for their time at the rate of £5 per hour.
Note that in addition to the above 100 participants, there were also a total of 95 participants who started the experiment but could not complete it due to a coding error in the post-intervention block. These partial data were not analysed for the main study, but they are included in our publicly available data file.
The study consisted of three blocks presented in the following order: a pre-intervention, an intervention, and a post-intervention block. In total, each participant had to solve 10 problems during the pre-intervention block, namely, four conflict, four no-conflict, and two transfer problems (see below), and again the same number of problems during the post-intervention block. All the problems are presented in the Supplementary Material Section A.
We used the conjunction task format introduced by Andersson et al. (2020). All conjunction problems presented a short personality description of a character. This description consisted of the character’s name (e.g., “Emery”), his age (e.g., “30”), his previous studies (e.g., “robotics”) and his hobby/interests (e.g., “AI”). Next, the participants were given four response options and were asked to indicate which one was most probable. In the critical conflict items, one option presented a characteristic that featured an unlikely stereotypical association given the description (e.g., a cashier) and one option presented a conjunction of this unlikely and a likely characteristic (e.g. “a cashier and a computer hacker”). Two other filler options presented a characteristic that was very unlikely (e.g. “an international pop singer”) and a conjunction of two unlikely characteristics (e.g., “a cashier and a cheerleader”). The following illustrates the full problem format:
Emery, 30, has previously studied robotics and likes AI.Is it most probable that the described person is:
• A cashier
• An international pop singer
• A cashier and a cheerleader
• A cashier and a computer hacker
As with the base-rate problems in Study 1A, in addition to the four conflict problems we also presented four no-conflict control problems in each block. In the no-conflict problems, we replaced the singular unlikely response option with the option that featured the likely stereotypical association. Here is an example:
Emery, 30, has previously studied robotics and likes AI.Is it most probable that the described person is:
• A computer hacker
• An international pop singer
• A cashier and a cheerleader
• A cashier and a computer hacker
Reasoners will tend to select the statement that best fits with the stereotypical description (i.e., the most representative statement, see Tversky & Kahneman, 1983). Clearly, the fit will be higher for the likely than the unlikely characteristic with the conjunctive statement falling in between. Hence, on the no-conflict problems, stereotypical associations will no longer favour the conjunctive over the singular statement and participants are expected to show high accuracies (e.g., see De Neys et al., 2011).
Two sets of 16 unique items (8 pre-intervention and 8 post-intervention block items) were used for counterbalancing purposes. The conflict problems in one set were the no-conflict problems in the other, and vice-versa. Participants were randomly assigned to one of the two sets. Consequently, as with the Study 1A base-rate problems, none of the pre- and post-intervention conjunction problem contents was repeated within-subjects (i.e., participants saw a total of 16 different items with a unique stereotypical association).
The four response options were presented in random order. Note that Andersson et al. (2020), adopted the four options design to minimize the use of simple visual response strategies (e.g., “always choose the shortest answer”). As in the Andersson et al. study, selection of the filler options was overall very rare in our study (i.e., less than 12% of options). However, strictly speaking, participants who select the singular very unlikely option do not violate the critical conjunction rule. Given that we are interested in learning effects, selection of the very unlikely option can be considered a correct response. First, we ran all analyses while including the “very unlikely” option as correct and, second, while not including it. None of our conclusions were affected either way. To avoid a lengthy technical discussion, we report the analyses in which selection of the singular unlikely and likely response are both considered correct (i.e., correct answer = answer on which the conjunction fallacy is avoided). Figure S3 in Supplementary Material Section E gives a detailed overview of the selection frequency of each individual response option.
We created a pool of 60 potential items that contained translated and culturally adapted items from Andersson et al. (2020) and newly generated items that respected the same structure. To validate the stereotypical problem content, we ran a pilot rating study with 90 participants (60 female, mean age = 34.2 years, SD = 12.5). Participants were asked to rate how well each option matched the described person on a scale from 0 (not at all similar) to 10 (very similar). To select the most appropriate material, after an initial exploration, we picked items for which, in the conflict version, the combination of the unlikely and likely constituent was rated at a minimum of 3.5 and was rated higher than the unlikely constituent, while in their no-conflict counterpart, the likely constituent was rated at a minimum of 5 and higher than the combination of the unlikely and likely constituent. In addition, the relative option ranking needed to be maximally respected (e.g., very unlikely < unlikely < likely and unlikely combination < likely). We selected 32 items for which these differences were greatest. Among the ultimately selected items, the average ratings for the different response options were: Very unlikely option (M = 1.4, SD = 1.8); unlikely option (M = 2.0, SD = 2.2); unlikely and unlikely option (M =1.7, SD = 1.9); unlikely and likely option (M = 5.1, SD = 2.5); and likely option (M = 6.7, SD = 2.6). Half of the items were used for the current Study 2A, the other half was used for Study 2B. The full item set can be found in the Supplementary Material Section A.
In order to test for a potential transfer of the training effect, the same two race problems from the CRT2 (Thomson & Oppenheimer, 2016) as used in Study 1A and two long-format base-rate problems taken from De Neys and Glumicic (2008) were presented before and after the intervention.
For each of the base-rate problems, participants were first given the composition of a sample of 1000 people in which a person has been randomly drawn (e.g., “In a study, 1000 people were tested. Among the participants, there were 4 men and 996 women. Jo is a randomly chosen participant of this study”). Afterwards, participants were displayed a short personality description of this person and were asked to indicate to which group the chosen participant most likely belongs. Here is an example:
In a study, 1000 people were tested. Among the participants, there were 4 men and 996 women. Jo is a randomly chosen participant of this study.Jo is 23 years old and is finishing a degree in engineering. On Friday nights, Jo likes to go out cruising with friends while listening to loud music and drinking beer.
What is most likely?
• Jo is a man
• Jo is a woman
We opted for the long-format base-rate version because it did not require familiarizing participants with the short “single word” presentation format (e.g., as used in Study 1A) and strict timing was less critical for the exploratory transfer question.
Unlike in Study 1, we did not present “neutral” problems in Study 2A.
During the intervention block, the participants solved three additional conjunction problems without any cognitive or time constraint. In the training group, participants were given an explanation of the correct solution after having responded to each problem. Participants in the control group received no such explanation. The training explanations were based on the same general principles that were adopted for the base-rate training in Study 1A: The explanations were as brief and simple as possible, and each explanation explicitly stated both the correct response and the typical incorrect response. No personal performance feedback was given, and the explanation did not mention any formal mathematical equations or symbols (e.g., Venn-diagrams). The following example illustrates the explanation:
The correct answer to the previous problem is that Emery is most likely “a cashier”. Many people think that the answer is “a cashier and a computer hacker” but this answer is wrong.Most people base their answer on the description.
Sometimes the description can lead us to give a correct answer, but it can also lead us astray. Indeed, if we refer to Emery’s educational background and interests, it seems more realistic to think of Emery as “a cashier and a computer hacker” rather than merely “a cashier”. Simply because adding that Emery is also “a computer hacker” is more in line with our representation of someone who has studied robotics and likes AI, rather than Emery only being “a cashier”.
If one of the proposed answers had been “a computer hacker” then this reasoning would probably be correct. However, in this problem the option “a computer hacker” is presented together with another event, “a cashier”.
Now, he statistical probability that Emery is “a cashier” is higher than the probability that Emery is ”a cashier AND a computer hacker”.
This is because a single event is always more probable than the combination of this event with another one, whether or not you think it fits the description.
To illustrate this reasoning, consider the category corresponding to “a cashier”.
Some cashiers will also be computer hackers, others will not be computer hackers.
The group of people who are “cashier and computer hacker” is a subgroup of the group of all cashiers. Hence, there will always be more people who are simply “cashier” than people who are cashiers and in addition also computer hackers. Simply because one is a subgroup of the other, it will always be more probable that someone is a cashier rather than a cashier and a computer hacker.
We used the same two-response format as in Study 1A in which participants gave an initial response under load and time-pressure and were afterwards allowed to deliberate to give a final response. The response deadline in the initial response stage for the conjunction problems was set to 5 seconds based on a second pilot study. In this pilot study, 25 participants (16 female, mean age = 36.1 years, SD = 13.2) were presented the same problems with the same training intervention as in the main study but we adopted a classic “one-response” format in which they gave only one single answer and were not instructed to respond as fast as possible. The pilot study indicated that prior to the intervention, average overall response time was 8.5 seconds (SEM = 0.8) (and 9.5 seconds, SEM = 2.0, for correct responses). The 5 seconds deadline amounted to the fastest quartile (rounded to the nearest integer) of the unrestricted overall response time, which should create substantial time-pressure.
For the (lengthier) transfer base-rate problem, the time limit was set to 8 seconds based on the “one-response” response time for similar problems in the study from De Neys and Glumicic (2008).
The procedure was similar to Study 1A. The only difference concerned the problem structure and initial presentation timing. Each two-response conjunction trial started with the presentation of a fixation cross for 2000ms, followed by the character description (e.g., “Emery, 30, has previously studied robotics and likes AI.”) for 5000ms, and subsequently, by the visual matrix for the cognitive-load task for 2000ms. Afterwards, the full problem which featured the description, the question (e.g. “Is it most probable that the described person is:”), and the answer options, was displayed. At this point participants had 5000ms to choose a response. After 3000ms the background turned yellow to warn participants for the deadline. Figure 6 illustrates the full procedure.
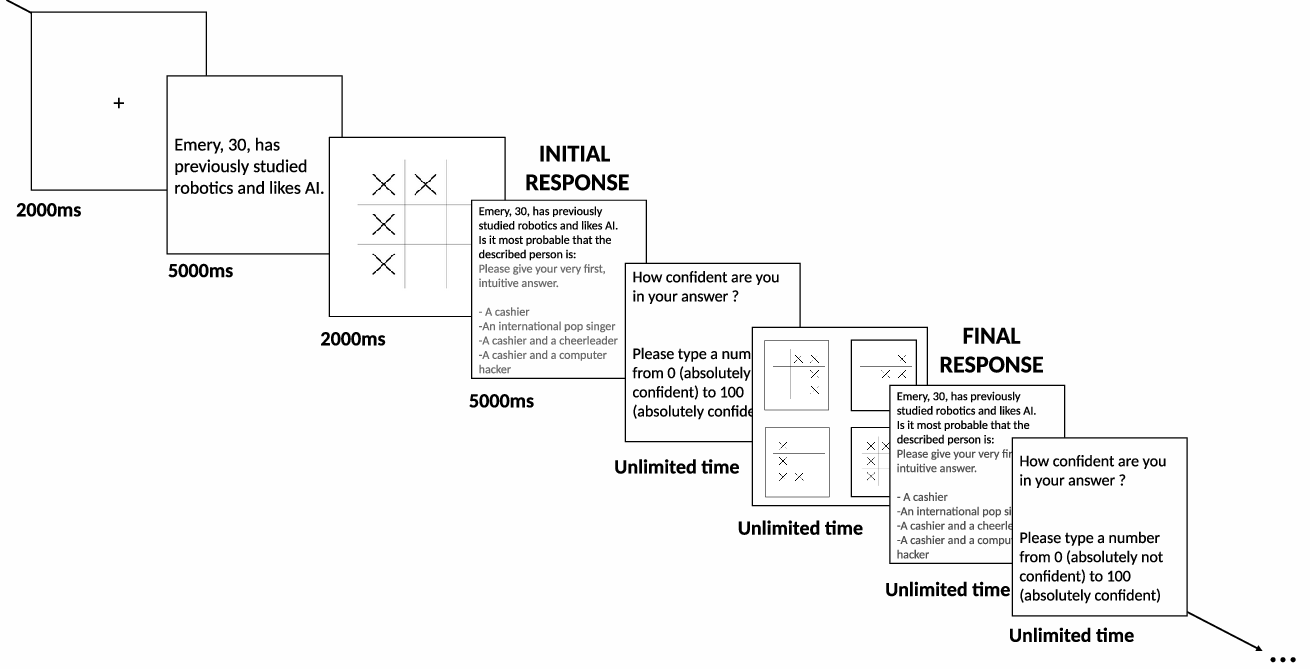
Figure 6: Time course of a complete two-response conjunction item.
Given the different nature of the transfer base-rate problems, we adopted slightly different timings and presentation format than for the initial response of the conjunction problems. The first part of the transfer base-rate problem, which presents base-rate information (e.g., “In a study, 1000 people were tested. Among the participants, there were 4 men and 996 women. Jo is a randomly chosen participant of this study”), remained on screen for 5000ms. Then, the visual matrix appeared for 2000ms and, next, the full problem was featured and remained on screen for 8000ms, during which participants had to select an answer. After 6000ms the background turned yellow to warn participants for the deadline.
We discarded trials in which participants failed to provide their initial answer before the deadline (2.0% of all trials) or failed to pick the correct matrix in the load task (9.2% of the remaining trials), and we analysed the remaining 90.8% of all trials. On average, each participant contributed 17.7 (SEM = 0.5) trials out of 20.
Final response accuracy, as shown in Figure 2, was very low before the intervention, in both the control and the training groups (respectively, M = 9.7%, SEM = 3.0, and M = 4.5%, SEM = 1.7). Performance increased after the intervention, but the improvement was larger for the training group (accuracy increase of M = 58.3 points, SEM = 6.3) than for the control group (accuracy increase of M = 4.2 points, SEM = 2.3). As in Study 1A , we again ran mixed-design ANOVAs with Block (pre- vs post-intervention) as a within-subjects factor and Group (training vs control) as a between-subjects factor. The Block x Group interaction was significant (F(1,98) = 72.25, p < .001, ηg2 = .21).
Performance on the initial response was very low before the intervention for both the control (M = 15.4%, SEM = 2.9) and the training group (M = 15.9%, SEM = 2.9). After the intervention, the training group showed a larger performance improvement (average increase of M = 44.4%, SEM = 6.5) than the control group (average increase of M = 2.5 points, SEM = 3.7); the ANOVA showed that the Block x Group interaction was significant, F(1,98) = 33.38, p < .001, ηg2 = .13. Hence, consistent with the findings of Study 1A, not only did training boost performance, it did so as early as the initial, intuitive response phase.5
As expected, in contrast with the conflict problems, accuracy on the no-conflict control problems was consistently high from the start with grand means of 77.6% (SEM = 1.8) for initial accuracy, and 79.4% (SEM = 1.7) for final accuracy (see Supplementary Material Section C). This again shows that participants were paying attention to the task and adequately read and processed the problem material.
Figure 3 (right panel) plots the direction of change distribution, for the conflict conjunction problems. As in Study 1A, for the training group the intervention led to a sharp decrease in “00” patterns (53.1% drop) which was specifically accompanied by a surge in “11” patterns (51.4% increase). These trends were far less pronounced in the control group. Critically, in the training group, the decrease in “00” patterns was again driven by an increase in “11” patterns (51.4%) rather than an increase in “01” patterns (8.7% increase). In line with Study 1A, these results support the idea that training helped participants intuit the correct solution strategy right away rather than correct an initial “erroneous” response through deliberation.
For each participant, on each conflict trial, we coded the direction of change from start to end of the experiment. We classified participants using the same categories as in Study 1A. As Figure 4 (right panel) shows, key trends were that, in the control group, the vast majority (90.7%) stayed biased throughout the experiment. However, in the training group most individuals improved after the intervention (65.2%), while only a minority (34.8%) remained biased. Among the improved respondents, 86.7% went from being “biased” before the intervention to “intuitor” after the intervention (i.e., producing a majority of “11” responses) while 13.3% went from being “biased” to “deliberator” (i.e., producing a majority of “01” responses). Hence, as in Study 1A, the individual level trends indicate that the intervention helped most participants to improve, allowing them to intuit correctly rather than to correct erroneous intuitions through deliberation.
As in Study 1A, we calculated a conflict detection index by contrasting confidence ratings for correctly solved no-conflict items to confidence ratings for non-solved conflict items. Contrary to the base-rate conflict detection analysis in Study 1A, there was no indication that the training boosted conflict detection (see Table 1). Both for initial and final response stages, the ANOVAs showed no significant interaction between Group and Block (for final response: F(1,70) = 2.29, p = .13, ηg2 = .016; and for initial response: F(1,73) = 1.44, p = .23, ηg2 = .01).
We contrasted the conflict detection index of participants who benefitted from the training with that of participants who remained biased. Here too, we failed to replicate the trends observed in Study 1A. Improved individuals did not show better conflict detection than biased ones. If anything, there was a trend in the opposite direction both for final responses (M biased = 7.2%, SEM = 3.4; M improved = –0.6%, SEM = 3.0; t(34) = 1.44, p = .16, d = .44), and for initial responses (M biased = 11.5%, SEM = 5.3; M improved = –0.5%, SEM = 3.0); t(20) = 1.98, p = .06, d = .68). Improved responders did not show any nominal detection effect (i.e., the conflict detection index was negative).
In sum, our findings with the base-rate and conjunction training were overall highly similar, except for the conflict-detection findings. Unlike in Study 1A and in Boissin et al. (2021, using bat-and-ball problems), where training tended to boost conflict detection and predicted training success, such trends were not observed with the conjunction problems of Study 2A.
One potential explanation is that the specific no-conflict conjunction format does not allow an accurate conflict detection measurement (e.g., Aczel et al., 2016; Scherer et al., 2017). That is, the conflict conjunction item presents a critical choice between an unlikely singular option and a conjunction of this unlikely and a likely option. It has been argued that the lowered confidence on conflict (vs. no-conflict) conjunction items will therefore not necessarily result from the fact that reasoners detect a conflict with the conjunction rule but rather from the fact that none of the options present an optimal stereotypical fit (i.e., by definition the likely option fits better with the description than the combination of the unlikely and likely option, Aczel et al., 2016). The finding that those reasoners who benefitted least from the intervention showed the nominally strongest confidence decrease might be consistent with such a superficial similarity account. Although speculative, if correct these findings lend credence to the claim that caution is needed when interpreting a lowered response confidence as a pure index of conflict detection on conjunction problems (Aczel et al., 2016; Scherer et al., 2017).
Figure 5 shows that there was no transfer effect of the conjunction training intervention. The ANOVAs revealed that the average performance was not boosted on untrained problems, neither for initial transfer responses (no significant Block * Group interaction: F(1,87) = 0.01, p = .91, ηg2 = .000) nor final transfer responses (no significant Block * Group interaction: F(1,88) = 0.45, p = .50, ηg2 = .002). The conclusions were similar for each transfer problem in isolation (see Supplementary Material Section D). Hence, the results indicate that the conjunction training effect is highly specific to conjunction problems and does not lead to an increase in performance on other untrained reasoning tasks.
Study 2A showed that the key Study 1A training results generalized to conjunction problems: After a training in which the conjunction logic was explained, participants managed to intuit the correct response. Their first, initial hunches were correct, and they no longer needed to deliberate to correct an initial erroneous answer. As with the Study 1A base-rate training, the training was task specific and did not transfer to untrained tasks.
In Study 1B, we tested the persistence of the Study 1A base-rate training effects. Two months after the completion of Study 1A, all the participants from the training group were invited to take part in a re-test. Study 1B used the same procedure as Study 1A, except that all base-rate problems had a different surface content. After the pre-intervention block, participants again went through a training intervention and completed a post-intervention block. This allowed us to explore whether an additional training session could further boost participants’ performance
The study design and research question were preregistered on the Open Science Framework ( https://osf.io/674gk/ ). No specific analyses were preregistered.
Thirty-four participants took part in Study 1B (out of the 50 participants from the training group in Study 1A; 24 females, M = 32.4 years, SD = 12.1). The sample consisted of five people who were classified as biased respondents in Study 1A, 10 who were correct respondents and 19 who were improved respondents. We compensated participants for their time at the rate of £7 per hour.
The material and the procedure were the same as in Study 1A. All the problems featured new contents (see Supplementary Material Section A).
Participants failed to provide their first answer before the deadline on 10.3% of all trials and failed to pick the correct matrix on the load task on 6.9% of the remaining trials. We discarded these trials and analysed the remaining trials (83.5 % of all trials). On average, each participant contributed 20.2 (SEM = 0.4) trials out of 24 to the analysis.
In order to test whether the training effect sustained over time, we compared performance of the post-intervention block of Study 1A (i.e., after the first training) to that of the pre-intervention block of Study 1B (i.e., two months later). We also tested whether performance in the pre-intervention block of Study 1B was higher than that in the pre-intervention block of Study 1A.
For each participant, we contrasted the average proportion of correct initial and final conflict responses, across Study 1A pre-intervention, Study 1A post-intervention, and Study 1B pre-intervention blocks.
First, we focus on final-response accuracies. Figure 7 shows that participants tended to give less correct responses two months after training (in the pre-intervention block of Study 1B; M = 80.6%, SEM = 6.0) than just after training (in the post-intervention block of Study 1A; M = 87.0%, SEM = 7.1), t(33) = 1.73, p = .09, d = .30. Nevertheless, they still gave more correct responses two months after training (M = 80.6%, SEM = 6.0) than before their first training (in the pre-intervention block of Study 1A; M = 52.9%, SEM = 7.2), t(33) = 3.87, p <.001, d = .66. Overall, these results indicate that, for final responses, the training effect sustained two months after the first training.
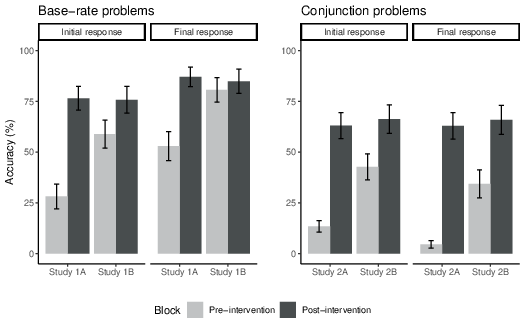
Figure 7: Average initial and final accuracy on conflict problems in the base-rate (pre- and post-intervention of Study 1A and Study 1B) and in the conjunction studies (pre- and post-intervention of Study 2A and Study 2B). Error bars are standard errors of mean (SEM).
The same trend was observed with initial responses. Despite a decrease in performance observed two months after training (Study 1B pre-intervention: M = 58.8%, SEM = 6.9), compared to just after training (Study 1A post-intervention: M = 76.5%, SEM = 5.8; t(33) = 3.50, p = .001, d = .60), performance remained better than before the first training (Study 1A pre-intervention: M = 28.2%, SEM = 6.1; t(33) = 4.97, p <.001, d = .85).
In Study 1B, we managed to reach 68% (34/50) of the Study 1A participants. To check for a possible attrition confound (e.g., subjects who did better in Study 1A were more likely to sign-up for Study 1B), we compared the Study 1A pre-intervention conflict problem accuracy of the subgroup of Study 1B participants (Initial response: M = 28.2%, SEM = 6.1; Final response: M = 52.9%, SEM = 7.1) to the accuracy of Study 1A pre-intervention of the participants who did not take part (but were invited) to the re-test (Initial response: M = 24.5%, SEM = 9.8; Final response: M = 54.7%, SEM = 11.7). Given that both groups showed very similar accuracy rates (Initial response: t(48) = 0.33, p = .74, d = –.10; Final response: t(48) = 0.13, p = .90, d =.04), it is unlikely that the Study 1B results are artificially boosted because of an attrition confound.
In conclusion, the training intervention effect was robust and sustained over time, for at least two months, for both initial ‘intuitive’ responses and final ‘deliberate’ responses. This result was also backed up by a direction of change analysis (see Supplementary Material Section F).
For completeness, no-conflict problem accuracies were also analysed. For both final and initial responses, performance remained near ceiling (see Supplementary Material Section C).
To get a more detailed picture, Figure 8 shows the proportion of each direction of change in Studies 1A and 1B, separately for those reasoners who were classified as Biased, Correct and Improved respondents based on the Study 1A classification. A visual inspection of the data shows that correct respondents (i.e., reasoners who answered correctly before receiving any training, n = 10) kept giving a majority of “11” response patterns two months after training, while biased respondents (i.e., reasoners who were still biased after Study 1A training, n = 5) remained biased two months later, mainly giving “00” response patterns. In comparison, improved respondents (i.e., reasoners who benefitted from the Study 1A training, n = 19) gave more “00” response patterns two months after the training intervention (11.0%) than just after it (1.8%), but far less than before training (47.4%). In addition, improved respondents produced more “11” response patterns (57.5%) two months after than just before Study 1A training (11.4%). Critically, even two months after the intervention, they were still more likely to produce “11” response patterns (57.5%) than “01” response patterns (30.3%), suggesting that the training provided in Study 1A led most participants to intuit the correct solution strategy over a period of at least two months. In sum, the results suggest that the training effect persisted over time for those who saw a performance increase after the training intervention of Study 1A.
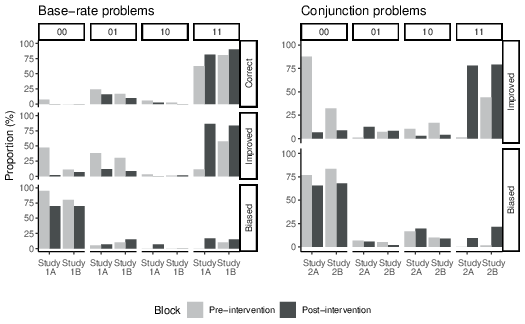
Figure 8: Proportion of each direction of change (i.e., 00 response patterns, 01 response patterns, 10 response patterns and 11 response patterns) for the conflict problems as a function of Block and Type of respondent in base-rate (Study 1A and Study 1B) and conjunction studies (Study 2A and Study 2B) for the participants who took part in the re-tests.
For completeness, consistent with Study 1A, we also presented additional neutral and transfer problems, collected confidence ratings and justifications. We had no a priori hypotheses about these data but the interested reader can find an overview in the Supplementary Material (Section G for neutral problems, Section H for transfer problems, Section I for confidence ratings). Also, the individual level of direction of change analysis for Studies 1A and 1B can be found in the Supplementary Material Section J.
In Study 1B, we also tested whether a second training could further improve performance. We compared performance across the pre- and post-intervention blocks of Study 1B, and across the post-intervention blocks of Study 1A and 1B.
First, we focus on final-response accuracies. Figure 7 shows that participants gave more correct responses after the training intervention of Study 1B (M = 84.9%, SEM = 6.0) than just before it (M = 80.1%, SEM = 6.1; t(32) = 2.3, p = .03, d = .39). However, the difference between Study 1B post-intervention performance (M = 84.9%, SEM = 6.0) and Study 1A post-intervention performance (M = 86.6%, SEM = 5.0) did not reach significance (t(32) = 0.45, p = .65, d = .08), suggesting that the second training did not succeed in further boosting performance.
With respect to initial-response accuracy, participants’ performance was again higher after the training intervention of Study 1B (M = 75.6%, SEM = 6.6) than just before it (M = 59.1%, SEM = 7.1; t(32) = 3.21, p = .003, d = .56), but it was almost identical to the level reached after the training intervention of Study 1A (M = 75.8%, SEM = 6.0; t(32) = 0.001, p =.99, d = .0001). In other words, the slight performance decrease observed two months after the first training was remediated with an additional training, but the second training did not boost performance beyond the (already high) level reached after the first training.
Note that the accuracy results presented here were also supported by a direction of change analysis (see Supplementary Material Section F). No-conflict problem accuracies can also be found in the Supplementary Material Section C. Performance was near ceiling for both final and initial responses.
We performed a direction of change analysis according to the type of respondent classification in Study 1A. Mirroring the overall accuracy effects, in both the “correct-respondent” and “improved-respondent” groups, the proportion of “11” response patterns was higher after the second training, compared to just before it (Figure 8) and again reached the high post-intervention level observed in Study 1A. Note that, for the “biased” group, there was a small trend towards slightly higher “01” responses after the second training but “11” responses did not improve.
Study 1B showed that our base-rate training intervention was persistent and had a long-lasting effect. Up to two months after training, improved participants continued to show an increased tendency to favour the response cued by the base-rates over a conflicting cued stereotypical response, both during the initial ‘intuitive’ and final ‘deliberate’ response stage. In Study 2B, we focused on the persistency of the conjunction fallacy training. Two months after the completion of Study 2A, all the participants from the training group were invited to take part in a re-test. As in Study 1B, we also explored whether an additional training session could further boost performance.
The study design and research question were preregistered on the Open Science Framework (https://osf.io/674gk/). No specific analyses were preregistered.
Forty-one participants took part in Study 2B (out of the 46 participants from the training group in Study 1A; 30 females and one neutral-gender, M = 37.9 years, SD = 12.4). The sample consisted of 15 people who were classified as biased respondents in Study 2A and 26 who were classified as improved respondents. We compensated participants for their time at the rate of £7 per hour.
The material and the procedure were the same as in Study 2A. All the problems featured new contents (see Supplementary Material Section A).
Participants failed to provide their first answer before the deadline on 6.4% of all trials and failed to pick the correct matrix on the load task on 8.5% of the remaining trials. We discarded these trials and analysed the remaining trials (91.5 % of all trials). On average, each participant contributed 16.1 (SEM = 0.3) trials out of 20 to the analysis.
Figure 7 (right panel) shows that, for the final response stage, trained participants gave less correct responses two months after training (in the pre-intervention block of Study 2B; M = 34.4%, SEM = 6.9) than just after training (in the post-intervention block of Study 2A; M = 62.9%, SEM = 6.5; t(39) = 4.50, p < .001, d = .71). Nevertheless, they still gave more correct responses than before their first training (in the pre-intervention block of Study 2A; M = 4.6%, SEM = 1.8; t(39) = 4.09, p <.001, d = .65).
The same trend was observed for initial responses. Despite a decrease in performance two months after training (Study 2B pre-intervention: M = 42.7%, SEM = 6.4), compared to just after training (Study 2A post-intervention: M = 63.0%, SEM = 6.4; t(38) = 3.07, p = .004, d = .49), performance remained better than before the first training (Study 2A pre-intervention: M = 13.5%, SEM = 2.8; t(38) = 4.16, p <.001, d = .67). In conclusion, in line with the Study 1B base-rate findings, the conjunction training intervention effect was robust and sustained over time, for at least two months, for both initial ‘intuitive’ responses and final ‘deliberate’ responses. This result was also backed up by a direction of change analysis (see Supplementary Material Section F).
Study 2B showed no evidence of artificially boosted performance because of an attrition confound. The Study 2A pre-intervention conflict problem accuracy for the initial response was actually higher for the participants who did not participate (but were invited) in the re-test Study 2B (M = 36.7%, SEM = 12.5) than for those who did participate (M = 13.4%, SEM = 2.7; t(44) = 2.63, p = .01, d = 1.25). The final response accuracy did not differ for the two groups (Study 2B participation: M = 4.5%, SEM = 1.8; no participation group: M = 5.0%, SEM = 5.0; t(44) = 0.10, p = .93, d =.05).
For completeness, no-conflict problem accuracies were also analysed. For both final and initial responses, performance remained at a stable high level throughout (see Supplementary Material Section C).
We contrasted the conjunction problem direction of change test and re-test data for those reasoners who benefitted from the first training to that for reasoners who did not benefit (i.e., “Biased” or “Improved” respondents6 in Study 2A). As Figure 8 (right panel) shows, biased respondents (i.e., reasoners who answered incorrectly before and after the first training, n = 15) kept giving a majority of “00” response patterns two months later. In comparison, improved respondents (i.e., reasoners who benefitted from the first training, n = 26) gave more “00” response patterns two months after the training intervention (32.3%) than just after it (6.7%), but far less than before training (87.5%). In addition, improved respondents produced more “11” response patterns (44.0%) two months after than just before Study 2A training (1.3%). Critically, even two months after the intervention, they were still more likely to produce “11” response patterns (44.0%) than “01” response patterns (7.0%), suggesting that the training provided in Study 2A led most participants to intuit the correct solution strategy over a period of at least two months. In sum, as with the base-rate problems, the results suggest that the conjunction training effect persisted over time for those who benefited from the first training intervention.
For completeness, consistent with Study 2A and Study 1B, we also presented additional transfer problems and collected confidence ratings. We had no a priori hypotheses about these data, but the interested reader can find an overview in the Supplementary Material (Section H for transfer problems and Section I for confidence ratings). Also, the individual level of direction of change analysis for studies 2A and 2B can be found in the Supplementary Material Section J.
We tested whether a second conjunction training (i.e., in Study 2B) could further improve performance. We compared performance across the pre- and post-intervention blocks of Study 2A, and across the post-intervention blocks of Study 2A and 2B.
Figure 7 (right panel) shows that participants gave more final correct responses after the training intervention of Study 2B (M = 65.8%, SEM = 7.1) than before it (M = 34.4%, SEM = 6.9; t(39) = 4.67, p < .001, d = .74). However, the difference between Study 2B post-intervention performance (M = 65.8%, SEM = 7.1) and Study 2A post-intervention performance (M = 62.9%, SEM = 6.5) did not reach significance (t(39) = 0.67, p = .50, d = .11).
With respect to initial-response accuracy, participants’ performance was again higher after the training intervention of Study 2B (M = 66.2%, SEM = 7.1) than just before it (M = 42.7%, SEM = 6.4; t(38) = 3.48, p = .001, d = .56), but it was almost identical to the level reached after the training intervention of Study 2A (M = 63.0%, SEM = 6.4; t(38) = 0.60, p =.55, d = .10). Overall, consistent with the Study 1B base-rate results, the second conjunction training remediated the slight performance decrease two months after the initial training, but it failed to boost performance beyond the initial training effect.
Note that the accuracy results presented here were also supported by a direction of change analysis (see Supplementary Material Section F). No-conflict problem accuracies can also be found in the Supplementary Material Section C.
We performed a direction of change analysis based on the type of respondent classification in Study 2A. Mirroring the overall accuracy effects, in the “improved-respondent” groups, the proportion of “11” response patterns was higher after the second training, compared to just before it (see Figure 8) and again reached the high post-intervention level observed in Study 2A. Note that, for the “biased” group, there was a small trend towards slightly more “11” responses after the second training but the effect was minimal.
The present studies showed that a short training intervention boosted reasoners’ performance on the notorious base-rate and conjunction fallacy problems. Despite massive biased responding before the training, once the underlying problem logic was explained, participants favoured the correct response over a conflicting cued stereotypical response. Critically, the use of a two-response paradigm established that this training effect was observed as soon as the initial, intuitive response stage. After the training, participants no longer needed to deliberate to correct an intuitive stereotypical response but generated the correct response immediately. This sound intuiting was persistent and was observed until two months after the initial training.
Our results confirm previous debias findings that suggest that people can learn to intuitively discard erroneous mathematical inferences (Boissin et al., 2021). The present findings establish that this also generalizes to reasoning tasks in which participants are faced with biasing stereotypical beliefs. Although debiasing reasoners’ beliefs is often considered difficult (e.g., Kaplan et al., 2016; Goel, 2022), our results suggest that a modest intervention can effectively replace stereotypical intuitions with logico-mathematical ones. We believe that these findings have important applied and theoretical implications. At the same time, however, care should be taken to avoid over- and misinterpretation. We discuss several key implications, potential misconceptions, limitations, and clarifications below.
Traditionally, it is assumed in the literature that debiasing interventions work by boosting deliberation and get people to better correct erroneous intuitions (Lilienfeld et al., 2009; Milkman et al., 2009). However, in many daily life situations reasoners will simply not have the time (or resources) to engage in costly deliberation. Hence, if our interventions only taught participants to deliberate more, they would be less than optimal (Boissin et al., 2021). As with most educational settings, we ultimately do not only want people to correct erroneous intuitions but to avoid biased intuitions altogether (Evans, 2019; Milkman et al., 2009; Reyna et al., 2015; Stanovich, 2018). The present study indicates that debiasing interventions in which the problem logic is briefly explained have such potential.
To avoid misinterpretation, it is important to highlight that our training did not lead to transfer effects. The training should thus not be conceived as a panacea that magically tunes the whole System 1 in one single stop. The training results generalized to base-rate and conjunction tasks, with overall similar effects across the two types of tasks, showing that participants can be trained to intuit correctly with different types of reasoning problems. However, training base-rates did not help to solve the conjunction fallacy or other unrelated problems, and vice versa. The training effects were task specific. Reasoners did not learn to intuit (or deliberate) better in general. They got better at the very specific problem they were trained at. This fits with the finding that existing debiasing or cognitive training programs are often task or domain specific (Lilienfeld et al., 2009; Sala & Gobet, 2019; but also see Morewedge et al., 2015; Trouche et al., 2014). Our key finding is that this task specific training can play at the intuitive level and is persistent. When we talk about “System 1 debiasing” it should be conceived at this task specific level.
At the same time, as one of our reviewers remarked, the current training was also not explicitly designed to maximize potential transfer. We opted for simple, short explanations of the principle at hand such as they have been used in previous studies (e.g., Boissin et al., 2021, Bourgeois-Gironde & Van Der Henst, 2009; Hoover & Healy, 2017; Purcell et al., 2020; Trouche et al., 2014). However, there is a wide literature on transfer that has pointed to various factors that can help to obtain learning transfer (e.g., the use of analogies, e.g., Gentner & Jeziorski, 1993; Gentner & Holyoak, 1997; Gick & Holyoak, 1987). These principles were not used in our current minimalistic interventions. Hence, we do not exclude that a more optimized training paradigm may give rise to transfer of debiasing effects. Our point is that these were not observed in the current study.
The observed non-transferability of the current training effect does help to rule out a potential alternative account for the training effect. In theory, it might be that the intervention simply cued a “reversed” heuristic. That is, participants would not start giving more weight to the base-rate or conjunction principle but simply deduce that they are being presented with counter-intuitive trick problems in which the right answer is always the opposite of the cued heuristic/stereotypical response (e.g., “pick what you don’t think it is”). This would lead to selection of the correct response on conflict problems. However, it should also easily transfer to the untrained transfer problems. In addition, such a “reversed heuristic” strategy should have resulted in floored performance on the no-conflict control problems (on which the heuristic response is also correct). The consistent high accuracies on our no-conflict control problems argue against this. In sum, the results suggest that participants learned to favour the trained logical base-rate or conjunction rule over a conflicting intuitive heuristic response. They did not show more accurate intuiting in general but neither started to blindly distrust intuitive reasoning per se.
As a side note, we believe that from an applied point of view, the task specificity of the current training is not necessarily problematic. The training is highly time and cost efficient. It literally takes less than 5 minutes and requires no human trainer intervention. The approach should be readily scalable. For example, one might put together a training battery with a range of different tasks/principles. In this sense the lack of transfer might be less problematic than it might be perceived at first sight. Even if we do not get people to intuit better on untrained tasks, we should manage to train them on those specific problems they most frequently encounter.
It is also important to stress that our results do not argue against a role of deliberation in debiasing per se. Our key finding is that once the base-rate or conjunction principle is briefly explained to reasoners, they can readily apply it to discard a conflicting stereotypical association and intuit correctly. But the fact that people no longer need to deliberately correct once the problem logic is clarified does not mean that deliberation plays no role in achieving this clarification. After all, during our intervention block in which the problem was explained to reasoners, they were not under time or dual task pressure and could take all the time they wanted to reflect on the explanations. Indeed, if one wants to explain a problem, it would be nonsensical to not let people reflect on it (Boissin et al., 2021). Hence, the point is not that training does not require deliberation. The point is that once the logical principle is clarified/trained, reasoners can readily apply it and no longer need to deliberate to correct their intuition.
At the theoretical level, the results have some interesting implications for our view on the nature of reasoning errors and bias. Our training intervention was short, lasting less than 5 minutes and simply illustrated the correct principle with a few examples. The fact that this nevertheless sufficed to remediate reasoner’s intuiting suggests that the bias does typically not result from a lack of knowledge or so-called “mind” or “storage” gap per se (e.g., De Neys & Bonnefon, 2013; Hoover & Healy, 2017, 2019; Stanovich, 2011). Obviously, it is unlikely that a five-minute training suffices to learn the underlying logical principles ex nihilo (Boissin et al., 2021). That is, the fact that the short explanation worked and allowed people to intuit correctly suggests that the critical knowledge was already implicitly there. It simply needed to be stressed. Once this was clarified, reasoners could apply it effortlessly.
The current findings may also fit with recent evolutions in dual process theorizing (De Neys, 2017; De Neys & Pennycook, 2019). Traditionally, reasoning in line with logical principles on classic bias tasks is believed to require a deliberate correction process in which the slow System 2 overrides an erroneous initial System 1 intuition (Evans & Stanovich, 2013; Kahneman, 2011). Hence, sound reasoning is believed to require demanding deliberation. Recent “dual process models 2.0” have questioned this assumption (e.g., De Neys, 2017). The idea is that bias tasks will evoke different types of intuitions. One of these will be based on stereotypical associations but another intuition will be based on elementary knowledge of the logical principle that is evoked in the task. It is hypothesised that throughout the school curriculum, people automatize the application of basic logico-mathematical operations to some degree (e.g., De Neys, 2012; Raoelison et al., 2021; Stanovich, 2018). However, both intuitions would have a different activation strength. Typically, for most reasoners the stereotypical intuition will dominate the logical one and lead to biased responding. In light of this framework, one could argue that the training helps to boost the activation of the logical intuition. By stressing the relevance of the principle, its activation strength will increase and can dominate the competing stereotypical intuition. Consequently, when people are faced with the same task afterward, the logical intuition will be favoured even without any further deliberation. While speculative, this framework presents a potential mechanism to make sense of the current findings. At the very least it should be clear that the results question the idea that reasoning bias results from a pure “mind gap” and that correct reasoning necessarily requires deliberation.
Our results indicate that after training participants can generate the correct, logical response intuitively. One may wonder whether these intuitive correct responses in the initial stage of the two-response paradigm have the exact same status as “proper” deliberate logical reasoning. Note that the Dual Process 2.0 models and the work on logical intuitions we referred to above do not entail this is the case (De Neys, 2017). It is assumed that respecting a logical principle can be done intuitively but this does not imply that the intuitive and deliberate response is generated through the same mechanism or has the same features (Bago & De Neys, 2017; De Neys & Pennycook, 2019). For example, Bago and De Neys (2019) already observed that although spontaneous sound reasoners’ first intuitive hunch is typically correct, they struggle to justify their correct hunches explicitly in the absence of further deliberation. In the current context this may lead to the critique that the training results are trivial. That is, one may argue that participants develop only a “pseudo-logical” heuristic such as “pick the largest number” or “select the singular item that forms part of the most attractive conjunction” without thinking through the conjunction or base-rate rule more generally. There are a couple of point to make here. First, we showed that the training does not lead to a blind or generic “reversed heuristic” in which participants simply learn to opt for the least intuitive answer on the task. Second, the learning was persistent up to two months. Third, the neutral base-rate items indicated that participants did not simply learn to favour the “largest” number but only showed this when base-rates conflicted with the description. Hence, the training did genuinely help participants to favour a response that aligned with a logical principle over a competing stereotypical intuition. However, this does indeed not imply that this responding can be equated with logical reasoning per se. The point is that we get participants to intuitively favour responses in line with different logical principles and persistently avoid biased responding. This is far from a trivial feat, but we do not contest that it might be possible to design more extensive training programs in which a more general logical mindset or type of thinking is cued (e.g., one that might transfer to other tasks).
To avoid confusion, we should also note that we used the dual process framework and labels (e.g.., “System 1”, “System 2”) in this paper as a communication tool to talk about the interaction between intuitive and deliberate reasoning processes. Dual process theories are sometimes opposed to single model theories (e.g., Keren & Schul, 2009; Kruglanski & Gigerenzer, 2011; Osman, 2004). Both single and dual process theories focus on the interaction between intuition and deliberation. But they differ concerning the question as to whether the difference between the two types of processing should be conceived as merely quantitative or qualitative in nature (see De Neys, 2021, for a recent review). The present results are orthogonal to this discussion. Our findings do not argue in favour or against the existence of qualitative differences. Hence, as one of our reviewers correctly implied, a single model conceptualization would capture the present findings equally well. Our choice for the dual process label is purely pragmatic here. We believe that the well-known labels are a handy vehicle to facilitate communication among scholars.
We believe that our work can serve as a proof-of-principle that clarifies the potential of training sound intuiting. However, the approach will need to be further validated, fine-tuned, and generalized. For example, although the intervention helped to remediate most reasoners it did not help all participants. Our re-test results (Study 1B and 2B) indicated that a second training two months later had little impact on participants who did not benefit from the first training. Obviously, one could try to boost the training efficacy with more immediate and/or frequent re-training. The optimal schedule remains to be explored here.
Perhaps more critically, one may also want to explore the generalizability to other reasoning tasks and domains. Our focus concerned classic reasoning tasks in which stereotypical associations conflict with logico-mathematical knowledge. However, these tasks have suboptimal ecological validity (Janssen et al., 2021; Politzer et al., 2017; Prado et al., 2020). Participants are tested in a somewhat artificial context and are faced with relatively mundane — albeit salient — stereotypical associations. People’s stereotypical associations in daily life settings (e.g., gender or racial discrimination in recruitment decisions, e.g., Isaac et al., 2009; impact on skin color or threat inferences, e.g., Payne, 2006) or their erroneous personal beliefs in other contexts (e.g., climate change, vaccine safety, conspiracy theories, or extreme political ideologies) might be more resistant to (intuitive) change. The generalizability of the current results to these situations clearly remains to be tested.
Training sound intuiting undeniably holds great promise (Evans, 2019; Milkman et al., 2009; Reyna et al., 2015). The present study indicates that this is not a naïve utopian goal. A training intervention can effectively replace stereotypical intuitions with logico-mathematical ones. This result suggest that our intuitions or “System 1” is more malleable than often assumed and that debiasing our System 1 is more than a theoretical illusion. Although it is important to keep the limitations of the current work in mind, we believe it should incite scholars to start exploring the possibility of System 1 debiasing more seriously.
Aczel, B., Szollosi, A., & Bago, B. (2016). Lax monitoring versus logical intuition: The determinants of confidence in conjunction fallacy. Thinking & Reasoning, 22(1), 99–117. https://doi.org/10.1080/13546783.2015.1062801
Andersson, L., Eriksson, J., Stillesjö, S., Juslin, P., Nyberg, L., & Wirebring, L. K. (2020). Neurocognitive processes underlying heuristic and normative probability judgments. Cognition, 196, 104153. https://doi.org/10.1016/j.cognition.2019.104153
Bago, B., & De Neys, W. (2017). Fast logic?: Examining the time course assumption of dual process theory. Cognition, 158, 90–109. https://doi.org/10.1016/j.cognition.2016.10.014
Bago, B., & De Neys, W. (2019). The Smart System 1: Evidence for the intuitive nature of correct responding on the bat-and-ball problem. Thinking & Reasoning, 25(3), 257–299. https://doi.org/10.1080/13546783.2018.1507949
Bago, B., & De Neys, W. (2020). Advancing the specification of dual process models of higher cognition: A critical test of the hybrid model view. Thinking & Reasoning, 26(1), 1–30. https://doi.org/10.1080/13546783.2018.1552194
Barbey, A. K., & Sloman, S. A. (2007). Base-rate respect: From ecological rationality to dual processes. Behavioral and Brain Sciences, 30(3), 241–254. https://doi.org/10.1017/S0140525X07001653
Boissin, E., Caparos, S., Raoelison, M., & De Neys, W. (2021). From bias to sound intuiting: Boosting correct intuitive reasoning. Cognition, 211, 104645. https://doi.org/10.1016/j.cognition.2021.104645
Bourgeois-Gironde, S., & Van Der Henst, J.-B. (2009). How to open the door to system 2: Debiasing the bat-and-ball problem. In S. Watanabe, A. P. Bloisdell, L.Huber, & Young (Eds.), Rational animals, irrational humans (pp. 235–252). Keio University Press.
Claidière, N., Trouche, E., & Mercier, H. (2017). Argumentation and the diffusion of counter-intuitive beliefs. Journal of Experimental Psychology: General, 146(7), 1052–1066. https://doi.org/10.1037/xge0000323
De Neys, W. (2006). Automatic-Heuristic and Executive-Analytic Processing during Reasoning: Chronometric and Dual-Task Considerations. Quarterly Journal of Experimental Psychology, 59(6), 1070–1100. https://doi.org/10.1080/02724980543000123
De Neys, W. (2012). Bias and conflict: A case for logical intuitions. Perspectives on Psychological Science, 7(1), 28–38. https://doi.org/10.1177/1745691611429354
De Neys, W. (2013). Heuristics, biases, and the development of conflict detection during reasoning. In H. Markovits (Ed.), The Development of Reasoning, pp. 130–147. Psychology Press. https://doi.org/10.4324/9781315856568
De Neys, W. (2014). Conflict detection, dual processes, and logical intuitions: Some clarifications. Thinking & Reasoning, 20(2), 169–187. https://doi.org/10.1080/13546783.2013.854725
De Neys, W. (2017). Bias, conflict, and fast Logic. In W. De Neys (Éd.), Dual Process Theory 2.0 (pp. 47–65). Routledge. https://doi.org/10.4324/9781315204550-4
De Neys, W. (2021). On dual- and single-process models of thinking. Perspectives On Psychological Science, 16(6), 1412–1427. https://doi.org/10.1177/1745691620964172
De Neys, W., & Bonnefon, J. F. (2013). The ‘whys’ and ‘whens’ of individual differences in thinking biases. Trends in Cognitive Sciences, 17(4), 172–178. https://doi.org/10.1016/j.tics.2013.02.001
De Neys, W., Cromheeke, S., & Osman, M. (2011). Biased but in doubt: Conflict and decision confidence. PLOS ONE, 6(1), e15954. https://doi.org/10.1371/journal.pone.0015954
De Neys, W., & Glumicic, T. (2008). Conflict monitoring in dual process theories of thinking. Cognition, 106(3), 1248–1299. https://doi.org/10.1016/j.cognition.2007.06.002
De Neys, W., & Pennycook, G. (2019). Logic, fast and slow: Advances in dual-process theorizing. Current Directions in Psychological Science, 28(5), 503–509. https://doi.org/10.1177/0963721419855658
De Neys, W., Rossi, S., & Houdé, O. (2013). Bats, balls, and substitution sensitivity: Cognitive misers are no happy fools. Psychonomic Bulletin & Review, 20(2), 269–273. https://doi.org/10.3758/s13423-013-0384-5
Ditto, P. H., Liu, B. S., Clark, C. J., Wojcik, S. P., Chen, E. E., Grady, R. H., Celniker, J. B., & Zinger, J. F. (2019). At least bias is bipartisan: A meta-analytic comparison of partisan bias in liberals and conservatives. Perspectives on Psychological Science, 14(2), 273–291. https://doi.org/10.1177/1745691617746796
Dujmović, M., Valerjev, P., & Bajšanski, I. (2021). The role of representativeness in reasoning and metacognitive processes: an in-depth analysis of the Linda problem. Thinking & Reasoning, 27(2), 161–186. https://doi.org/10.1080/13546783.2020.1746692
Evans, J. St. B. T. (2003). In two minds: Dual-process accounts of reasoning. Trends in Cognitive Sciences, 7(10), 454–459. https://doi.org/10.1016/j.tics.2003.08.012
Evans, J. St. B. T. (2008). Dual-processing accounts of reasoning, judgment, and social cognition. Annual Review of Psychology, 59(1), 255–278. https://doi.org/10.1146/annurev.psych.59.103006.093629
Evans, J. St. B. T. (2010). Intuition and reasoning: A Dual-process perspective. Psychological Inquiry, 21(4), 313–326. https://doi.org/10.1080/1047840X.2010.521057
Evans, J. St. B. T. (2019). Reflections on reflection: The nature and function of type 2 processes in dual-process theories of reasoning. Thinking & Reasoning, 25(4), 383–415. https://doi.org/10.1080/13546783.2019.1623071
Evans, J. S. B. T., & Over, D. E. (1996). Rationality in the selection task: Epistemic utility versus uncertainty reduction. Psychological Review, 103(2), 356–363. https://doi.org/10.1037/0033-295X.103.2.356
Evans, J. St. B. T., & Stanovich, K. E. (2013). Dual-process theories of higher cognition: Advancing the debate. Perspectives on Psychological Science, 8(3), 223–241. https://doi.org/10.1177/1745691612460685
Franssens, S., & De Neys, W. (2009). The effortless nature of conflict detection during thinking. Thinking & Reasoning, 15(2), 105–128. https://doi.org/10.1080/13546780802711185
Frederick, S. (2005). Cognitive reflection and decision making. Journal of Economic Perspectives, 19(4), 25–42. https://doi.org/10.1257/089533005775196732
Frey, D., Bago, B., & De Neys, W. (2017). Commentary: Seeing the conflict: an attentional account of reasoning errors. Frontiers in Psychology, 8, 1284. https://doi.org/10.3389/fpsyg.2017.01284
Frey, D., & De Neys, W. (2017). Is conflict detection in reasoning domain general ? In Proceedings of the Annual Meeting of the Cognitive Science Society, 39 (pp. 391–396). https://doi.org/10.31234/osf.io/2uf6g
Frey, D., Johnson, E. D., & De Neys, W. (2018). Individual differences in conflict detection during reasoning. Quarterly Journal of Experimental Psychology, 71(5), 1188–1208. https://doi.org/10.1080/17470218.2017.1313283
Gentner, D., & Holyoak, K. J. (1997). Reasoning and learning by analogy: Introduction. American Psychologist, 52(1), 32–34. https://doi.org/10.1037/0003-066X.52.1.32
Gentner, D., & Jeziorski, M. (1993). The shift from metaphor to analogy in western science. In A. Ortony (Ed.), Metaphor and thought(pp. 447–480). (Reprinted in modified form from B. Gholson et al (Eds.), The Psychology of Science and Metascience. New York: Cambridge University Press, 1989) Cambridge University Press. https://doi.org/10.1017/CBO9781139173865.022
Gick, M. L., & Holyoak, K. J. (1987). The cognitive basis of knowledge transfer. In S. M. Cormier & J. D. Hagman (Eds.), Transfer of learning: Contemporary research and applications(pp. 9–46). Academic Press. https://doi.org/10.1016/B978-0-12-188950-0.50008-4
Gigerenzer, G., Hell, W., & Blank, H. (1988). Presentation and content: the use of base rates as a continuous variable. Journal of Experimental Psychology: Human Perception and Performance, 14(3), 513–525. https://doi.org/10.1037/0096-1523.14.3.513
Goel, V. (2022). Reason and less: Pursuing food, sex, and politics. MIT Press.
Hogarth, R. M. (2010). Intuition: A Challenge for psychological research on decision making. Psychological Inquiry, 21(4), 338 353. https://doi.org/10.1080/1047840X.2010.520260
Hoover, J. D., & Healy, A. F. (2017). Algebraic reasoning and bat-and-ball problem variants: Solving isomorphic algebra first facilitates problem solving later. Psychonomic Bulletin & Review, 24(6), 1922–1928. https://doi.org/10.3758/s13423-017-1241-8
Hoover, J. D., & Healy, A. F. (2019). The Bat-and-ball problem: stronger evidence in support of a conscious error process. Decision, 6(4), 369. https://doi.org/10.1037/dec0000107
Isaac, C., Lee, B., & Carnes, M. (2009). Interventions that affect gender bias in hiring: A systematic review. Academic medicine: Journal of the Association of American Medical Colleges, 84(10), 1440–1446. https://doi.org/10.1097/ACM.0b013e3181b6ba00
Janssen, E. M., Velinga, S. B., De Neys, W., & van Gog, T. (2021). Recognizing biased reasoning: Conflict detection during decision-making and decision-evaluation. Acta Psychologica, 217 103322. https://doi.org/10.1016/j.actpsy.2021.103322
Kahan, D. M. (2016). The politically motivated reasoning paradigm, part 2: Unanswered questions. In Emerging Trends in The Social and Behavioral Sciences (pp. 1–15). American Cancer Society. https://doi.org/10.1002/9781118900772.etrds0418
Kahan, D. M. (2017). On the sources of ordinary science knowledge and extraordinary science ignorance. In K. H. Jamieson, D. M. Kahan, & D. A. Scheufele (Eds.), The Oxford handbook of the science of science communication, (pp. 35–50). Oxford University Press. https://doi.org/10.1093/oxfordhb/9780190497620.013.4
Kahneman, D. (2011). Thinking, Fast and Slow. Farrar, Strauss, Giroux.
Kahneman, D., & Frederick, S. (2002). Representativeness revisited: Attribute substitution in intuitive judgment. In T. Gilovich, D. Griffin, & D. Kahneman (Eds.), Heuristics and biases: The psychology of intuitive judgment, pp. 49–81). Cambridge University Press. https://doi.org/10.1017/CBO9780511808098.004
Kahneman, D., & Klein, G. (2009). Conditions for intuitive expertise: A failure to disagree. American Psychologist, 64(6), 515–526. https://doi.org/10.1037/a0016755
Kahneman, D., & Tversky, A. (1973). On the psychology of prediction. Psychological Review, 80(4), 237–251. https://doi.org/10.1037/h0034747
Kaplan, J. T., Gimbel, S. I., & Harris, S. (2016). Neural correlates of maintaining one’s political beliefs in the face of counterevidence. Scientific Reports, 6(1), 39589. https://doi.org/10.1038/srep39589
Keren, G., & Schul, Y. (2009). Two is not always better than one: A critical evaluation of two-system theories. Perspectives on Psychological Science, 4(6), 533–550. https://doi.org/10.1111/j.1745-6924.2009.01164.x
Kruglanski, A. W., & Gigerenzer, G. (2011). “Intuitive and deliberate judgments are based on common principles”: Correction to Kruglanski and Gigerenzer (2011). Psychological Review, 118(3), 522. https://doi.org/10.1037/a0023709
Kunda, Z. (1990). The case for motivated reasoning. Psychological Bulletin, 108(3), 480. https://doi.org/10.1037/0033-2909.108.3.480
Larrick, R. P., & Feiler, D. C. (2015). Expertise in decision making. In The Wiley Blackwell handbook of judgment and decision making (pp. 696–721). John Wiley & Sons, Ltd. https://doi.org/10.1002/9781118468333.ch24
Lilienfeld, S. O., Ammirati, R., & Landfield, K. (2009). Giving debiasing away: Can psychological research on correcting cognitive errors promote human welfare? Perspectives on Psychological Science, 4(4), 390–398. https://doi.org/10.1111/j.1745-6924.2009.01144.x
Mercier, H., & Sperber, D. (2011). Why do humans reason? Arguments for an argumentative theory. Behavioral and Brain Sciences, 34(2), 57–74. https://doi.org/10.1017/S0140525X10000968
Milkman, K. L., Chugh, D., & Bazerman, M. H. (2009). How can decision making be improved? Perspectives on Psychological Science, 4(4), 379–383. https://doi.org/10.1111/j.1745-6924.2009.01142.x
Miyake, A., Friedman, N. P., Rettinger, D. A., Shah, P., & Hegarty, M. (2001). How are visuospatial working memory, executive functioning, and spatial abilities related? A latent-variable analysis. Journal of Experimental Psychology: General, 130(4), 621–640. https://doi.org/10.1037/0096-3445.130.4.621
Morewedge, C. K., & Kahneman, D. (2010). Associative processes in intuitive judgment. Trends in Cognitive Sciences, 14(10), 435–440. https://doi.org/10.1016/j.tics.2010.07.004
Morewedge, C. K., Yoon, H., Scopelliti, I., Symborski, C. W., Korris, J. H., & Kassam, K. S. (2015). Debiasing decisions: Improved Decision making with a single training intervention. Policy Insights from the Behavioral and Brain Sciences, 2(1), 129–140. https://doi.org/10.1177/2372732215600886
Newman, I. R., Gibb, M., & Thompson, V. A. (2017). Rule-based reasoning is fast and belief-based reasoning can be slow: Challenging current explanations of belief-bias and base-rate neglect. Journal of Experimental Psychology: Learning, Memory, and Cognition, 43(7), 1154–1170. https://doi.org/10.1037/xlm0000372
Nisbett, R. E. (1993). Rules for reasoning. Psychology Press. https://doi.org/10.4324/9780203763230
Osman, M. (2004). An evaluation of dual-process theories of reasoning. Psychonomic Bulletin & Review, 6(11), 988 1010. https://doi.org/10.3758/BF03196730
Payne, B. K. (2006). Weapon bias: Split-second decisions and unintended stereotyping. Current Directions in Psychological Science, 15(6), 287–291. https://doi.org/10.1111/j.1467-8721.2006.00454.x
Pennycook, G., Fugelsang, J. A., & Koehler, D. J. (2015). What makes us think? A three-stage dual-process model of analytic engagement. Cognitive Psychology, 80, 34–72. https://doi.org/10.1016/j.cogpsych.2015.05.001
Pennycook, G., & Rand, D. G. (2019). Lazy, not biased: Susceptibility to partisan fake news is better explained by lack of reasoning than by motivated reasoning. Cognition, 188, 39–50. https://doi.org/10.1016/j.cognition.2018.06.011
Pennycook, G., Trippas, D., Handley, S. J., & Thompson, V. A. (2014). Base rates: both neglected and intuitive. Journal of Experimental Psychology: Learning, Memory, and Cognition, 40(2), 544. https://doi.org/10.1037/a0034887
Politzer, G., Bosc-Miné, C., & Sander, E. (2017). Preadolescents solve natural syllogisms proficiently. Cognitive Science, 41(S5), 1031–1061. https://doi.org/10.1111/cogs.12365
Prado, J., Léone, J., Epinat-Duclos, J., Trouche, E., & Mercier, H. (2020). The neural bases of argumentative reasoning. Brain and Language, 208, 104827. https://doi.org/10.1016/j.bandl.2020.104827
Purcell, Z. A., Wastell, C. A., & Sweller, N. (2020). Domain-specific experience and dual-process thinking. Thinking & Reasoning, 2, 239–267. https://doi.org/10.1080/13546783.2020.1793813
Raoelison, M., & De Neys, W. (2019). Do we de-bias ourselves?: The impact of repeated presentation on the bat-and-ball problem. Judgment and Decision making, 14(2), 170–178.
Raoelison, M., Keime, M., & De Neys, W. (2021). Think slow, then fast: Does repeated deliberation boost correct intuitive responding? Memory & Cognition, 49(5), 873–883. https://doi.org/10.3758/s13421-021-01140-x
Raoelison, M., Thompson, V. A., & De Neys, W. (2020). The smart intuitor: Cognitive capacity predicts intuitive rather than deliberate thinking. Cognition, 204, 104381. https://doi.org/10.1016/j.cognition.2020.104381
Reyna, V. F., Weldon, R. B., & McCormick, M. (2015). Educating intuition: Reducing risky decisions using fuzzy-trace theory. Current Directions in Psychological Science, 24(5), 392–398. https://doi.org/10.1177/0963721415588081
Sala, G., & Gobet, F. (2019). Cognitive training does not enhance general cognition. Trends in Cognitive Sciences, 23(1), 9–20. https://doi.org/10.1016/j.tics.2018.10.004
Scherer, L. D., Yates, J. F., Baker, S. G., & Valentine, K. D. (2017). The influence of effortful thought and cognitive proficiencies on the conjunction fallacy: Implications for dual-process theories of reasoning and judgment. Personality and Social Psychology Bulletin, 43(6), 874–887. https://doi.org/10.1177/0146167217700607
Stanovich, K. E. (2011). Rationality and the reflective mind. Oxford University Press.
Stanovich, K. E. (2018). Miserliness in human cognition: The interaction of detection, override and mindware. Thinking & Reasoning, 24(4), 423–444. https://doi.org/10.1080/13546783.2018.1459314
Stanovich, K. E., & West, R. F. (2000). Individual differences in reasoning: implications for the rationality debate? Behavioral and Brain Sciences, 23(5), 645–665. https://doi.org/10.1017/S0140525X00003435
Thompson, V. A., Prowse Turner, J. A., & Pennycook, G. (2011). Intuition, reason, and metacognition. Cognitive Psychology, 63(3), 107–140. https://doi.org/10.1016/j.cogpsych.2011.06.001
Thomson, K. S., & Oppenheimer, D. M. (2016). Investigating an alternate form of the cognitive reflection test. Judgment and Decision Making, 11(1), 99–113.
Trouche, E., Sander, E., & Mercier, H. (2014). Arguments, more than confidence, explain the good performance of reasoning groups. Journal of Experimental Psychology: General, 143(5), 1958–1971. https://doi.org/10.1037/a0037099
Tversky, A., & Kahneman, D. (1983). Extensional versus intuitive reasoning: The conjunction fallacy in probability judgment. Psychological Review, 90(4), 293–315. https://doi.org/10.1037/0033-295X.90.4.293
Verschueren, N., Schaeken, W., & d’Ydewalle, G. (2004). Everyday conditional reasoning with working memory preload. In Proceedings of the Twenty-Sixth Annual Meeting of the Cognitive Science Society. Lawrence Erlbaum Associates Inc.
Acknowledgment: This study was supported by the Idex Université Paris Cité ANR-18-IDEX-0001 and by a research grant (DIAGNOR, ANR-16-CE28-0010-01) from the Agence Nationale de la Recherche, France.
Copyright: © 2022. The authors license this article under the terms of the Creative Commons Attribution 4.0 License.
This document was translated from LATEX by HEVEA.