Judgment and Decision Making, Vol. 17, No. 4, July 2022, pp. 691-719
Drafting strategies in fantasy football: A study of competitive sequential human decision making
Michael D. Lee*
Siqi Liu#
|
Abstract: Drafting is a competitive task in which a set of decision makers choose
from a set of resources sequentially, with each resource becoming
unavailable once selected. How people make these choices raises basic
questions about human decision making, including people’s sensitivity to
the statistical regularities of the resource environment, their ability to
reason about the behavior of their competitors, and their ability to
execute and adapt sophisticated strategies in dynamic situations involving
uncertainty. Sports provides one real-world example of drafting behavior,
in which a set of teams draft players from an available pool in a
well-regulated way. Fantasy sport competitions provide potentially large
data sets of drafting behavior. We study fantasy football drafting behavior
from the 2017 National Football League (NFL) season based on 1350 leagues
hosted by the sleeper.app platform. We find people are sensitive to
some important environmental regularities in the order in which they draft
players, but also present evidence that they use a more narrow range of
strategies than is likely optimal in terms of team composition. We find
little to no evidence for the use of the complicated but well-documented
strategy known as handcuffing, and no evidence of irrational influence from
individual-level biases for different NFL teams. We do, however, identify a
set of circumstances for which there is clear evidence that people’s choices are strongly influenced by the immediately preceding choice made by a competitor.
Keywords: decision strategies, competitive decision making, sequential decision making, sports drafts, fantasy football
1 Introduction
Drafting is a competitive task in which a set of decision makers choose from a set of resources sequentially, with each resource becoming unavailable once selected. Drafts in the real-world originated and are best developed in the context of sport, in which a set of teams choose players to join their team from an available pool. In some cultures, these drafts begin in the schoolyard, with appointed captains taking turns to choose players to form teams. More consequential drafts occur in professional sports, including those for North American football, basketball, baseball, and hockey leagues, but also for other sports, such as Australian Rules Football. These drafts are carefully regulated, have high stakes, and are extensively analyzed and covered by both the teams and the media.
A closely-related type of draft is the one associated with fantasy sports. Fantasy sport has precursors as early as the 1950s, but took a modern form in the 1980s, and became widely popular once the internet facilitated online play (see Trippiedi, 2014, for a review). It is now a major recreational activity with the Fantasy Sports and Gaming Association estimating that 59.3 million Americans played in 2017 (FSGA, 2021). (Hyatt et al., 2013) argue that fantasy sport has fundamentally changed the way many fans relate to traditional sport, claiming “a new breed of sport consumer is emerging that values managing sport over spectating” (p. 189).
The basic idea of fantasy football is that people act as fantasy team managers for a roster of real-world players and play against other fantasy teams. The outcomes of the fantasy games are determined by the cumulative points earned by all assigned real-world players based on their statistics and performances during the real-world games.
A critical component of winning fantasy games is having a roster of good players. The initial roster for every team in a league is determined by a draft. Sports drafts are psychologically interesting because they provide a real-world example of a sequential competitive decision making process that is well defined and straightforward to measure. As a decision-making task, drafting can be conceived as having two key components. The first component is repeated preferential choice, in which stimuli with uncertain values are selected in a sequence. The goal is to maximize the overall value of the choices, subject to constraints. In this sense, drafting shares many of the features of other sequential human decision-making tasks like bandit problems (e.g., Banks et al., 1997,Daw et al., 2006,Lee et al., 2011a,MeyerShi, 1995) and optimal stopping problems (e.g., Kogut, 1990,Lee, 2006,SealeRapoport, 1997,SealeRapoport, 2000) that have been widely studied in both laboratory and real-world contexts (e.g., ChristianGriffiths, 2016,LeeCourey, 2021,Schulz et al., 2019). Most generally, it can be conceived as an example of a planning or goal-pursuit task (Callaway et al., in press,Prystawski et al., in press).
The second component involves competition with other players, and is especially focused on predicting the future choices of opponents. Understanding how people address this challenge requires understanding how information from social settings influences decisions (e.g. Schöbel et al., 2016), and more specifically how people use meta-cognitive and theory of mind capabilities in an adversarial social setting (e.g., BakerTenenbaum, 2014,Yoshida et al., 2008). Real-world tasks in which competition plays an important role, like negotiations (e.g., OlekalnsAdair, 2013), auctions (e.g., JankShmueli, 2010), and game shows (e.g., Lee et al., 2011b) have been also studied. These related tasks are important, both as applied problems and as sources of naturally-occurring behavioral data to inform basic research in human decision making.
Most previous research on draft behavior takes the form of attempts to develop optimization methods (BeckerSun, 2016,Fry et al., 2007,Gibson et al., 2010,Summers et al., 2007). This work takes a normative perspective, by viewing drafting as a sequential game. It can be viewed as a natural successor to the earliest work on drafts, which used game-theory analysis to characterize rational decision making (BramsStraffin Jr, 1979), but only considered very simple drafting situations with two or three teams having complete knowledge. As (Gibson et al., 2010), p. 599 note “[s]equential games conceptually generalize Markov decision processes and game theory, and consequently suffer the similar fate of general intractability as the number of participants and possible actions increase.” Accordingly, this line of research uses stochastic dynamic programming, mixed-integer programming, and other optimization methods. It also draws analogies to related “knapsack” optimization problems (Kellerer et al., 2004), such as political cabinet assignments or the distribution of estate assets, for which useful algorithms already exist.
Draft optimization methods necessarily incorporate some assumptions about opponent behavior. These range from assuming adherence to one of a set of simple strategies (BeckerSun, 2016,Fry et al., 2007,Summers et al., 2007) to more elaborate agent-based simulation (Gibson et al., 2010). None of these decision-making assumptions appear to be derived directly from modeling behavioral data, which leaves open the challenge of characterizing how people actually do make the decisions (Thomas et al., 2021). The only study of which we are aware that takes up this challenge in fantasy sport is provided by (Smith et al., 2006). These authors study basketball league fantasy decisions, analyzing text posted in online message boards, using methods from cognitive ethnography. They focus, however, on decisions made as part of the fantasy sport competition after the drafting activity to establish initial rosters is complete.
In this paper, we analyze drafting behavior, using real-world data from fantasy football leagues. We focus on the descriptive goal of trying to understand the basic decision-making strategies that people employ. In the next section, we describe the fantasy football drafting task in detail, characterize the most important statistical properties of the task environment, and discuss the basic challenges for effective decision-making strategies. We then describe the specific data we use, and provide a series of analyses. The first set of analyses focus on general properties of drafting order and roster compositions. The second set of analyses focus on whether people use a set of specific strategies. We conclude by discussing the implications of the results for understanding how people make drafting decisions.
2 Fantasy Football Task, Environment, and Strategies
2.1 Task
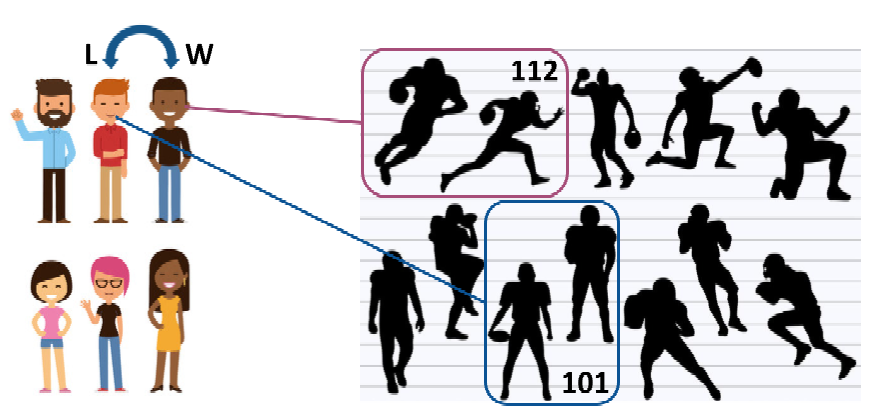
| Figure 1: The framework of fantasy football. The six people on the left form a fantasy league, and each has a roster of the NFL players shown on the right. The outcome of a fantasy game between two teams is determined by the real-world performance of the players in NFL games. |
The basic idea of one widely-played form1 of fantasy football is that a set of people form a league. Within the league, each person manages a team, which is comprised of a roster of players, who are the professional NFL players. Figure 1 shows an example with a league of six teams on the left.
Each week in the fantasy league, teams are paired to play games. They compete by assigning players from their rosters for that week to create an active roster. Figure 1 highlights two of the teams playing a game against each other and having a set of NFL players in their active roster. The active rosters are constrained by the roles of the players, which correspond to the positions they play: for example, quarterbacks, running backs, wide receivers, and so on in the NFL. The active roster has to satisfy constraints, usually in the form of how many players of each role are required or allowed.
To determine the outcome of a fantasy game, each player is associated with a point total, based on their performance — scoring touchdowns, completing passes, rushing yards, and so on — in the professional game they play that week. The winner of the fantasy game is the team whose active roster of players score the greatest total number of points. Figure 1 shows that one fantasy team’s NFL players scored a total of 112 points, and thus defeated the other fantasy team’s 101 points. The winning team is labeled “W” and the losing team is labeled “L”.
The task we focus on is the draft that determines the initial roster for every team in a league. This is conducted before the professional season starts. In the draft, each team has a set of predetermined positions in the draft order at which they can make picks. Over a set of draft picks, the teams in a league each choose the players who comprise their rosters. Fantasy football usually involves six roles: quarterback (QB), running back (RB), wide receiver (WR), tight end (TE), kicker (K), and defense and special teams (DS), which we call simply “defenses”. Although there are variations, a standard requirement for the active roster in fantasy football is to play one quarterback, two running backs, two wide receivers, one “flex” player who can be either a running back or wide receiver, one tight end, one kicker, and one defense.
The goal in each week’s fantasy game is to assign an active roster that maximizes the probability the team will score more points than the opponent. This means that the task in drafting is naturally conceived as picking a set of players that allow active rosters to be constructed that satisfy the role requirements, and will collectively score many points. We note that this conception does not strictly follow from the properties of fantasy football. Since the goal is to outscore opponents, it would also be sensible to draft in a way that lowers the scores of other teams. Such adversarial drafting would involve picking players that would otherwise benefit other teams in the league, even without the intention of including them in active rosters. As a concrete example, if an opposing team has not yet drafted a quarterback, and only one good one remains available, a potentially effective strategy would be to select that quarterback, without the intent of playing them in the active roster. Depriving the opponent of the opportunity to draft the quarterback may be the best way to increase the expected difference in fantasy scores with respect to that opponent.
We also note that the need to satisfy active roster requirements is not strict, since it is possible to continue to pick and trade players after the draft. Nonetheless, the idea that people aim to draft a roster consistent with active roster requirements and likely to score many points seems like a good starting place to understand drafting behavior.
2.2 Environment
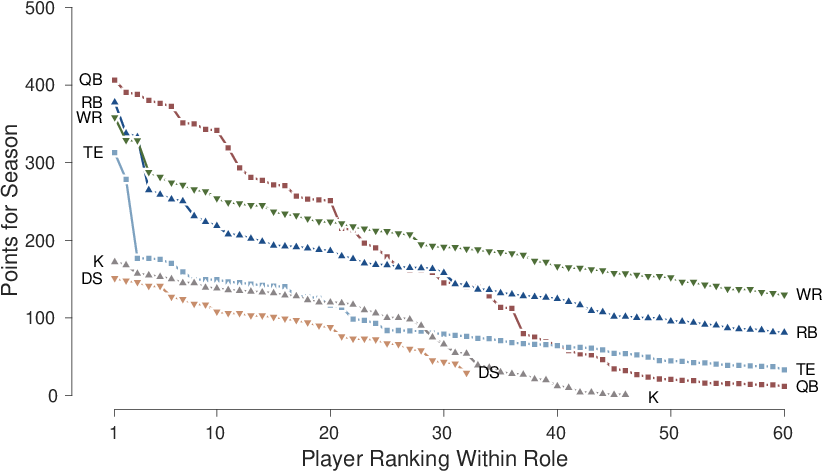
| Figure 2: The average total number of points scored by players in different roles over the course of the 2015 to 2020 seasons. Each line corresponds to a role, and ranks the players from best-performed to worst-performed. |
Figure 2 provides an analysis of the most relevant statistical properties of the fantasy football environment in terms of the drafting goal of maximizing points scored across roles. The average number of points scored over the 2015 to 2020 seasons for each role are shown, ordered from the best-performed player in that role downwards.2 There are only 32 defenses, corresponding to the 32 NFL teams, and only 46 kickers. For the other roles, the average scores for the top 60 picks are shown.
It is clear that running backs, wide receivers, and quarterbacks generally score more points than the other roles. More importantly, it is clear from the slopes of the lines that the decrease in points changes in different ways for different roles. The decrease in points scored for quarterbacks, kickers, and defenses is near linear. In contrast, there is a large initial decrease for running backs, wide receivers, and tight ends. Concretely, for example, the average difference between the best and fifth best players is 119 points for running backs, 77 for wide receivers, and 138 for tight ends, but only 30 for quarterbacks, 19 for kickers and 10 for defenses. After this initial large decrease, the points scored by running backs, wide receivers, and tight ends decrease near linearly, at about the same rate as kickers and defenses. The rate of decrease for quarterbacks is greater than the other five roles.
2.3 Strategies
The environmental regularities shown in Figure 2 need to be reflected in effective drafting strategies. The simplest possible greedy drafting strategy is picking the best available player in terms of expected scoring. This strategy would lead to drafting many quarterbacks, running backs, and wide receivers, but the requirement to construct an active roster consisting of every role discourages this approach.
Thus, the first major decision-making challenge in drafting is to balance drafting available players with high expected point totals against the need to distribute draft picks across roles, so that valid active rosters can be formed. The pattern of decrease in expected points provides a rationale for when to draft players of various roles. Because the goal is to construct an active roster that scores more points than the opposing team, the relative performance of players in each role is a key determinant of success. In other words, the absolute number of points a team scores is not the determinant of success, although it is correlated with it. The determinant of success is the probability that a team’s score will exceed that of their opponent. This means strategies should be sensitive to the relative rates of decrease. Perhaps the clearest example involves kickers. The value of kickers only decreases slowly for the top 20 or so players. This means every team in a league can likely draft a kicker that is relatively well performed at any stage in the draft, and there is no need to prioritize picking one. A similar argument holds true for defenses. More elaborately, it is rational to prioritize choosing the second-best tight end (rather than the third) over choosing the second-best running back (over the third), even though the running back is expected to score more points. This is because the expected point difference between the second-best and the third-best tight end is greater than the difference between the running backs.
The second major decision-making challenge relates to the uncertainty that comes from competition. Good drafting would be extremely challenging even in a static environment in which the available pool of players at any point in the draft is known. The fact that competitors remove resources dynamically, in ways that are only partially predictable, and are partly driven by the behavior of others, creates significant uncertainty. Managing that uncertainty depends on people’s abilities to make accurate predictions about the subsequent picks of their opponents.
Expert advice for drafting strategies (e.g., Fabiano, 2017) typically considers the first decision-making challenge, but not the second one. The guidance aims at prioritizing picking players with roles that provide the greatest fantasy points totals and for which expected value decreases quickly within the role. It does not incorporate considerations of how the picks of teams influence one another, beyond the basic fact that each pick removes a player from consideration. In other words, established draft strategies are largely based on normative considerations of maximizing expected point totals, without regard to the descriptive considerations of human decision making.
3 Data
3.1 Basic Properties
We use drafting data from the sleeper.app platform for the 2017 NFL season. Starting from a complete dump of all the leagues hosted on the platform, we did significant filtering and cleaning to restrict attention to leagues with at least six teams following a well-regulated draft structure. The sleeper platform allows for leagues to be supplemented with teams managed by bots. These bot teams use an auto-pick algorithm to draft a roster of players. We restricted our focus to leagues with significant majorities of human players. This resulted in a data set with 1350 leagues, containing a total of 12,590 teams, of which 11,932 are human players and 658 are bots. A total of 72% of the leagues have all human teams, 16% have one bot, 7% have two bots, and 4% have three bots. The sleeper platform also sometimes uses the auto-pick algorithm for human teams, such as when the person is not available in the time period a selection needs to be made. In our data set there are 188,426 selections made by human teams in total, of which 27% are auto-picks.
| Table 1: Number of leagues with different combinations of number of teams and number of players drafted per team. |
| | 14 players | 15 players | 16 players | 17 players | 18 players | 19 players | 20 players |
|
| 6 teams | 19 | 157 | 27 | 22 | 17 | 10 | 10 |
| 8 teams | 29 | 105 | 35 | 18 | 14 | 7 | 9 |
| 10 teams | 45 | 256 | 83 | 33 | 28 | 9 | 5 |
| 12 teams | 35 | 141 | 73 | 11 | 13 | 0 | 3 |
Different leagues have different numbers of teams and rosters of different sizes. Table 1 shows the distribution of leagues over the most common choices, which involves 6, 8, 10, or 12 teams each drafting between 14 and 20 players. These combinations account for 1214 out of the 1350 leagues in our data set. The most common roster size is 15 players and the most common league size is 10 teams. About 91% of the leagues played 13-game seasons, with the rest playing 14-game seasons.
3.2 An Example League
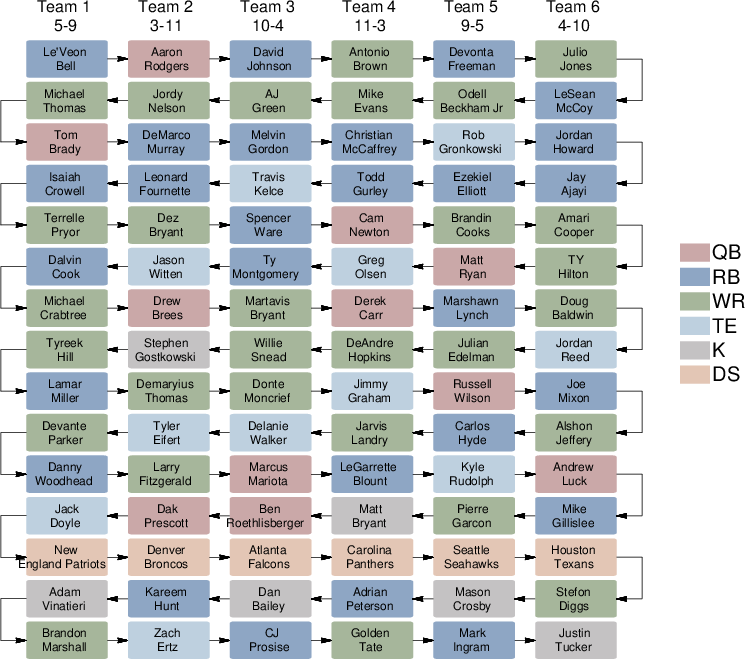
| Figure 3: An example of a league draft involving six teams each choosing 15 players. The teams correspond to columns. The players chosen are labeled in colored boxes with colors indicating their role. The draft follows a serpentine ordering indicated by arrows. The number of games won and lost within the league by each team is also shown. |
Figure 3 provides an example of the drafting process for one league with six teams selecting 15-player rosters and playing a 14-game season. Each colored box corresponds to a draft selection made by the team in that column. The player name is shown, and the color of the box indicates the role of the player. The same color coding for these six roles is used throughout this article.
The draft order shown in Figure 3 follows a “serpentine” (or “snake-like”) structure commonly used in fantasy football drafts. Team 1 picks first, followed by team 2, team 3, and so on, down to team 6. At this point, team 6 makes a second consecutive pick, and the order reverses, so that team 5 is next, followed by team 4, and so on. The win-loss record of each team is also shown. Team 4 was the best performed, winning 11 games and losing three. Team 2 was the worst performed, with three wins and 11 losses.
The picks shown in the specific draft in Figure 3 highlight a number of general patterns and issues, and motivate the analyses that follow. Most of the early picks are running backs and wide receivers, with the occasional quarterback and tight end also chosen. Each team eventually includes a kicker and defense in their roster, using later picks. These patterns relate to the general issues of how resources are competitively drafted to meet the task goals. It is interesting to note that, in the thirteenth round, team 1 chooses the New England Patriots defense. It is the first defense chosen by any team in the draft. Immediately following, every other team also drafts a defense. This behavior, consistent with herding, raises the issue of whether, when, and how psychological biases interfere with strategic drafting.
4 Drafting Order and Roster Composition
4.1 Players Drafted
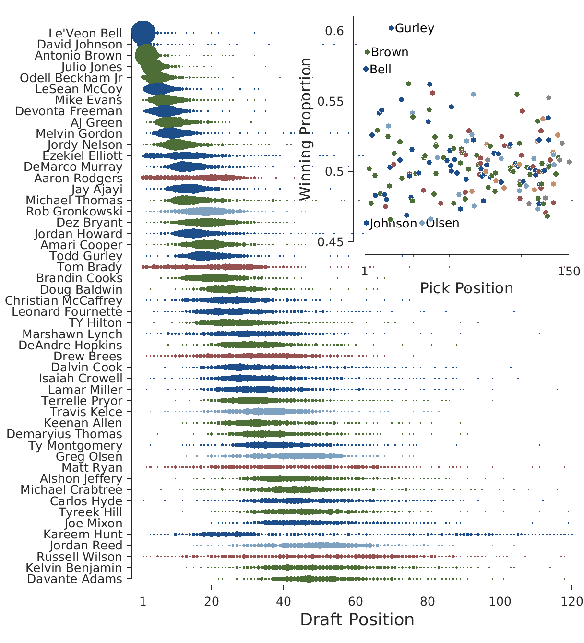
| Figure 4: The main panel shows the distribution of the position in the draft at which the top 50 players were picked, ordered from top to bottom in terms of average position. The inset panel shows the average winning proportion of teams who drafted the top 150 players. |
Across all leagues, there were 193 players who were selected by at least 50 teams, through human rather than auto-pick selection. Figure 4 shows the first 50 of these players, ordered from top to bottom by their average draft position. The distribution of draft positions in which each player was selected is shown. These distributions are fairly narrow for the top picks, indicating consensus across teams and leagues in the expected values of these players. The variability of the distributions increases significantly for players with lower expected value. For example, Le’Veon Bell was almost always selected in the first five positions, whereas Davante Adams was selected anywhere from about position 25 to 65.
Interestingly, the variability of draft position depends systematically on the player role. Quarterbacks and tight ends both show more variability in their draft position than running backs and wide receivers. For example, the first quarterback in the list, Aaron Rodgers, was selected between positions 1 and 40. In contrast, DeMarco Murray and Jay Ajayi, the running backs listed immediately before and after Rodgers, were selected, approximately, between positions 25 and 35. The broad distributions for quarterbacks and tight ends likely reflects differences in drafting strategies. As Figure 2 shows, the best quarterbacks score more points than any other player, but as quarterbacks are drafted, their values decrease less quickly than other roles. Strategies focused on absolute points would thus naturally aim to pick quarterbacks very early in a draft, whereas strategies focused on the relative changes in points would tend to pick quarterbacks later.
A few running backs and wide receivers also have broad distributions, some of which could even be viewed as bi-modal, that cannot be naturally attributed to differences in strategy. Ezekiel Elliot is a good example, having sometimes been chosen in the first ten draft positions, but more often chosen around positions 20 to 30. Kareem Hunt provides another possible example. There are different possible causes of bi-modality. One cause relates to the management of risk. Ezekiel Elliot was suspended on August 11, 2017, by the NFL for the first six games of the season. It was unclear whether this suspension would be enacted — it ultimately was not — so the bi-modality is naturally interpreted as arising from different beliefs about the likelihood of suspension. Kareem Hunt, in contrast, was a relatively unknown rookie player, having been taken in the third round of the preceding draft. The bi-modality in selection is thus better interpreted as differences in opinions about expected value.
The inset scatter plot in Figure 4 shows the relationship between the top 120 players in terms of average draft position and the win-loss record of the teams that drafted them.3 Each point corresponds to a player and is colored according to their role. A few players associated with especially high or low winning proportions are labelled. These players are all selected, on average, very early in the draft, which indicates that the most consequential decisions are made at the beginning of the drafting process. Players associated with especially good winning proportions are those who turned out to be clearly the best in their roles. Todd Gurley is the only player associated with a winning proportion greater than 0.6, presumably because he outperformed expectations, meaning he was available later in the draft than expected high performers like Le’Veon Bell and Antonio Brown. The two labeled players associated with low winning proportions, David Johnson and Greg Olsen, were both highly evaluated players who suffered serious injuries and played relatively few games.
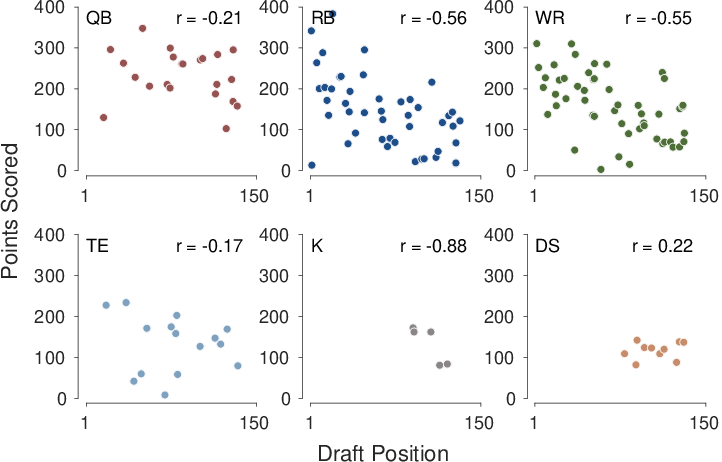
| Figure 5: The relationship between the average draft position and the total points scored for players in each role in the top 150 players. |
Figure 5 shows the relationship between the average draft position and the points scored by players, within each of the six roles. This provides one way of examining the calibration of decision making with the the most salient feature of the environment, in the form of expectations about points totals for each player. It seems clear there is good calibration for running backs and wide receivers, with correlations of -0.56 and -0.55. Expectations for quarterbacks and tight ends seem less well calibrated, although there is still likely some signal. The small samples for kickers and defenses make it difficult to assess the relationship, although there is some evidence of useful calibration for kickers but a lack of calibration for defenses. This is consistent with the view that defense scoring is highly unpredictable.4
Overall, these results suggest that if people have access to accurate enough predictions about players’ points totals that drafting can be considered a skillful decision-making process. This is important from a legal perspective, since the distinction between games of skill and chance is important in some jurisdictions (Holleman, 2006). It is also important because it shows people have at least some level of the useful information about players’ future performance needed to form effective drafting strategies.
4.2 Drafting Order
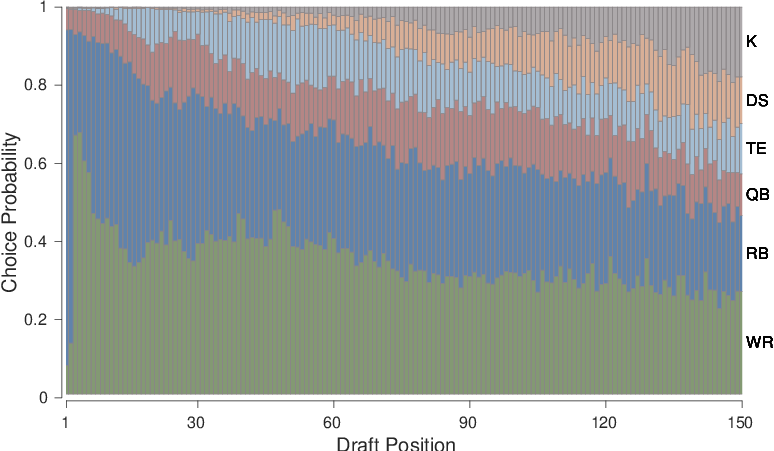
| Figure 6: The distribution of player roles selected at positions 1 to 150, aggregated over all human picks in all leagues. |
Figure 6 shows a basic regularity in drafting behavior involving the priorities given to drafting players with different roles. It shows, for all of the human picks made in all leagues, the proportion of players with each role drafted in the first position, second position, and so on, down to the 120th position. Early picks are primarily wide receivers and running backs with the occasional quarterback selection. Around the 20th position, tight end picks begin to be made. Between the 60th and 80th position, defense picks become more common. Finally, starting around the 80th position, kickers begin to be drafted.
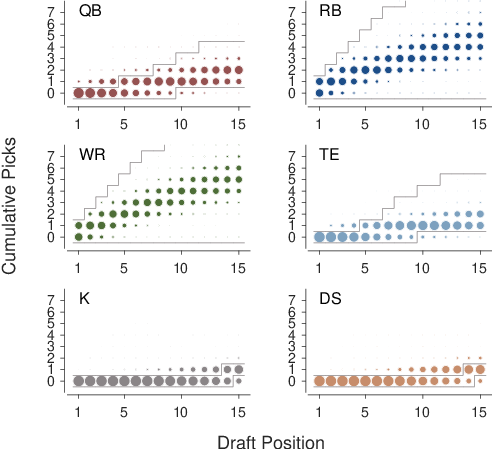
| Figure 7: The number of players with each role cumulatively chosen by a team after 1, 2, …, 15 picks. The black lines show upper and lower bounds based on an explicit drafting strategy for the 2017 season (Fabiano, 2017). |
Figure 7 provides an analysis of drafting order at the level of individual teams, rather than aggregated across teams and leagues. It relates to leagues with 15-player rosters. Results for other roster sizes are very similar, and are provided in the supplementary information. The areas of the circles show the probability of possible cumulative number of players of each role belonging to a team after each of their selections. For example, after the first selection, almost all teams have no quarterbacks, but after five selections about half of all teams have one quarterback while the other half still have none. Once all 15 selections have been made, teams have either one, two, or three quarterbacks, with two being the most common.
The solid lines in Figure 7 show upper and lower bounds on the cumulative number of players for each role selected by following the advice provided by (Fabiano, 2017). This advice is specified for each of 15 picks, but is in a verbal form that has some ambiguity. For example, it recommends choosing either a running back or wide receiver for the first four picks, and only allows other roles — emphasizing quarterbacks and tight ends — to be drafted at the fifth pick. It explicitly advises not choosing kickers and defenses until the final two picks. Accordingly, the solid lines often allow for wide ranges of possibilities, and most of the data meet the constraints. One interesting violation is that quarterbacks, tight ends, kickers, and defenses are sometimes picked earlier than recommended. The other interesting violation is that a few teams never pick a kicker or defense.
4.3 Team Composition
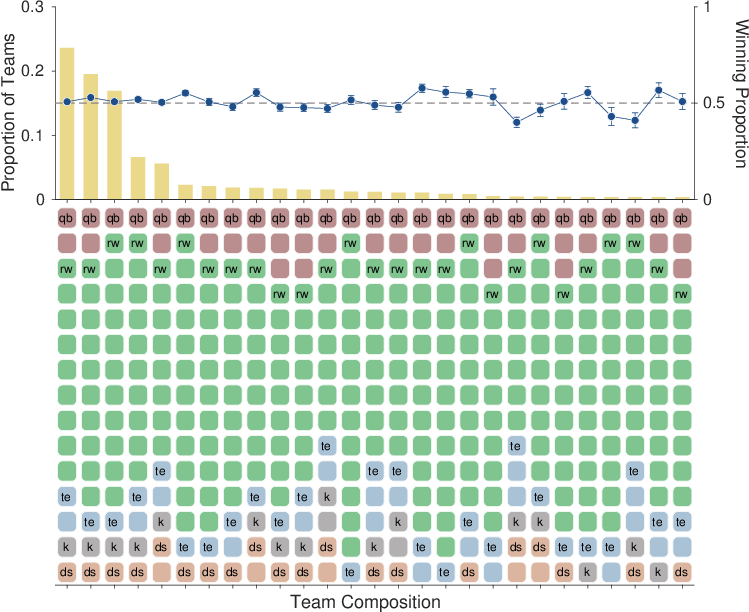
| Figure 8: The bottom panel shows the team compositions, with running backs and wide receivers treated as a single role, that constitute 95% of all teams. Compositions are shown by colored and labeled squares indicating the number of players with each role within the team. The compositions are ordered from most to least common from left to right. The yellow bars show the proportion of teams with each composition. The blue circles show the proportion of games won by teams with each composition, with error bars showing one standard error in each direction. |
Figure 8 considers the final compositions of teams, in terms of how many players of each role they include. For this analysis, we treat running backs and wide receivers as a single role. This makes sense conceptually, since these are the two most interchangeable roles, as made clear by the existence of the “flex” position on active rosters. It also makes the analysis tractable, by drastically reducing the number of distinct compositions.
The bottom panel of Figure 8 shows the 27 most common team compositions for leagues with 15-player rosters. Each composition is shown by a set of 15 colored patches, indicating the roles of the selected players. Collectively, these compositions constitute more than 95% of those found for teams in these leagues. The yellow bars in the upper panel shows the proportion of teams with 15-player rosters that had each composition. The three most common compositions account for about 60% of all teams. These compositions are consistent with Fabiano’s () drafting advice, as expected from the analysis shown in Figure 7. The three common compositions approximately match the distribution across the roles required for setting an active roster. They include players of each role, and many more running backs and wide receivers than the other roles.
The blue circles in the upper panel show the average proportion of games won by teams having each composition, with error bars representing one standard error of the mean in each direction. There are eight compositions that have winning proportions clearly above 0.50. None of these are among the first five common compositions, but many have the same feature of emphasizing the inclusion of many running backs and wide receivers at the expense of kickers and defenses. The five most common compositions performed worse, all winning close to 50% of games.
4.4 Discussion of Order and Composition
Collectively, the analysis of draft ordering and roster composition show that people adopt a fairly narrow range of approaches. There is a clear pattern in the probabilities with which roles are picked as the draft progresses, both at the aggregate and individual level. This uniformity results in a small number of roster compositions in terms of the distribution of roles. While the drafting strategies are broadly consistent with the environmental regularities shown in Figure 2, the homogeneity of people’s decision making cannot be entirely justified in terms of being well performed. Figure 8 shows that less-often used compositions outperform the most common ones, and these more successful compositions are systematically and interpretably different.
Some of the homogeneity could be the result of top-down explicit guidance that encourages these compositions. Figure 7 shows that the order in which teams draft roles are consistent with expert recommendations. The systematic differences between the best-performed compositions and the most common ones, however, suggests a complementary cause. The constraints on active rosters, in terms of the required distribution of roles, are highly salient. It would be natural for people to believe that a good distribution of roles in a roster should match the requirements of an active roster. This could be interpreted as a form of the representativeness heuristic (TverskyKahneman, 1974), in which people judge an instance (a roster composition) that is representative of a concept (the defined active roster distribution) to be a better instance.
An interesting question is whether the sorts of compositions suggested by Figure 8, emphasizing running backs and wide receivers over kickers and defenses, consistently lead to better performance. The effectiveness of any composition depends on the compositions of other teams in the same league, and so there can never be a guaranteed best composition. Nonetheless, it is an interesting possibility that compositions with many running backs and wide receivers may perform well across wide varieties of plausible distributions of compositions. It is less clear whether these currently fringe compositions would be stable if other teams adapted to use those compositions themselves.
5 Specific Strategies and Influences
5.1 The Handcuff Strategy
One relatively sophisticated strategy that is both promoted (Paulsen, 2017,Shauf, 2017) and criticized (Norton, 2011,Sanderson, 2021,Wiener, 2018) is known as handcuffing. The idea is to hedge against the risk of the best running back in a team being injured. Running backs often score the most fantasy points, but are often injured. When they are injured, NFL teams have an established “depth chart” that indicates which player will be the likely replacement. This player would then reasonably be expected to achieve good fantasy scores (although they will score few points if the injury does not occur, and they do not play). Thus, drafting both the star running back with an early pick, and their replacement with a much later pick, provides a fantasy team with insurance against injury.
| Table 2: Handcuff running back targets, listing the two players, how many leagues each was selected in, how many leagues both were selected in how, and how many times the same team selected both. The chance count measures how often the same team is expected to draft both by chance, given the two players are both selected within the league. |
| First Player | Second Player | First | Second | Both | Same | Chance |
|
| Adrian Peterson | Andre Ellington | 1204 | 7 | 5 | 0 | 0 |
| Devonta Freeman | Tevin Coleman | 1335 | 1090 | 1087 | 106 | 116 |
| Javorius Allen | Terrance West | 9 | 841 | 7 | 0 | 1 |
| LeSean McCoy | Mike Tolbert | 1338 | 8 | 8 | 1 | 1 |
| Christian McCaffrey | Jonathan Stewart | 1334 | 658 | 658 | 54 | 64 |
| Jordan Howard | Tarik Cohen | 1327 | 57 | 56 | 4 | 6 |
| Joe Mixon | Jeremy Hill | 1318 | 430 | 429 | 39 | 40 |
| Isaiah Crowell | Duke Johnson | 1317 | 744 | 738 | 73 | 73 |
| Ezekiel Elliott | Darren McFadden | 1334 | 1023 | 1023 | 183 | 109 |
| CJ Anderson | Jamaal Charles | 1258 | 543 | 536 | 57 | 51 |
| Ameer Abdullah | Theo Riddick | 1227 | 850 | 837 | 55 | 85 |
| Ty Montgomery | Aaron Jones | 1316 | 10 | 10 | 1 | 1 |
| Lamar Miller | D’Onta Foreman | 1329 | 174 | 172 | 28 | 16 |
| Frank Gore | Marlon Mack | 983 | 282 | 258 | 20 | 23 |
| Leonard Fournette | Chris Ivory | 1332 | 7 | 7 | 0 | 1 |
| Kareem Hunt | Charcandrick West | 1188 | 79 | 77 | 11 | 7 |
| Melvin Gordon | Austin Ekeler | 1336 | 1 | 1 | 0 | 0 |
| Todd Gurley | Malcolm Brown | 1336 | 5 | 5 | 3 | 1 |
| Jay Ajayi | Kenyan Drake | 1330 | 7 | 7 | 2 | 1 |
| Jerick McKinnon | Latavius Murray | 13 | 340 | 8 | 1 | 1 |
| Mike Gillislee | James White | 1130 | 565 | 530 | 36 | 50 |
| Mark Ingram | Alvin Kamara | 1245 | 255 | 252 | 25 | 22 |
| Orleans Darkwa | Wayne Gallman | 4 | 13 | 2 | 0 | 0 |
| Bilal Powell | Matt Forte | 1224 | 529 | 510 | 44 | 48 |
| Marshawn Lynch | Deandre Washington | 1334 | 138 | 138 | 17 | 12 |
| LeGarrette Blount | Wendell Smallwood | 987 | 147 | 131 | 9 | 11 |
| Le’Veon Bell | James Conner | 1337 | 125 | 125 | 30 | 11 |
| Thomas Rawls | Eddie Lacy | 731 | 864 | 576 | 44 | 56 |
| Carlos Hyde | Matt Breida | 1306 | 21 | 21 | 1 | 2 |
| Doug Martin | Jacquizz Rodgers | 1227 | 676 | 663 | 130 | 65 |
| DeMarco Murray | Derrick Henry | 1335 | 1019 | 1018 | 136 | 107 |
| Rob Kelley | Chris Thompson | 948 | 113 | 96 | 3 | 8 |
Table 2 presents an analysis testing whether the handcuffing strategy is used, for the 32 pairs of players identified as handcuff targets by the fantasypros.com site for 2017. Each row shows the pair of handcuffed running backs from a team. The columns then count in how many leagues each player was drafted, how often they were both drafted in the same league, and how often they were both drafted by the same team in the same league. All of these counts exclude the use of auto-drafting. The fourth row shows, for example, that LeSean McCoy was drafted by a team in 1338 leagues, his backup Mike Tolbert was drafted in 8 leagues, and both were drafted in 7 leagues. They were only once both drafted by the same team, as required by the handcuffing strategy. The final chance column counts how many times both would be expected drafted by the same team, by chance, given that both were drafted within the league. This is based on the number of teams in the leagues for which both players were drafted. For McCoy and Tolbert, it is once, consistent with the average number of teams in a league being about eight.
One way to test for the handcuffing strategy being used is to compare the observed counts of both players being drafted by the same team against the chance expectation. Table 1 highlights in yellow three pairs of players for which the observed counts seem to exceed chance significantly. Two of these cases, however, do not satisfy a stricter test of what should be expected for handcuffing. Both the Ezekiel Elliot and Darren McFadden pair and the Doug Martin and Jacquizz Rodgers pair involve two frequently drafted players. This is contrary to the basic idea that the second player is a backup, who should only be drafted in conjunction with the first. Following this logic, strong evidence for handcuffing requires a relatively high count for the first player, a much lower count for the second player, with nearly all instances of both being drafted involving the same team. The Lamar Miller and D’Onta Freeman pair and the Le’Veon Bell and James Conner pair more closely match this pattern. Even these best examples, however, involve many leagues in which both players were drafted, but not by the same time.
Despite the lack of widespread use of handcuffing, it is still possible to test its effectiveness. There are 793 teams that picked both players for one of the 32 pairs in Table 2. These teams won 51.04% of their games, compared to 50.56% for the teams that had no handcuff pairs. A hierarchical test of whether these winning proportions are the same or different (LeeWagenmakers, 2013, Ch. 9) found a Bayes factor of 4.2 in favor of sameness, using a Gaussian effect size prior on the difference between the means with mean zero and standard deviation 0.1. We interpret this as evidence that the handcuff strategy does not necessarily lead to better fantasy game performance.
5.2 Influence of Preceding Pick
The example league in Figure 3 provides a possible example of such a bias. As discussed earlier, once team 1 chose a defense, all of the other teams followed. It is possible that all of the teams were always planning to draft a defense in this round. It seems more likely that at least part of their drafting behavior is driven by the preceding selection. Once one team has switched to drafting a defense, a kind of herding behavior is observed.
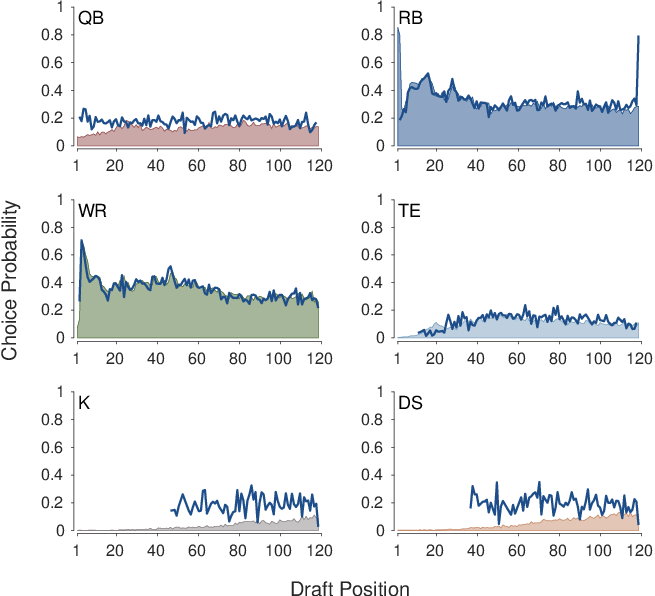
| Figure 9: The impact of the immediately previous choice on the current choice. Each panel corresponds to a playing role. The shaded area shows the expected probability a player with that role is chosen for each draft position. The solid line shows the expected probability a player with that role is chosen for each draft position, conditional on a player with the same role having been chosen by another team in the immediately previous position. |
Figure 9 provides an analysis of this herding behavior. Each panel corresponds to a role. The colored distributions show the overall probability a player with that role is chosen, not by auto-pick, in each position in the draft. This is essentially the same information shown in Figure 6. The blue lines show the probability a player with that role is selected in that position conditional on the same role having been chosen with the previous pick.5 For the running back, wide receiver, and tight end roles, there is close agreement between the unconditional and conditional probabilities. This is evidence that the previous team choosing a player in one of these roles does not impact the decision making of the next team. In contrast, for quarterback selections in about the first 20 draft positions, and for almost all kicker and defense selections, the conditional probability is clearly greater. This provides evidence that teams, for these situations in the draft, are influenced by the behavior of the team with the most recent pick.
Being influenced by an opponent’s previous pick does not seem to influence the overall winning proportions of teams. The average winning proportion of teams that drafted their first quarterback immediately after an opponent drafted a quarterback is 51.22%, while the average proportion for teams that did not follow their opponent in drafting their first quarterback is 50.12%. The hierarchical test of proportions provides a Bayes factor of 4.7 in favor of sameness. Similarly, the Bayes factors for kickers and defenses between copying and non-copying teams are 5.7 and 8.8, respectively, in favor of sameness.
5.3 Influence of NFL Teams
As mentioned earlier, (Smith et al., 2006) conducted an ethnographic analysis of user’s messages in the context of deciding on active rosters in fantasy basketball leagues. They argued that team loyalty formed the basis of heuristics that were used to construct these rosters. In the draft context, the use of this heuristic would lead users to select players from the NFL team they support. The same idea is discussed by (Kotrba, 2020) and (Summers et al., 2007) incorporate a “superfan” strategy that assumes people only draft from a favorite team in their draft optimization method. It is possible to construct a rationale for this strategy. Drafting players from the same NFL team generally increases the variance of the points scored each week, because the performance of the players are linked. A quarterback and wide receiver both receive points, for example, if the quarterback throws a touchdown pass to the wider receiver. Increasing the variance can be a sensible approach for teams with lower expected scores than their opponents. An alternative interpretation, which is probably more likely, is that people draft many players from a favorite team, with goals other than just winning fantasy games.
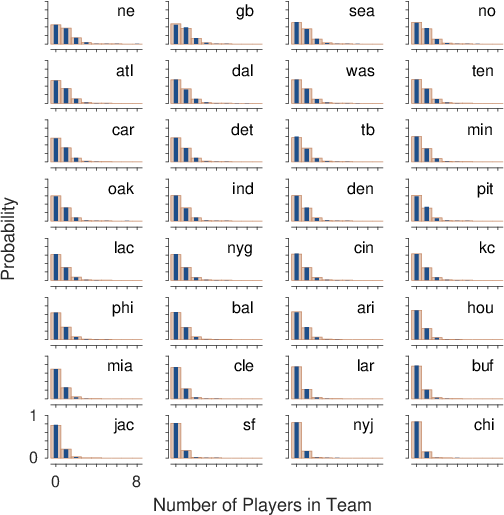
| Figure 10: The distribution of the number of players from the same NFL team drafted by fantasy teams with 15-player rosters. Each panel corresponds to an NFL team. The blue bars show the observed distribution of players from that NFL team drafted by fantasy teams. The orange bars show the chance distribution, based on the base-rate with which players from that NFL team were chosen by all fantasy teams. |
One way to test for this strategy is to examine the distributions of the number of players fantasy teams have from each of the NFL teams. A large number of players coming from the same NFL team would be evidence for the use of the strategy. Figure 10 presents this analysis for teams with 15-player rosters.6 Each panel corresponds to an NFL, ordered from top-left to bottom-right in terms of the base-rate with which players from that NFL team are selected. The blue bars show the distribution of the number of players from that NFL team drafted by the same fantasy team. The orange bars show the chance distribution, following the base-rate for that NFL team. It is clear that, for all of the NFL teams, there is very close agreement between the observed and chance distributions. There is no evidence that individual fantasy teams regularly draft more players from the same NFL team than would be expected by chance. The results for rosters with different numbers of players are extremely similar, and are provided in the supplementary material. The conclusion that people do not show a preference for players on the basis of NFL teams is consistent with Kotrba’s () finding, in a different fantasy sport context, that “users choose their squads primarily based on players’ past performances” rather than through team loyalty.
5.4 Discussion of Strategies and Influences
The analysis in Table 2 provides little evidence, regardless of the number of teams in a league, that there is widespread adoption of the handcuffing strategy. There is also no evidence it would be effective if adopted, with handcuffed and non-handcuffed teams winning a very similar proportion of games. There is also no evidence people follow a strategy based on favorite NFL teams. These are two very different strategies. Handcuffing is sometimes promoted as an expert strategy, and has at least face validity as a clever approach. Relying on favorite teams is often discussed as a strategy people might use against their best interests. Both, however, are explicit strategies in the sense that their existence and use is discussed.
We did find evidence for a different sort of strategy that is far more implicit. This relates to the tendency to follow an opponent’s choice of role for early quarterback picks, and for all kicker and defense picks. This strategy could be viewed as an undesirable bias, although it does not appear to impact the overall performance of teams significantly, It is, nonetheless, a good example of how decision making is influenced by the competitive social setting of drafts.
6 General Discussion
The ability to make sequential decisions under uncertainty to meet goals is a basic challenge for any cognitive system. Drafting provides a real-world task that requires this ability. Features of the drafting task include the uncertainty about the value of the players who serve as resources, statistical regularities that describe the differences between roles, and the involvement of opponents in the resource depletion. Given the lack of previous analysis of people’s drafting behavior, our main goal was to begin to describe how people meet the challenge of executing a goal-oriented plan in a competitive social setting.
6.1 Observed and Good Drafting Strategies
Our analyses of the orders in which players are drafted and the composition of rosters show significant homogeneity, suggesting that people continue to execute a narrow range of strategies throughout a draft. The one clear exception is the strong tendency for people to be influenced by an opponent’s immediately preceding pick, for some roles at some stages of the draft. But overall, there is remarkable consistency in the order of draft picks and the compositions that result. It is less clear that this homogeneity is appropriate. The orders in which roles are drafted match expert advice which, in turn, is well adapted to the important statistical regularities of the environment shown in Figure 2. The analysis of roster compositions in Figure 8 suggests that alternative drafting strategies may be more successful. One interpretation is that this is a form of groupthink (Janis, 1971). Obviously it is not the classical collaborative form of the groupthink phenomenon. There could, however, be an incentive for in-group cohesion in the sense that people want to draft in a way that respects established norms, which leads to a form of herding. Failing to draft a kicker or defense, for example, would quickly be detected as an unusual strategy. (Giardino, 2017) explicitly discusses this possibility in the context of fantasy football drafting. Future work should examine if the fringe strategies we observed are successful beyond the one platform and one year we examined.
There is no straightforward answer to the question of which drafting orders and roster compositions are best. Good rosters are ones that are robustly-well performed across a distribution of likely opponent behavior. This situation is reminiscent of the one provided by the game-theoretic study of the evolution of strategies in prisoners dilemma tasks (e.g. AxelrodHamilton, 1981). One lesson from that literature is that the effectiveness of any drafting strategy depends on the strategies of other teams in the same league, and so there can never be a guaranteed optimal strategy. Another lesson is that a good strategy needs to be robust across wide varieties of plausible distributions of strategies. Good strategies also need to be stable, in the sense that if they became the accepted wisdom, they would continue to perform relatively well. It would be particularly interesting to know how roster compositions that emphasize picking running backs and wide receivers over kicker and defenses perform in leagues where every team has this sort of composition.
6.2 Future Work
6.2.1 Draft Order
One issue that we did not address relates to the order in which teams make picks in the draft. There are clear advantages for teams that have the first picks in a draft. As Figures 5 and 6 show, these picks allow players who score more points and can lead to greater winning proportions to be selected. An interesting additional consideration for where teams are located in the draft order arises because of the serpentine structure of the draft. This structure has the consequence of manipulating across teams the number of picks made by opponents between successive team’s picks. The first and last teams in the draft alternate between making consecutive picks and waiting for every other team to make two selections before they pick again. Teams in the middle of the draft order, in contrast, always wait for every other team to make one pick. In the fantasy football media, the relative merits of different locations in the draft order is debated and measured (e.g., Schandl, 2021), and there are attempts to specify different drafting strategies depending on a team’s position in the draft order (Knox, 2021).
This variability between picks raises the psychological issue of the range with which people are able to incorporate inferences about other teams’ behavior into their decision making. There is some work in psychology and game theory aiming to infer the depth to which opponents can look ahead from behavioral interactions, often using “level-k” models (e.g., Nagel, 1995,Shapiro et al., 2014,StahlWilson, 1995). If, as seems likely, people’s ability to make forward predictions is less than the maximum number of intervening opponent picks, this should have consequences for how effectively drafting can be adapted by different teams.
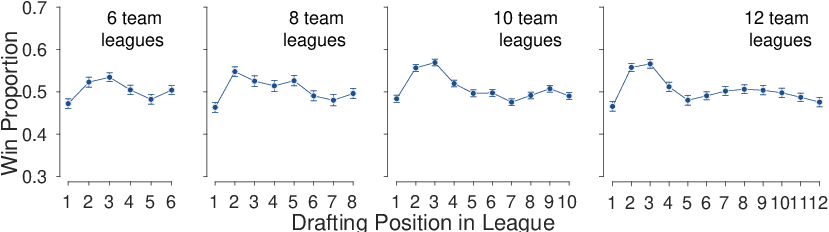
| Figure 11: The winning proportion for teams depending on their drafting positions within the league, for leagues with 6, 8, 10, and 12 teams. |
Figure 11 shows winning proportions of teams according to their order of drafting, for leagues with 6, 8, 10, and 12 teams. It seems clear that in all of these cases the teams drafting early positions did better than teams drafting late in the order ones, with the exception of the first position. Surprisingly, the team that drafted first performed relatively poorly. We did not pursue this analysis, because it is potentially too dependent on the idiosyncrasies of a season. For example, if the first team to draft regularly picks a player who is then injured, their performance will be poor for reasons not systematically related to draft order. While all of our analyses will benefit from considering data from other seasons, we think this analysis is one that needs to be shown to be replicable across seasons before it is interpreted.
6.2.2 Measuring Plans
Another interesting line for future work is to consider introducing some controlled experimentation to measure people’s initial plans. An advantage of using fantasy league behavior data it is naturally occurring, and produced by motivated decision makers, rather than being subject to experimenter demands in a more controlled setting (MummoloPeterson, 2019,Orne, 1962,WeberCook, 1972,Zizzo, 2010). Previous studies of human decision making using draft behavior, although involving real rather than fantasy drafts, have emphasized this advantage (BergerDaumann, 2021,MasseyThaler, 2013).
Nevertheless, there is merit in combining experimental measurement with real-world behavior. Most people prepare for a fantasy football draft, with a plan for the order in which roles are drafted, and information about the expected performance of each player. This plan needs to adapt during the drafting process, as opponents make picks that change the available players. von Moltke’s () essay on military strategy said “No plan of operations extends with any certainty beyond the first encounter with the main enemy forces” which has the contemporary streamlined form “No plan survives first contact with the enemy.” Mike Tyson’s variation “Everyone has a plan until they get punched in the mouth" conveys the challenge more dramatically.
Thus, a basic psychological question is whether drafting plans are overridden by biases enabled by the dynamics of the draft. It should be possible to assess people’s initial plans — the role draft order they intend to use, and the player evaluation they are relying on — experimentally before a draft. Combining that information with the actual draft behavior, which allows deviations from plans to be measured with some level of fidelity, should lead to a deeper understanding of human decision making in drafting.
6.2.3 Application
One potential application of our findings is to improve methods for draft optimization. As mentioned earlier, these methods incorporate models of opponent behavior that mostly assume simple fixed strategies are followed. The cumulative drafting patterns in Figure 7 provide a better characterization of opponent behavior. The finding that opponents are likely to herd on quarterbacks picked early in a draft, and kickers and defenses throughout a draft, potentially provides an opening for exploitation. Future work should assess how the performance of existing draft optimization methods (BeckerSun, 2016,Fry et al., 2007,Gibson et al., 2010,Summers et al., 2007) changes incorporating our behavioral insights.
A different application of our findings is to related competitive choice tasks. The most obvious generalization is to non-fantasy drafting in professional sports leagues. As we noted in the introduction, these drafts are high stakes and involve extensive analysis. It may be that the additional resources used to make decisions avoids sub-optimalities like being influenced by the preceding pick. But it is also possible that this behavior reflects basic cognitive biases that even well-prepared expert decision makers find difficult to overcome. It is more difficult to analyze the effectiveness of professional drafts, because the selected players form only a small component of a team. Another key difference is that most fantasy leagues apply to only one season, whereas professional sport rosters are a complicated amalgam of many drafts and non-draft recruitment of players. While this makes it difficult to assign credit to draft decision making in any precise way, at least some professional sports have developed metrics to address this challenge. US Major League Baseball, for example, routinely uses “wins above replacement” to assess players (Costa et al., 2019). This measure could form the basis of assessing draft outcomes over a period of time, and provide a way to reproduce our analyses in a professional sport setting.
6.3 Conclusion
Fantasy football drafts are psychologically interesting because they are well defined and straightforward to measure, but nonetheless are an extremely challenging task requiring the goal-driven adaptation of plans in a competitive social setting. We provided a set of analyses aiming simply to describe human behavior in these drafts, based on real-world data. We hope this is a first step in realizing the potential of drafts to provide insights into how people make sequential decisions in complicated and dynamic environments.
References
-
[AxelrodHamilton, 1981]
-
Axelrod, R. & Hamilton, W. D. (1981).
The evolution of cooperation.
Science, 211, 1390–1396.
- [BakerTenenbaum, 2014]
-
Baker, C. L. & Tenenbaum, J. B. (2014).
Modeling human plan recognition using Bayesian theory of mind.
In G. Sukthankar, C. Geib, H. Bui, D. Pynadath, & R. P. Goldman
(Eds.), Plan, activity, and intent recognition: Theory and practice
(pp. 177–204). Morgan Kaufmann.
- [Banks et al., 1997]
-
Banks, J., Olson, M., & Porter, D. (1997).
An experimental analysis of the bandit problem.
Economic Theory, 10, 55–77.
- [BeckerSun, 2016]
-
Becker, A. & Sun, X. A. (2016).
An analytical approach for fantasy football draft and lineup
management.
Journal of Quantitative Analysis in Sports, 12, 17–30.
- [BergerDaumann, 2021]
-
Berger, T. & Daumann, F. (2021).
Anchoring bias in the evaluation of basketball players: A closer
look at NBA draft decision-making.
Managerial and Decision Economics, 42, 1248–1262.
- [BramsStraffin Jr, 1979]
-
Brams, S. J. & Straffin Jr, P. D. (1979).
Prisoners’ dilemma and professional sports drafts.
The American Mathematical Monthly, 86, 80–88.
- [Callaway et al., in press]
-
Callaway, F., van Opheusden, B., Gul, S., Das, P., Krueger, P. M., Griffiths,
T. L., & Lieder, F. (in press).
Rational use of cognitive resources in human planning.
Nature Human Behaviour.
- [ChristianGriffiths, 2016]
-
Christian, B. & Griffiths, T. (2016).
Algorithms to live by: The computer science of human decisions.
New York: Henry Holt and Co.
- [Costa et al., 2019]
-
Costa, G. B., Huber, M. R., & Saccoman, J. T. (2019).
Understanding sabermetrics: An introduction to the science of
baseball statistics.
McFarland.
- [Daw et al., 2006]
-
Daw, N. D., O’Doherty, J. P., Dayan, P., Seymour, B., & Dolan, R. J. (2006).
Cortical Substrates for Exploratory Decisions in Humans.
Nature, 441, 876–879.
- [Fabiano, 2017]
-
Fabiano, M. (2017).
The best fantasy football draft strategy for 2017.
https://www.nfl.com/news/the-best-fantasy-football-draft-strategy-for-2017-0ap3000000815105.
- [Fry et al., 2007]
-
Fry, M. J., Lundberg, A. W., & Ohlmann, J. W. (2007).
A player selection heuristic for a sports league draft.
Journal of Quantitative Analysis in Sports, 3, 1–33.
- [FSGA, 2021]
-
FSGA (2021).
Industry demographics.
https://thefsga.org/industry-demographics/.
- [Giardino, 2017]
-
Giardino, D. (2017).
This lesson from game theory will change how you draft forever.
https://www.fantasypros.com/2020/08/this-lesson-from-game-theory-will-change-how-you-draft-forever-fantasy-football/.
- [Gibson et al., 2010]
-
Gibson, M. R., Ohlmann, J. W., & Fry, M. J. (2010).
An agent-based stochastic ruler approach for a stochastic knapsack
problem with sequential competition.
Computers & Operations Research, 37, 598–609.
- [Holleman, 2006]
-
Holleman, M. C. (2006).
Fantasy football: Illegal gambling or legal game of skill.
North Carolina Journal of Law & Technology, 8, 59–80.
- [Hyatt et al., 2013]
-
Hyatt, C. G., Sutton, W. A., Foster, W. M., & McConnell, D. (2013).
Fan involvement in a professional sport team’s decision making.
Sport, Business and Management: An International Journal, 3, 189–204.
- [Janis, 1971]
-
Janis, I. L. (1971).
Groupthink.
Psychology today, 5, 43–46.
- [JankShmueli, 2010]
-
Jank, W. & Shmueli, G. (2010).
Modeling online auctions, volume 91.
John Wiley & Sons.
- [Kellerer et al., 2004]
-
Kellerer, H., Pferschy, U., & Pisinger, D. (2004).
Knapsack problems.
Springer.
- [Knox, 2021]
-
Knox, K. (2021).
Fantasy football 2021: Ideal strategy for each spot in 12-team mock
drafts.
https://bleacherreport.com/articles/2947220-fantasy-football-2021-ideal-strategy-for-each-spot-in-12-team-mock-drafts.
- [Kogut, 1990]
-
Kogut, C. A. (1990).
Consumer Search Behavior and Sunk Costs.
Journal of Economic Behavior and Organization, 14,
381–392.
- [Kotrba, 2020]
-
Kotrba, V. (2020).
Heuristics in fantasy sports: Is it profitable to strategize based on
favourite of the match?
Mind & Society, 19, 195–206.
- [Lee, 2006]
-
Lee, M. D. (2006).
A hierarchical Bayesian model of human decision making on an
optimal stopping problem.
Cognitive Science, 30, 555–580.
- [LeeCourey, 2021]
-
Lee, M. D. & Courey, K. A. (2021).
Modeling optimal stopping in changing environments: A case study in
mate selection.
Computational Brain & Behavior, 4, 1–17.
- [LeeWagenmakers, 2013]
-
Lee, M. D. & Wagenmakers, E.-J. (2013).
Bayesian cognitive modeling: A practical course.
Cambridge University Press.
- [Lee et al., 2011a]
-
Lee, M. D., Zhang, S., Munro, M. N., & Steyvers, M. (2011a).
Psychological models of human and optimal performance on bandit
problems.
Cognitive Systems Research, 12, 164–174.
- [Lee et al., 2011b]
-
Lee, M. D., Zhang, S., & Shi, J. (2011b).
The wisdom of the crowd playing the Price is Right.
Memory & Cognition, 39, 914–923.
- [MasseyThaler, 2013]
-
Massey, C. & Thaler, R. H. (2013).
The loser’s curse: Decision making and market efficiency in the
National Football League draft.
Management Science, 59(7), 1479–1495.
- [MeyerShi, 1995]
-
Meyer, R. J. & Shi, Y. (1995).
Sequential choice under ambuigity: Intuitive solutions to the
armed-bandit problem.
Management Science, 41(5), 817–834.
- [MummoloPeterson, 2019]
-
Mummolo, J. & Peterson, E. (2019).
Demand effects in survey experiments: An empirical assessment.
American Political Science Review, 113, 517–529.
- [Nagel, 1995]
-
Nagel, R. (1995).
Unraveling in guessing games: An experimental study.
The American Economic Review, 85, 1313–1326.
- [Norton, 2011]
-
Norton, A. (2011).
Five arguments against fantasy football handcuffing.
https://bleacherreport.com/articles/797593-value-over-risk-5-arguments-against-fantasy-football-handcuffing.
- [OlekalnsAdair, 2013]
-
Olekalns, M. & Adair, W. L. (2013).
Handbook of research on negotiation.
Edward Elgar Publishing.
- [Orne, 1962]
-
Orne, M. T. (1962).
On the social psychology of the psychological experiment: With
particular reference to demand characteristics and their implications.
American Psychologist, 17, 776–783.
- [Paulsen, 2017]
-
Paulsen, J. (2017).
The art of the handcuff: Where and when to handcuff your stud RB.
https://www.4for4.com/2016/preseason/art-handcuff-where-and-when-handcuff-your-stud-rb.
- [Prystawski et al., in press]
-
Prystawski, B., Mohnert, F., Tošić, M., & Lieder, F. (in press).
Resource-rational models of human goal pursuit.
Topics in Cognitive Science.
- [Sanderson, 2021]
-
Sanderson, J. (2021).
Two hands are better than one: The definitive case against handcuffs.
https://www.playerprofiler.com/article/the-definitive-case-against-handcuffs/.
- [Schandl, 2021]
-
Schandl, J. (2021).
Best draft position fantasy football: Ranking which pick is best for
2021.
https://www.fanduel.com/theduel/posts/best-draft-position-fantasy-football-ranking-which-pick-best-2021-01fctyck89fv.
- [Schöbel et al., 2016]
-
Schöbel, M., Rieskamp, J., & Huber, R. (2016).
Social influences in sequential decision making.
PloS one, 11, e0146536.
- [Schulz et al., 2019]
-
Schulz, E., Bhui, R., Love, B. C., Brier, B., Todd, M. T., & Gershman, S. J.
(2019).
Structured, uncertainty-driven exploration in real-world consumer
choice.
Proceedings of the National Academy of Sciences, 116,
13903–13908.
- [SealeRapoport, 1997]
-
Seale, D. A. & Rapoport, A. (1997).
Sequential Decision Making with Relative Ranks: An Experimental
Investigation of the –Secretary Problem".
Organizational Behavior and Human Decision Processes, 69,
221–236.
- [SealeRapoport, 2000]
-
Seale, D. A. & Rapoport, A. (2000).
Optimal stopping behavior with relative ranks.
Journal of Behavioral Decision Making, 13, 391–411.
- [Shapiro et al., 2014]
-
Shapiro, D., Shi, X., & Zillante, A. (2014).
Level-k reasoning in a generalized beauty contest.
Games and Economic Behavior, 86, 308–329.
- [Shauf, 2017]
-
Shauf, M. (2017).
Your 2017 guide to fantasy football handcuffs.
https://www.draftsharks.com/article/your-2017-guide-to-fantasy-football-handcuffs.
- [Smith et al., 2006]
-
Smith, B., Sharma, P., & Hooper, P. (2006).
Decision making in online fantasy sports communities.
Interactive Technology and Smart Education.
- [StahlWilson, 1995]
-
Stahl, D. O. & Wilson, P. W. (1995).
On players’ models of other players: Theory and experimental
evidence.
Games and Economic Behavior, 10, 218–254.
- [Summers et al., 2007]
-
Summers, A. E., Swartz, T. B., & Lockhart, R. A. (2007).
Optimal drafting in hockey pools.
In Statistical thinking in sports (pp. 275–288). Chapman and
Hall/CRC.
- [Thomas et al., 2021]
-
Thomas, B., Coon, J., Westfall, H. A., & Lee, M. D. (2021).
Model-Based Wisdom of the Crowd for Sequential Decision-Making Tasks.
Cognitive Science, 45(7), e13011.
- [Trippiedi, 2014]
-
Trippiedi, M. (2014).
Daily fantasy sports leagues: Do you have the skill to win at these
games of chance?
UNLV Gaming Law Journal, (pp. 201–223).
- [TverskyKahneman, 1974]
-
Tversky, A. & Kahneman, D. (1974).
Judgment under uncertainty: Heuristics and biases.
Science, 185, 1124–1131.
- [von Moltke, 1880]
-
von Moltke, H. (1880).
Kriegsgeschichtliche Einzelschriften.
Grosser Generalstab, Prussian Armee.
- [WeberCook, 1972]
-
Weber, S. J. & Cook, T. D. (1972).
Subject effects in laboratory research: An examination of subject
roles, demand characteristics, and valid inference.
Psychological Bulletin, 77, 273–295.
- [Wiener, 2018]
-
Wiener, E. (2018).
Should you handcuff in fantasy football?
https://www.fantasypros.com/2018/07/should-you-handcuff-in-fantasy-football/.
- [Yoshida et al., 2008]
-
Yoshida, W., Dolan, R. J., & Friston, K. J. (2008).
Game theory of mind.
PLoS Computational Biology, 4, e1000254.
- [Zizzo, 2010]
-
Zizzo, D. J. (2010).
Experimenter demand effects in economic experiments.
Experimental Economics, 13, 75–98.
This document was translated from LATEX by
HEVEA.