Judgment and Decision Making, Vol. 16, No. 6, November 2021, pp. 1485-1505
Webcam-based online eye-tracking for behavioral research
Xiaozhi Yang*
Ian Krajbich#
|
Abstract:
Experiments are increasingly moving online. This poses a major challenge
for researchers who rely on in-lab techniques such as eye-tracking.
Researchers in computer science have developed web-based eye-tracking
applications (WebGazer; Papoutsaki et al., 2016) but they have yet to see
them used in behavioral research. This is likely due to the extensive
calibration and validation procedure, inconsistent temporal resolution
(Semmelmann & Weigelt, 2018), and the challenge of integrating it into
experimental software. Here, we incorporate WebGazer into a
JavaScript library widely used by behavioral researchers (jsPsych) and adjust the
procedure and code to reduce calibration/validation and improve the
temporal resolution (from 100–1000 ms to 20–30 ms). We test this
procedure with a decision-making study on Amazon MTurk, replicating
previous in-lab findings on the relationship between gaze and choice, with
little degradation in spatial or temporal resolution. This provides
evidence that online web-based eye-tracking is feasible in behavioral
research.
Keywords: eye-tracking, attention, online studies, decision-making, attentional drift diffusion model, preferences
1 Introduction
How people allocate attention is a crucial aspect of human behavior. It
dictates the degree to which different information is weighted in guiding
behavior. Attention is sometimes measured indirectly by inferring it from
choice data or response times (RT). But increasingly, attention has been
measured more directly using eye-tracking. Eye-tracking makes use of the
eye-mind hypothesis: people generally look at the information that they
are thinking about (Just & Carpenter, 1984) (though not always).
The use of eye-tracking has become an important tool in decision
science, and behavioral science more generally, as it provides a detailed
representation of the decision process (Mormann et al., 2020; Wedel &
Pieters, 2007). It has been used to understand the accumulation of
evidence in sequential sampling models of choice (Krajbich, 2019), context
effects in multi-attribute choice (Noguchi & Stewart 2014), strategic
sophistication in games (Polonio et al., 2015), selfish vs. pro-social
tendencies in altruistic choice (Teoh et al., 2020), truth telling and
deception behavior (Wang et al., 2010), and simplification strategies in
multi-attribute and multi-alternative choice (Arieli et al., 2011; Fiedler
& Glöckner, 2012; Payne et al., 1988; Reeck et al., 2017; Reutskaja et
al., 2011; Russo & Dosher, 1983; Russo & Rosen, 1975; Shi et al., 2013).
In addition to applications in decision research, eye-tracking is widely
used in other areas of psychology such as emotion recognition (Pell &
Kotz, 2011) and reading (Rayner, 2009), as well as areas outside of
psychology such as advertisement (Pieters & Wedel, 2004) and driving
behavior (Nakayasu et al., 2011).
A challenge to the continued growth of eye-tracking research is the
shift of behavioral research from brick-and-mortar labs to the internet
(Goodman & Paolacci, 2017). This shift has been accelerated dramatically
during the COVID-19 pandemic. While online data collection has many
advantages (e.g., speed, affordability), it has so far not been used to
collect eye-tracking data in behavioral research.
However, there is reason for hope. Eye-tracking has garnered a lot of
interest in the domain of human-computer interaction. For example,
gaze-aware games can improve the gaming experience by providing timely
effects at the gazed location (Majaranta et al., 2019). Consequently,
researchers in computer science have been working to improve the
algorithms to determine gaze location (e.g., WebGazer, Papoutsaki et al.,
2016; Smartphone eye-tracking, Valliappan et al., 2020; TurkerGaze, Xu et
al., 2015).
Here, we capitalize on these recent advances to investigate the possibility
of bringing eye-tracking research online. We start with WebGazer, a
JavaScript toolbox that was developed to monitor peoples’ eye movements
while on the internet (Papoutsaki et al., 2016). Until now, it has not
been used in behavioral research, except in one methods article
demonstrating some basic gaze properties (Semmelmann & Weigelt, 2018).
In that article, the authors used an extensive calibration and validation
procedure that occupied approximately 50% of the study time. That article
also found that WebGazer’s temporal resolution is relatively low and
inconsistent, but left it unclear what caused these problems and whether
they can be solved. Here, we show that these temporal aspects of WebGazer
can indeed be substantially improved.
Another set of issues with online eye-tracking concerns the requirements on the
user/subject’s side. In the lab, researchers control the computer and
camera quality, the lighting, the subject’s positioning, etc. Online,
researchers have little control over these things. Therefore, we seek to
establish basic requirements and develop simple procedures for subjects to
follow in order to maximize data quality. It is also important that
subjects understand that they are not being recorded and so there are no
privacy violations as the images and video do not leave the subject’s
computer.
An advantage of online eye-tracking is that it lowers the bar for
researchers to use eye-tracking in their own work. To further improve
accessibility, we seek to ease the programming requirements for using
WebGazer in behavioral experiments. To that end, we integrate WebGazer
into a user-friendly, open-source psychology toolbox called JsPsych (De
Leeuw, 2015). JsPsych is built on JavaScript, includes a library of
commands for behavioral experiments, and also allows for integration of
JavaScript-based libraries such as WebGazer. This addresses potential
concerns about the difficulty of incorporating WebGazer into existing
behavioral paradigms.
To illustrate these issues and our solutions, we conducted a simple online
value-based experiment on Amazon Mechanical Turk (MTurk). We aimed to
replicate the robust links between gaze and choice that have been
documented in the literature (e.g., Amasino et al., 2019; Ashby et al.,
2015; Fisher, 2017; Ghaffari & Fiedler, 2018; Gluth et al., 2020;
Krajbich et al., 2010; Pärnamets et al., 2015; Sepulveda et al., 2020;
Sheng et al., 2020; Shimojo et al., 2003; Teoh et al., 2020). In
particular, we used the same experimental paradigm as Krajbich et al.
(2010), and replicated empirical findings about the role of gaze in
value-based decisions. To our knowledge, we are the first to replicate an
eye-tracking decision-making task online. Notably, this experiment took
just a couple of days to run, in contrast to standard eye-tracking
experiments which typically take several weeks to run. In the
supplementary material we provide a template experiment and our
experimental materials.
We also note that online eye-tracking is potentially a useful tool for all
online researchers, as it can be used to ensure that study subjects are
humans and not computer algorithms, i.e., “bots” (Buchanan & Scofield,
2018; Buhrmester et al., 2011). We hope that this work will help
facilitate the continued growth of both eye-tracking and online behavioral
research.
2 Method
2.1 Subjects
125 subjects from Amazon MTurk participated in this study. Of these, 49
successfully passed the initial calibration + validation and completed the
study. We required subjects to be
located in the United States and have a 95% or higher HIT approval rate.
In addition, we required subjects to have a laptop with a webcam.
2.2 Privacy
Given that WebGazer uses subjects’ webcams to monitor their gaze location,
privacy concerns naturally arise. Therefore, it is important to note, and
to highlight for subjects, that the webcam images are processed locally
and never leave the subjects’ computers. What leaves their computer is
the output of the WebGazer algorithm, namely horizontal (x) and vertical
(y) coordinates of where WebGazer thinks the subject is looking at a given
point in time. In this study, subjects saw themselves live on screen prior
to the calibration procedure. This was to help them position their heads
optimally. Researchers who are concerned that their subjects may be wary
of privacy could disable this feature by turning off the “showVideo”
option but leaving the “show face overlay” and “show face feedback box” on
when they implement the calibration function. That might somewhat impede
calibration, but it might reduce subjects’ apprehension as they start the
experiment.
2.3 Experimental software/materials
The experiment was programmed in JavaScript, based on the jsPsych and
WebGazer libraries. To improve WebGazer’s temporal resolution we removed
some seemingly unnecessary computations that occur in each animation frame
of a webpage. The original code calls the getPrediction() function at
every animation frame to load the measured gaze location. This step is
necessary when providing gaze-contingent feedback, but otherwise just
consumes computational resources. These extra computations appear to
gradually degrade WebGazer’s temporal resolution.
To deal with this, we modified the loop() function for each animation
frame to avoid the getPrediction() call when possible (for the case we
just need face tracking data to draw face overlay, the CLM tracker is
called separately, and similarly for pupil features needed in the face
feedback box). In addition, we also used the recently added ridge thread
regression method, which reduces computational demands.
We used Heroku (a cloud platform; https://www.heroku.com) as our
server-side support for the experiment.
2.4 Task
2.4.1 Recruitment and initial preparations
We asked subjects to close any unnecessary programs or applications on
their computers before they began. Also, we asked them to close any
browser tabs that could produce popups or alerts that would interfere with
the study (see Fig. S3). Once the study began, subjects entered into
full-screen mode.
Before subjects began the calibration/validation process, we provided
detailed instructions about how to position themselves. We first showed
them instructions from Semmelmann & Weigelt (2018). For example, they
should sit directly facing the webcam to ensure full visibility of their
face. We also added several tips we learned from the pilot study. In
detail, we asked subjects to 1) use their eyes to look around the screen
and avoid moving their head; 2) keep lights in front of them rather than
behind them so that the webcam could clearly see their faces; 3) avoid
sitting with a window behind them (Fig. S2).
After reading the instructions, subjects saw a screen where they could
position themselves appropriately using the live feed from their webcam.
Once they were properly positioned, they could advance to the calibration
and validation stage.
2.4.2 Calibration + validation
Subjects next had to pass an initial calibration + validation task (Fig.
1A). At the beginning of the calibration, a video feed appeared in the
top left corner of the screen. Subjects could use this video feedback to
adjust their position and center their face in a green box in the center
of the video display. Once properly positioned, subjects could press the
space bar to advance to the next step.
A)
B)
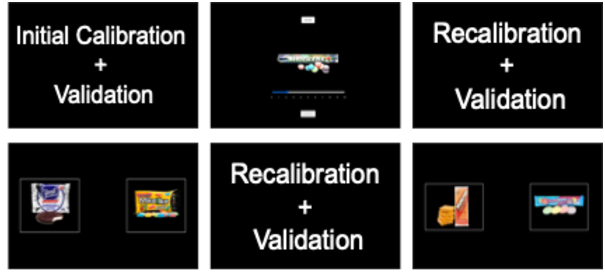
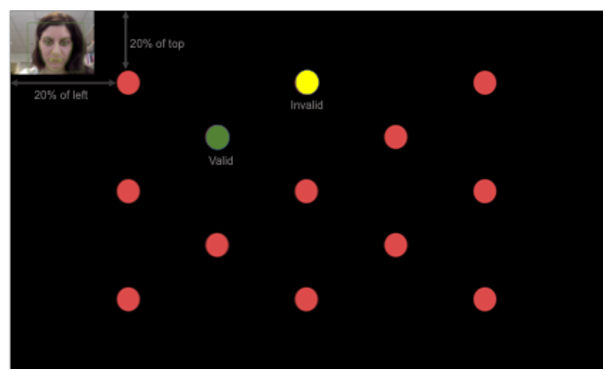
| Figure 1: Experiment Design. A). Visualization of the calibration
+ validation process. Subjects would only see one dot at a time. During
calibration only, the subject’s face was present at the top left corner of
the screen, along with a green box for positioning. During validation
only, the dots would change color to indicate a valid or invalid measure.
B). Overview of the experiment. There was an initial calibration +
validation phase to screen out problematic subjects. Next, subjects rated
how much they liked 70 different food items. Then there was another
calibration + validation. This was followed by 100 binary-choice trials
where subjects chose which food they preferred; there was a recalibration
+ validation halfway through these trials. |
Next, subjects saw a sequence of 13 calibration dots appear on the screen,
each for three seconds (Semmelmann & Weigelt, 2018). The task was simply
to stare directly at each dot until it disappeared.
Next, subjects entered the validation procedure. The validation procedure
was essentially identical to the calibration procedure, except for the
following differences. Each validation dot lasted for two seconds. Within
those two seconds, WebGazer made 100 measurements (one every 20ms).
Measurements within the first 500ms were removed to account for gaze
transitions. Each measurement was labeled as a hit if it was within X
pixels of the center of the dot (X increased with each failed
calibration/validation attempt, see below). If at least 80% of the
measurements were hits, we labeled the dot as valid, and it turned green.
Otherwise, the dot turned yellow (in the validation instructions, we told
subjects to try to make every dot turn green). Out of 13 validation dots,
if the valid dot proportion was at least Y, the experiment proceeded.
Subjects had three chances to pass this initial calibration + validation
task. With each new attempt, we raised the pixel threshold (X) for a
hit and lowered the valid-dot threshold (Y). In particular, the pixel thresholds
(X) were: 130px, 165px, and 200px; the valid-dot thresholds were: 80%,
70%, and 60%. If a subject failed the calibration + validation three
times, we compensated them with 50 cents and ended the experiment.
We adopted this procedure to give poorly calibrated subjects a chance to
reposition themselves and try again, while also acknowledging that some
subjects might not be able to sufficiently improve their setup to pass the
most stringent requirements. This also allowed us to assess if initial
calibration attempt(s) predicted any of the later results (see
Supplementary Note 1).
2.4.3 Hypothetical food choice task.
After passing the initial calibration and validation, subjects proceeded to
the choice task (Fig. 1B). This paradigm was initially used in Krajbich et
al. (2010) to study how gaze influences value-based decisions. Subjects
first rated their desire for 70 snack food items on a discrete scale from
0 to 10. Subjects were told that 0 means indifference towards the snack,
while 10 indicates extreme liking of the snack. They could also click a
“dislike” button if they didn’t like a food item. Subjects used the mouse
to click on the rating scale.
After the rating task, subjects were recalibrated and validated. They
were eye-tracked for the remainder of the study.
Next, subjects began the binary choice task. 100 trials were randomly
generated using pairs of the rated items, excluding the disliked items.
Subjects were told to choose their preferred food in each trial. They
selected the left option by pressing the left arrow key and the right
option by pressing the right arrow key.
Between trials, subjects were either presented with a fixation cross at the
center of the screen or, every ten trials, with a sequence of three red
validation dots. In the latter case, the first two validation dots
appeared randomly at one of 12 possible positions, while the last dot
always appeared at the center of the screen. For each of those validation
dots, the pixel threshold was set at 130px with a threshold of 70%, and
the presentation time was 2 seconds. A recalibration would be triggered
if subjects failed more than four validation dots in two successive
intertrial validations.
After 50 trials, subjects were given the option to take a short break.
After the break, they were recalibrated and validated.
2.5 Data cleaning
Out of 49 subjects, 48 subjects’ data were fully received. One subject’s
data were only partially received, with 32 choice trials.
To ensure good data quality for the analysis linking gaze to behavior, we
checked the intertrial validation pass rate and excluded subjects who
failed too many. As mentioned above, the pixel threshold was set at 130px
with a threshold of 70% for each validation dot. A subject’s pass rate
was their fraction of valid intertrial dots. The mean pass rate was 0.6
(SD = 0.26). There were 35 subjects with pass rates higher than 0.45 (M =
0.73, SD = 0.16), eight subjects with pass rates between 0.3 and 0.4 (M =
0.36, SD = 0.04), and six subjects with pass rates below 0.2 (M = 0.15, SD
= 0.08). For those subjects with pass rates between 0.3 and 0.4, we
identified the longest intervals that did not include two consecutive
complete validation failures (six consecutive missed dots). If those
intervals contained at least 20 behavioral trials, we included those
trials in the analysis (see Fig. S5). In particular, we included 50, 40,
and 20 trials from three additional subjects. Our initial analysis plan
would have only included the 35 subjects with pass rates higher than 0.45,
but to better match the sample size from the 2010 study, we decided to
additionally include these three additional subjects. Thus, 38 subjects
were included in total.
We also excluded individual trials based on RT and dwell times. We removed
trials with RTs shorter than 0.4s or longer than 10s, and trials with
potentially problematic fixation data as follows: 1). The gaze
measurements were always at the center of the screen. 2). The sampling
interval was longer than 200ms (10 times larger than expected). After
these exclusions, the mean number of trials was 80 (SD = 27).
2.6 Stimuli and ROI definition
Each food image was 450px by 320px. We defined AOIs in terms of the
percentage of the screen size. Gaze within 25 to 75 percent of the screen
height and 5 to 45 percent of the screen width were considered the left
AOI, while gaze within 25 to 75 percent of the screen height and 55 to 95
percent of the screen width were considered the right AOI. These AOI
definitions were chosen before analyzing the data.
As a robustness check, we also tried defining AOIs in pixels, adding 90px
horizontal buffers and 54px vertical buffers to the edges of the images.
There were no qualitative differences using this alternative AOI
definition.
2.7 Computer resolution/browser usage
Subjects’ screen widths ranged from 1280px to 2560px and screen heights
ranged from 719px to 1440px. Out of 49 subjects who passed the initial
calibration, 45 of them used Chrome (33 used version 85; 10 used version
84; 1 used version 77; 1 used version 75), and 4 of them used Firefox
(version 80).
3 Results
3.1 Basic setup and data quality
To begin, it is worth briefly describing a standard eye-tracking procedure
in the brick-and-mortar lab. Typically, the eye-tracking camera is
situated either below or above the computer screen, between the screen and
the subject (Schulte-Mecklenbeck et al., 2019). The subject is seated,
often with their head immobilized in a chinrest (though not always).
Subjects are instructed to try to keep their heads still during the
experiment. Before the experiment begins, subjects go through a
calibration procedure in which they stare at a sequence of dots that
appear at different locations on the screen (Fig. 1A). A subsequent
validation procedure has the subject look at another sequence of dots, to
establish how well the eye-tracker’s estimate of the gaze location aligns
with where the subject is supposed to be looking (i.e. the dots). During
the experiment, validation can be repeated (to varying degrees) to ensure
that the eye-tracker is still accurate.
With WebGazer we used a similar procedure, with some qualifications.
First, before signing up for the experiment, we required subjects to be
using a laptop with a webcam, and to be using an appropriate web browser
(see Methods). We also asked them to close any applications that might
produce popups. We had no control over the subject’s environment and we
could not immobilize their head, but we did provide them with a number of
suggestions for how to optimize performance, including keeping their heads
still, avoiding sitting near windows, keeping light sources above or in
front of them rather than behind them, etc. (see Methods). Subjects had
three chances to pass the calibration and validation procedure, otherwise
the experiment was terminated, and they received a minimal “showup” fee
(see Methods).
During the experiment, we incorporated a small number of validation points
into the inter-trial intervals, rather than periodically having a full
procedure with many validation points. This step allowed us to evaluate
data quality over time; in future experiments this step could be skipped
or replaced with ongoing calibration points. We did recalibrate halfway
through the choice task. The time interval between the calibration at the
beginning of the choice task and the second calibration was 5.39 minutes
on average (SD = 2.66 mins).
Prior work has documented the spatial resolution of WebGazer
(Semmelmann & Weigelt, 2018). They established that, shortly after
calibration and validation, online precision is comparable to, but
slightly worse than that in the lab (online: 18% of screen size, 207px
offset; in-lab: 15% of screen size, 172px offset). However, an unresolved
issue is whether that spatial resolution persists as time goes on.
To assess spatial resolution over time, we examined the hit ratio for
validation dots as the experiment went on. For each measurement, we
calculated the Euclidean distance (in pixels) between the recorded gaze
location and the center of the validation dot. If this distance was below
a critical threshold (see Methods), we labeled the measurement a hit,
otherwise we labeled it a miss. The hit ratio is simply the proportion of
hits out of all the validation measurements (see Methods). Aside from an
initial drop shortly after each calibration/validation, the hit ratio
remained quite steady over time (Fig. 2A; mean hit ratio as a function of
trial number: β = −0.00048, se( β
) = 0.00021, p = 0.028). Table S3 shows the mean/median hit
ratios for every intertrial validation.
| A) | | B) |
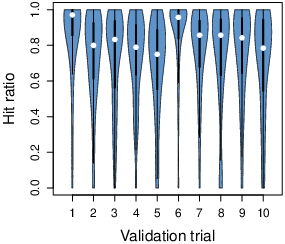 | |  |
| Figure 2: Spatial precision (A) and temporal resolution (B) over
time. (A) The hit ratio, namely the proportion of successful
intertrial validation points, as a function of number of validations
completed. 10 intertrial validation trials were included per
subject. There was a recalibration halfway through the experiment. (B)
The gaze sampling interval, namely the delay between gaze measurements,
as a function of the number of choice trials completed. The white
circles indicate the median values. The black bars in the center of the
violins represent the interquartile range. The blue violins represent all
of the observations. |
A second, potentially more serious issue is temporal resolution over time.
Eye-tracking setups often come with dedicated computer hardware due to the
required computations. With online eye-tracking, there is no second
computer and we have little control over subjects’ hardware. If the
computations overwhelm the subjects’ hardware, the temporal resolution may
suffer dramatically.
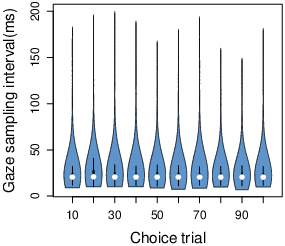
To assess temporal resolution over time, we examined the average time
interval between gaze estimates made by WebGazer as the experiment went
on. As we feared, an earlier pilot experiment revealed that the time
interval between estimates increases dramatically over time, from 95ms (SD
= 13ms) in the first ten trials, to 680 ms (SD = 64ms) by the halfway
point (13.20 min (SD = 3.55 min)). This decreased back to 99ms (SD = 12ms)
after recalibration but then increased to 972ms (SD = 107ms) by the end of
the experiment. This kind of time resolution is unacceptable for most
behavioral work.
However, with some modifications to the WebGazer code (see Methods) we were
able to reduce computational demands. As a result, the time interval
between estimates in our main experiment remained steady at 24.85ms on
average (SD = 12.08ms) throughout the experiment (Fig. 2B). This time
resolution is comparable to many in-lab eye-trackers currently on the
market and in scientific use (Carter & Luke, 2020).
To further quantify spatial resolution, we also examined the initial
validation data from another WebGazer study using the same calibration and
validation procedure (N=83, details reported elsewhere1). Here, we summarize the sample mean and sample deviation for
each validation dot (Table 1). We found offsets in the range of 181.20 px –
263.70 px. We also calculated a confusion matrix to examine how often
WebGazer estimated the incorrect validation dot (Fig. 3). These results
indicate that the spatial precisions are mostly consistent across the
validation dots, with some exceptions at the corners of the screen (as is
also common in the lab). In particular, the validation dots at the corners
of the screen had significantly larger offsets than the other dots
(mixed-effects regression of offsets on the validation dot position (at the
corner vs. not at the corner): β = 40.51, p = 0.014).
| Table 1: This table summarizes the statistics related to validation
samples in another study (reported elsewhere; these statistics were not
recorded for the main experiment). Each row represents a validation dot
position, with the horizontal x-coordinate followed by the vertical
y-coordinate, relative to the top left corner of the screen. For example,
20%;80% represents a dot at the bottom left corner of screen, 20% of
the way right and 80% of the way down. Each validation sample represents
a single gaze measurement produced by WebGazer. Ideally, WebGazer would
give a measurement every 20ms in the experiment. Mean distances represent
the average Euclidean distance between the measured gaze location and the
center of the validation dot. Standard deviations are calculated for each
condition using all validation samples for that condition. |
| (X; Y) | Mean distance (px) | SD distance (px) | Mean distance (%) | SD distance (%) |
| 20%; 20% | 228.44 | 162.21 | 20 | 15 |
| 20%; 50% | 206.28 | 154.20 | 18 | 14 |
| 20%; 80% | 263.70 | 190.62 | 24 | 17 |
| 50%; 20% | 218.14 | 156.32 | 20 | 15 |
| 50%; 80% | 253.86 | 173.49 | 24 | 17 |
| 80%; 20% | 219.74 | 161.47 | 20 | 15 |
| 80%; 50% | 209.82 | 147.41 | 19 | 12 |
| 80%; 80% | 244.88 | 165.27 | 23 | 15 |
| 35%; 35% | 203.20 | 153.63 | 18 | 13 |
| 65%; 35% | 181.20 | 136.37 | 16 | 11 |
| 35%; 65% | 196.76 | 136.67 | 18 | 12 |
| 65%; 65% | 183.58 | 143.69 | 17 | 13 |
| 50%; 50% | 182.91 | 133.58 | 16 | 12 |
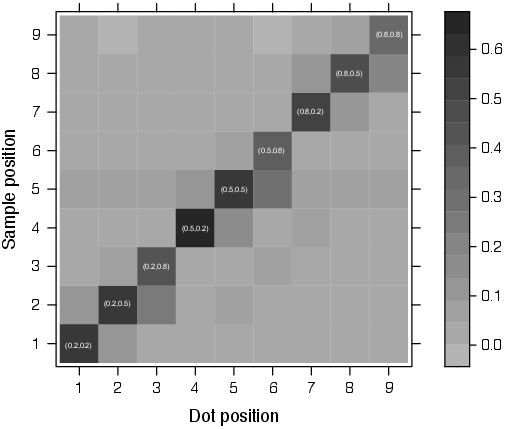
| Figure 3: Validation prediction accuracy. We selected the nine
equally spaced validation dots and examined the spatial distribution of
observed gaze samples for each of those dots. Ideally, we would only
observe gaze samples at the current dot position, as would be indicated by
solid black along the diagonal and light grey everywhere else. The
location of the gaze sample was calculated using Euclidean distance. If
the Euclidean distance between the sample and the dot position was within
15% of the screen width (192 pixels for a laptop with 1280px screen
width), then the sample was assigned to that dot. For instance, if the
Euclidean distance between a sample and dot (20%; 20%) is smaller than
15% of the screen width, then the sample is assigned to (20%; 20%). The
coordinates (X,Y) of the validation dots are displayed along the diagonal. |
3.2 Analysis of the dataset
To verify the quality of online eye-tracking, we sought to replicate the
robust links between gaze and choice that have been documented in the
literature (e.g., Krajbich et al., 2010; Krajbich & Rangel, 2011; Shimojo
et al., 2003). We used Krajbich et al. (2010)’s binary choice experiment
as a basis for comparison (Fig. 1B). This experiment was originally run
with an eye-tracker with comparable time resolution of 20ms. In that
version, subjects first rated 70 snack foods, then in 100 trials decided
which of two snack foods they would prefer to eat. Our online version of
that experiment was identical except for the particular stimuli, the
number of trials, and the fact that the decisions were hypothetical.
In the original experiment, accuracy rates for rating differences of {1,
2, 3, 4 ,5} were {0.65, 0.76, 0.84, 0.91, 0.94}; in the MTurk study they
were {0.65, 0.79, 0.87, 0.90, 0.92}. Thus, despite being hypothetical,
decisions in the MTurk study were very similar in quality. Response times
(RT) in the original study declined with absolute value difference from
2.55s to 1.71s. Similarly, RTs in the MTurk study declined from 1.42s to
1.17s, though they were significantly shorter than the original study, as
indicated by a mixed-effects regression of log(RT) on absolute value
difference and a dummy variable for the online study
( β =−0.91, se( β = 0.03), two-sided p =
10–16). While MTurk respondents were considerably
faster in their decisions, they still exhibited the expected relationship
between difficulty and RTs (mixed effects regression of log(RT) on absolute
value difference: β=−0.026, se( β ) =
0.004, two-sided p = 10–9). Other behavioral analyses
can be found in Supplementary Note 2.
Next, we turn to the eye-tracking data. Key relationships that we sought to
replicate here include: 1) correlations between dwell times and choice:
subjects will be biased towards choosing the option they have looked at
more; 2) the effects of individual dwell: the duration of the first
dwell will be positively correlated with choosing the first-seen item;
3) last fixation bias: subjects will be more likely to choose the
last-seen option.
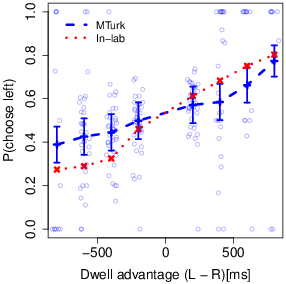
The first analysis models the choice (left vs. right) as a function of
rating difference (left−right) and total dwell time difference
(left−right) over the course of the trial, using a mixed-effects logistic
regression. We found a strong significant effect of relative dwell time (
β = 0.57, se( β ) = 0.14, two-sided p
= 10–5), even after accounting for item ratings (Fig.
4A). This result is highly consistent with the original study.
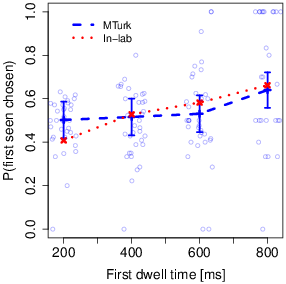
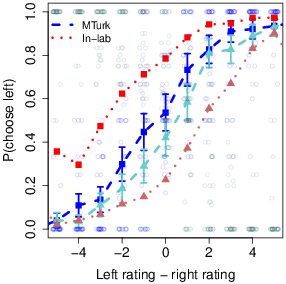
| Figure 4: Relations between gaze and choice. A) Choice as a
function of the total dwell-time difference between the left option and
the right option in a given trial. B). Choosing the first seen item as a
function of the first gaze dwell time. C). Choice as a function of the
value differences between the two options, split by the location of the
last fixation. Squares indicate final fixation left, triangles indicate
final fixation right. In each plot, the red line/dots represent the results in
Krajbich et al. (2010)’s dataset; the blue line/dots represent the results
in the online MTurk study. The error bars represent the mean ± standard
errors. The blue circles are data from individual subjects in the MTurk
data. |
We also examine heterogeneity in this relationship, using individual-level
logistic regressions. Twenty-six (68%) subjects exhibited positive
coefficients (12 were significant at two-sided p < 0.1). This
is comparable, though somewhat less consistent than in the original in-lab
dataset (Fig. 5).
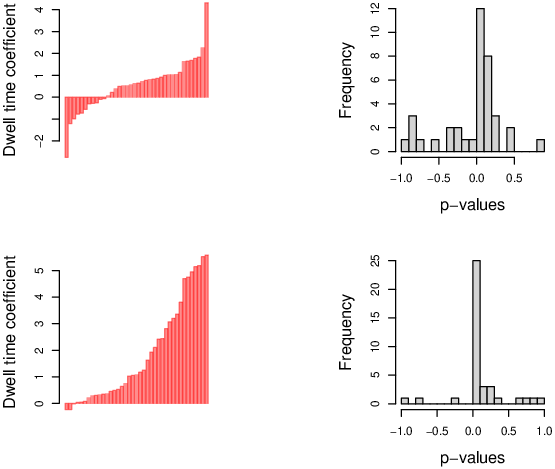
| Figure 5: Individual-level dwell time coefficients and p-values.
(A) Coefficients and (B) p-value distributions from the online MTurk
study. (C) Coefficients and (D) p-value distributions from Krajbich et al.
(2010)’s dataset. (A-C) Dwell-time coefficients are extracted from the
individual-level logistic regressions of choice on dwell time difference;
each bar represents one subject. p-values indicate the significance of
those coefficients. Negative p-values are for individuals with
coefficients less than zero. |
The second analysis examines the effect of individual dwells. Here we
model the choice (first-seen vs. other) as a function of the rating
difference (first−other) and the duration of the first dwell, again with
a mixed-effects logistic regression. We again find a significant effect of
the initial dwell time ( β = 0.43, se(
β ) = 0.22, two-sided p = 0.04), even after accounting for the
item ratings (Fig. 4B). Again, this result aligns well with the original
study.
The third analysis examines the effect of the final fixation location. Here
we model the choice (last seen vs. other) as a function of the rating
difference (last seen−other), again with a mixed-effects logistic
regression. We find a strong significant intercept term (
β = 0.24; se( β ) = 0.06, two-sided p =
10–5), indicating a bias to choose the last-seen item
(Fig. 4C). However, this last-fixation effect is smaller in this dataset
compared to the original dataset.
One noticeable difference between this dataset and the original in-lab
results (Krajbich et al., 2010) is in the duration of the average dwell
(lab: 576 ms (SD = 380 ms), MTurk: 380 ms (SD = 291 ms)). However, this
may reflect that RTs were considerably shorter in this experiment than in
the lab experiment. The average dwell time, as a fraction of RT, was
comparable between the lab (M = 0.25, SD = 0.15) and MTurk (M = 0.29, SD =
0.19) experiments.
4 General discussion
We have presented an attempt at online eye-tracking in behavioral research.
Online data collection is increasingly common, especially during the
COVID-19 pandemic. This should not be a barrier to studying visual
attention.
Although there are some options available for online eye-tracking, none
have been adopted by behavioral researchers. Some software (e.g.,
TurkerGaze) requires extensive programming knowledge. Other software such
as Realeye (https://www.realeye.io) is not open source and can be very
expensive to use. In general, when trying to build an online eye-tracking
experiment there are several features to consider: 1) The flexibility of
stimulus presentation (is it possible to adjust the paradigm/software for
different experiments?) 2) The difficulty of the experimental programming
(does the implementation of the paradigm/software require extra
expertise?) 3) The retrieval of the eye-tracking data (can the data be
retrieved and stored in a useable format?) 4) The accessibility of the
resources (is the software/paradigm open-source?).
We assessed these dimensions with our toolbox and found that it performs
well on all these dimensions, as it provides total flexibility, is
integrated in user-friendly jsPsych, stores the eye-tracking data with the
other behavioral measures, and is open-source.
An important issue that we addressed in this study is the amount of
calibration and validation required to run a successful experiment. In
prior work, calibration and validation has taken up to 50% of the
experiment time (Semmelmann & Weigelt, 2018). However, with our
modifications, we found that it is possible to get by with less, as there
appears to be little to no degradation in spatial or temporal precision
over time, at least on the time scale of our experiment. In our study, the
mean fraction of the time subjects spent in calibration or validation was
40%, but we likely could have gone lower. Moreover, we found that most
subjects were able to pass the initial calibration in their first attempt,
minimizing the time that they spend on calibration and validation (see
Supplementary Note 1). Going forward, we would suggest
assigning a single calibration + validation phase at the beginning of the
study (to screen out unusable subjects). Occasional inter-trial validation
dots may also be useful as a measure of data quality, or alternatively
inter-trial calibration dots may be useful to improve data quality. Of
course, the amount of calibration should depend on the spatial precision
required. If there are more areas of interest (AOI) then more calibration
may be necessary.
Along those lines, one unresolved issue is how many distinct AOIs can
be effectively used online. Here we used a simple design with two AOIs.
Based on WebGazer’s spatial precision, we estimate that one could use four
to six AOIs without any degradation in data quality (Table 1). The average
distance between the true and measured gaze locations is ∼200 pixels
(or ∼20% of the screen size), which means that with more AOIs, gaze in
one AOI might start to register in another AOI. This is certainly worse
than what one would get for a typical subject in the lab, but we believe
it can still be useful for many applications. Presumably, better data
analysis methods could be used to filter out spurious observations, if one
needed more AOIs.
Another issue is how far the time resolution can be pushed. Here we
went with 50 Hz, which seemed to work well. Most common webcams have a
sampling rate of around 50Hz (e.g., Logitech C922 camera with 60Hz
sampling rate) and so that is likely the limit on temporal resolution. For
studies requiring better temporal resolution, in-lab eye tracking is still
likely necessary.
Notably, visual angle, which is one common measure reported in eye-tracking
studies, is not available with the current toolbox. However, WebGazer does
detect users’ faces using the clmtrackr library (a face fitting library;
Mathias, 2014) and then extracts the eye features (Robal et al., 2018). It
should therefore be possible to calculate a subject’s distance to the
screen, and from that estimate visual angle. Future research should
attempt to address this issue.
We validated the toolbox by replicating Krajbich et al. (2010)’s in-lab
study. We replicated important links between gaze and choice. However, it
is important to note that the extent to which the online data were in line
with the original data varies among the hypotheses.
Though we found the last fixation effect (i.e., subjects were more likely
to choose the last-seen option), the difference in the size of the effect
relative to the original data (and subsequent replications; see Smith &
Krajbich 2018, 2021) is substantial and does warrant future investigation.
However, we doubt that the eye-tracking technology is responsible for this
difference. Notably, Our MTurk subjects made their decisions much faster
(1.3s) than in the lab (2.2s). Additionally, in a follow-up study (Table
1), we investigated attentional effects in a slightly different domain
(political choice) and found a much higher rate of looking at the chosen
option last (∼70–75%, very much in line with prior in-lab results).
Therefore, we suspect that the difference in the last-fixation effect that
we observed is a product of the subject population rather than the toolbox.
Going forwards, it will be important to compare eye-tracking results with
different subject populations, using this toolbox.
Previous research has documented the advantages and disadvantages of
conducting behavioral research online (i.e., Mason & Suri, 2012). We
would like to highlight several benefits of online eye-tracking compared
to in-lab eye-tracking. First, tasks on MTurk allow many subjects to
participate in the study simultaneously. In contrast, in-lab eye-tracking
studies typically are one-on-one sessions, with one subject and one
experimenter in the laboratory (but see Hausfeld et al., 2021). Therefore,
collecting data in the lab is time and labor intensive. We completed data
collection in three days, while it would take weeks to collect the same
amount of data in the lab. Second, the low cost of online eye-tracking is
also another distinct advantage, as it requires no special hardware on the
experimenter’s side and the software involved is all free and open access.
On the other hand, there are some limitations to the online approach (e.g.,
Ahler et al., 2019). One issue is with the number of subject exclusions.
In a typical lab study, only a small number of subjects are excluded. For
example, our in-lab comparison study (Krajbich et al., 2010) only excluded
1 subject out of 40. Meanwhile, in the online study, we excluded over
half of the subjects. However, this comparison is somewhat misleading.
Online, most exclusions were done before the experiment even began;
subjects could not begin the experiment until they passed hardware checks
and then the calibration/validation. In the lab, subjects who cannot be
calibrated or who simply fail to show up to their scheduled session would
normally not be counted as “exclusions”, they would simply not be
mentioned. So, while we might be concerned about potential selection
effects where we are only studying people who are less concerned about
privacy, have good laptops, are able to position themselves properly,
follow directions, and have eyes that are easily detected by the
algorithm, there are also similar concerns in lab experiments where we are
studying only college students who are motivated enough to sign up for a
study, show up to their session, and follow directions. While selection
biases are obviously not ideal, the biases here are probably no different
than a typical MTurk study, and certainly more representative than a
typical study with university students (Smart, 1966).
Additionally, online studies in general suffer from higher rates of
attrition. Researchers have found that up to 25% of MTurk respondents
are suspicious or fraudulent, e.g. bots (Ahler et al., 2019). Given that
we cannot observe our subjects nor control their environment or hardware
(aside from requiring a laptop with a webcam), it is not surprising that
we have lots of exclusions. We would argue that what matters is the final
number of subjects, rather than the fraction of recruited subjects.
On a related point, one common issue with online studies is ensuring that
subjects are human and not computer “bots”. Researchers have developed
ways to filter out bot data after the fact (Dupuis et al., 2019; Permut et
al., 2019) or to use extra items to screen out bots during the study
(Buchanan & Scofield, 2018). The problem with the former approach is that
it requires assumptions about how these bots will respond. Savvy Mturk
users might be able to program bots that violate those assumptions. The
latter approach is more similar to ours, but it typically requires
subjects to exert extra effort that is irrelevant to the task, and these
extra measures may also be defeated by savvy programmers. WebGazer
provides a simple way to ensure that subjects are human beings, without
any additional questions or statistical tests. While it is surely not
impenetrable, faking eye-tracking data would be no small feat.
In summary, we see a lot of promise for online eye-tracking, even
beyond the COVID pandemic. While it is by no means perfect, it provides a
fast, accessible, and potentially more representative way to study visual
attention in behavioral research. We look forward to seeing the ways in
which researchers take advantage of this opportunity.
References
Ahler, D. J., Roush, C. E., & Sood, G. (2019). The micro-task market for
lemons: Data quality on Amazon’s Mechanical Turk. Meeting of the
Midwest Political Science Association.
Amasino, D. R., Sullivan, N. J., Kranton, R. E., & Huettel, S. A. (2019).
Amount and time exert independent influences on intertemporal choice.
Nature Human Behaviour, 3(4), 383–392.
https://doi.org/10.1038/s41562-019-0537-2.
Arieli, A., Ben-Ami, Y., & Rubinstein, A. (2011). Tracking Decision Makers
under Uncertainty. American Economic Journal: Microeconomics,
3(4), 68–76. https://doi.org/10.1257/mic.3.4.68.
Ashby, N. J. S., Walasek, L., & Glöckner, A. (2015). The effect of
consumer ratings and attentional allocation on product valuations.
Judgment and Decision Making, 10(2), 172–184.
Buchanan, E. M., & Scofield, J. E. (2018). Methods to detect low quality
data and its implication for psychological research. Behavior
Research Methods, 50(6), 2586–2596.
https://doi.org/10.3758/s13428-018-1035-6.
Buhrmester, M., Kwang, T., & Gosling, S. D. (2011). Amazon’s Mechanical
Turk: A new source of inexpensive, yet high-quality, data?
Perspectives on Psychological Science, 6(1), 3–5.
https://doi.org/10.1177/1745691610393980.
Carter, B. T., & Luke, S. G. (2020). Best practices in eye tracking
research. International Journal of Psychophysiology,
155, 49–62. https://doi.org/10.1016/j.ijpsycho.2020.05.010.
de Leeuw, J. R. (2015). jsPsych: A JavaScript library for creating
behavioral experiments in a Web browser. Behavior Research
Methods, 47(1), 1–12. https://doi.org/10.3758/s13428-014-0458-y.
Dupuis, M., Meier, E., & Cuneo, F. (2019). Detecting computer-generated
random responding in questionnaire-based data: A comparison of seven
indices. Behavior Research Methods, 51(5), 2228–2237.
https://doi.org/10.3758/s13428-018-1103-y.
Fiedler, S., & Glöckner, A. (2012). The dynamics of decision making in
risky choice: An eye-tracking analysis. Frontiers in Psychology,
3. https://doi.org/10.3389/fpsyg.2012.00335.
Fisher, G. (2017). An attentional drift diffusion model over
binary-attribute choice. Cognition, 168, 34–45.
https://doi.org/10.1016/j.cognition.2017.06.007.
Ghaffari, M., & Fiedler, S. (2018). The power of attention: Using eye gaze
to predict other-regarding and moral choices. Psychological
Science, 29(11), 1878–1889.
https://doi.org/10.1177/0956797618799301.
Gluth, S., Kern, N., Kortmann, M., & Vitali, C. L. (2020). Value-based
attention but not divisive normalization influences decisions with
multiple alternatives. Nature Human Behaviour.
https://doi.org/10.1038/s41562-020-0822-0.
Goodman, J. K., & Paolacci, G. (2017). Crowdsourcing consumer research.
Journal of Consumer Research, 44(1), 196–210.
https://doi.org/10.1093/jcr/ucx047.
Hausfeld, J., von Hesler, K., & Goldlücke, S. (2021). Strategic gaze: An
interactive eye-tracking study. Experimental Economics,
24(1), 177–205.
Just, M. A., & Carpenter, P. A. (1984). Using eye fixations to study
reading comprehension. New Methods in Reading Comprehension
Research, 151–182.
Krajbich, I. (2019). Accounting for attention in sequential sampling models
of decision making. Current Opinion in Psychology, 29,
6–11. https://doi.org/10.1016/j.copsyc.2018.10.008.
Krajbich, I., Armel, C., & Rangel, A. (2010). Visual fixations and the
computation and comparison of value in simple choice. Nature
Neuroscience, 13(10), 1292–1298. https://doi.org/10.1038/nn.2635.
Krajbich, I., & Rangel, A. (2011). Multialternative drift-diffusion model
predicts the relationship between visual fixations and choice in
value-based decisions. Proceedings of the National Academy of
Sciences, 108(33), 13852–13857.
Majaranta, P., Räihä, K.-J., Hyrskykari, A., & Špakov, O. (2019). Eye
Movements and Human-Computer Interaction. In C. Klein & U. Ettinger
(Eds.), Eye Movement Research: An Introduction to its Scientific
Foundations and Applications (pp. 971–1015). Springer International
Publishing. https://doi.org/10.1007/978-3-030-20085-5_23.
Mason, W., & Suri, S. (2012). Conducting behavioral research on Amazon’s
Mechanical Turk. Behavior Research Methods, 44(1), 1–23.
https://doi.org/10.3758/s13428-011-0124-6.
Mathias, M., Benenson, R., Pedersoli, M., & Van Gool, L. (2014). Face
detection without bells and whistles. European Conference on Computer
Vision, 720–735.
Mormann, M., Griffiths, T., Janiszewski, C., Russo, J. E., Aribarg, A.,
Ashby, N. J. S., Bagchi, R., Bhatia, S., Kovacheva, A., Meissner, M., &
Mrkva, K. J. (2020). Time to pay attention to attention: Using
attention-based process traces to better understand consumer
decision-making. Marketing Letters, 31(4), 381–392.
https://doi.org/10.1007/s11002-020-09520-0.
Nakayasu, H., Miyoshi, T., Aoki, H., Kondo, N., & Patterson, P. (2011).
Analysis of Driver Perceptions and Behavior When Driving in an Unfamiliar
Traffic Regulation. Journal of Advanced Computational Intelligence
and Intelligent Informatics, 15, 1038–1048.
https://doi.org/10.20965/jaciii.2011.p1039.
Noguchi, T., & Stewart, N. (2014). In the attraction, compromise, and
similarity effects, alternatives are repeatedly compared in pairs on
single dimensions. Cognition, 132(1), 44–56.
https://doi.org/10.1016/j.cognition.2014.03.006.
Papoutsaki, A., Sangkloy, P., Laskey, J., Daskalova, N., Huang, J., &
Hays, J. (2016). Webgazer: Scalable webcam eye tracking using user
interactions. Proceedings of the Twenty-Fifth International Joint
Conference on Artificial Intelligence-IJCAI 2016.
https://par.nsf.gov/servlets/purl/10024076.
Pärnamets, P., Johansson, P., Hall, L., Balkenius, C., Spivey, M. J., &
Richardson, D. C. (2015). Biasing moral decisions by exploiting the
dynamics of eye gaze. Proceedings of the National Academy of
Sciences, 112(13), 4170–4175.
https://doi.org/10.1073/pnas.1415250112.
Payne, J. W., Bettman, J. R., & Johnson, E. J. (1988). Adaptive strategy
selection in decision making. Journal of Experimental Psychology:
Learning, Memory, and Cognition, 14(3), 534–552.
https://doi.org/10.1037/0278-7393.14.3.534.
Pell, M. D., & Kotz, S. A. (2011). On the time course of vocal emotion
recognition. PLoS ONE, 6(11).
https://doi.org/10.1371/journal.pone.0027256.
Permut, S., Fisher, M., & Oppenheimer, D. M. (2019). Taskmaster: A tool
for determining when subjects are on task. Advances in Methods and
Practices in Psychological Science, 2(2), 188–196.
Pieters, R., & Wedel, M. (2004). Attention capture and transfer in
advertising: Brand, pictorial, and text-size effects. Journal of
Marketing, 68(2), 36–50.
https://doi.org/10.1509/jmkg.68.2.36.27794.
Polonio, L., Di Guida, S., & Coricelli, G. (2015). Strategic
sophistication and attention in games: An eye-tracking study.
Games and Economic Behavior, 94, 80–96.
https://doi.org/10.1016/j.geb.2015.09.003.
Rayner, K. (2009). The 35th Sir Frederick Bartlett Lecture: Eye movements
and attention in reading, scene perception, and visual search.
Quarterly Journal of Experimental Psychology, 62(8),
1457–1506.
Reeck, C., Wall, D., & Johnson, E. J. (2017). Search predicts and changes
patience in intertemporal choice. Proceedings of the National
Academy of Sciences, 114(45), 11890–11895.
https://doi.org/10.1073/pnas.1707040114.
Reutskaja, E., Nagel, R., Camerer, C. F., & Rangel, A. (2011). Search
dynamics in consumer choice under time pressure: An eye-tracking study.
American Economic Review, 101(2), 900–926.
https://doi.org/10.1257/aer.101.2.900.
Robal, T., Zhao, Y., Lofi, C., & Hauff, C. (2018). Webcam-based attention
tracking in online learning: A feasibility study. 23rd International
Conference on Intelligent User Interfaces, 189–197.
Russo, J. E., & Dosher, B. A. (1983). Strategies for multiattribute binary
choice. Journal of Experimental Psychology. Learning, Memory, and
Cognition, 9(4), 676–696.
https://doi.org/10.1037//0278-7393.9.4.676.
Russo, J. E., & Rosen, L. D. (1975). An eye fixation analysis of
multialternative choice. Memory & Cognition, 3(3),
267–276. https://doi.org/10.3758/BF03212910.
Schulte-Mecklenbeck, M., Kühberger, A., & Johnson, J. G. (2019). A
handbook of process tracing methods. Routledge.
Semmelmann, K., & Weigelt, S. (2018). Online webcam-based eye tracking in
cognitive science: A first look. Behavior Research Methods,
50(2), 451–465. https://doi.org/10.3758/s13428-017-0913-7.
Sepulveda, P., Usher, M., Davies, N., Benson, A. A., Ortoleva, P., & De
Martino, B. (2020). Visual attention modulates the integration of
goal-relevant evidence and not value. Elife, 9, e60705.
Sheng, F., Ramakrishnan, A., Seok, D., Zhao, W. J., Thelaus, S., Cen, P.,
& Platt, M. L. (2020). Decomposing loss aversion from gaze allocation and
pupil dilation. Proceedings of the National Academy of Sciences,
117(21), 11356–11363.
Shimojo, S., Simion, C., Shimojo, E., & Scheier, C. (2003). Gaze bias both
reflects and influences preference. Nature Neuroscience,
6(12), 1317–1322. https://doi.org/10.1038/nn1150.
Smart, R. G. (1966). Subject selection bias in psychological research.
Canadian Psychologist/Psychologie Canadienne, 7(2), 115.
Smith, S. M., & Krajbich, I. (2018). Attention and choice across domains.
Journal of Experimental Psychology. General, 147(12), 1810–1826.
https://doi.org/10.1037/xge0000482.
Smith, S. M., & Krajbich, I. (2021). Mental representations distinguish
value-based decisions from perceptual decisions. Psychonomic Bulletin &
Review, 28, 1413–1422.
Teoh, Y. Y., Yao, Z., Cunningham, W. A., & Hutcherson, C. A. (2020).
Attentional priorities drive effects of time pressure on altruistic
choice. Nature Communications, 11(1), 3534.
https://doi.org/10.1038/s41467-020-17326-x.
Valliappan, N., Dai, N., Steinberg, E., He, J., Rogers, K., Ramachandran,
V., Xu, P., Shojaeizadeh, M., Guo, L., Kohlhoff, K., & Navalpakkam, V.
(2020). Accelerating eye movement research via accurate and affordable
smartphone eye tracking. Nature Communications, 11(1),
4553. https://doi.org/10.1038/s41467-020-18360-5.
Wang, J. T., Spezio, M., & Camerer, C. F. (2010). Pinocchio’s pupil: Using
eyetracking and pupil dilation to understand truth telling and deception
in sender-receiver games. American Economic Review,
100(3), 984–1007. https://doi.org/10.1257/aer.100.3.984.
Wedel, M., & Pieters, R. (2007). A review of eye-tracking research in
marketing. Review of Marketing Research, Volume 4, 123–146.
Xu, P., Ehinger, K. A., Zhang, Y., Finkelstein, A., Kulkarni, S. R., &
Xiao, J. (2015). TurkerGaze: Crowdsourcing saliency with webcam based eye
tracking. ArXiv:1504.06755 [Cs]. http://arxiv.org/abs/1504.06755.
This document was translated from LATEX by
HEVEA.