Judgment and Decision Making, Vol. 16, No. 6, November 2021, pp. 1439-1463
Success stories cause false beliefs about success
George Lifchits
a
b
Ashton Anderson
c
b Daniel G. Goldstein
d
e
Jake M. Hofman
f
e
Duncan J. Watts
g
|
Abstract: Many popular books and articles that purport to explain how people, companies, or ideas succeed highlight a few successes chosen to fit a particular narrative. We investigate what effect these highly selected “success narratives” have on readers’ beliefs and decisions. We conducted a large, randomized, pre-registered experiment, showing participants successful firms with founders that all either dropped out of or graduated college, and asked them to make incentive-compatible bets on a new firm. Despite acknowledging biases in the examples, participants’ decisions were very strongly influenced by them. People shown dropout founders were 55 percentage points more likely to bet on a dropout-founded company than people who were shown graduate founders. Most reported medium to high confidence in their bets, and many wrote causal explanations justifying their decision. In light of recent concerns about false information, our findings demonstrate how true but biased information can strongly alter beliefs and decisions.
Keywords: communication, selection bias, decision-making
Why do some people, products, and firms succeed while others fail? This question has deep implications for understanding matters from distributional fairness in society to human achievement, and has inspired a correspondingly rich history of inquiry in the academic literature and in the popular press (Frank, 2016,Mauboussin, 2012). In this work, we are concerned primarily with “success narratives” that lean heavily on the analysis of a small set of carefully selected examples. To illustrate what we mean by a success narrative, the 1982 bestseller In Search of Excellence (PetersWaterman, 2006) discussed how a set of “excellent” companies share eight common properties, such as a “bias for action” and “simultaneous loose-tight properties.” The 2001 bestselling book Good to Great (Collins, 2001) examined 11 “great” companies and identified seven characteristics they held in common, including “Level 5 leadership” and a “culture of discipline,” that it claimed explained their success. The 2013 bestselling book David and Goliath (Gladwell, 2013) advanced the notion that dyslexia can be a “desirable difficulty” on the basis of a handful of successful business people who are also dyslexic. An influential 2013 TechCrunch article (Lee, 2013) analyzed the common characteristics of 39 “unicorn” companies, defined as venture-backed startups that have attained a valuation over a billion dollars, discussed several trends among these successes, including that young, inexperienced founders are rare, or that consumer-oriented unicorns are more common and worth more in aggregate than enterprise-oriented unicorns, but enterprise unicorns are worth more on average. Finally, a 2018 New York Times article broke down the morning habits of 300 “high achievers,” including both their average wake-up time and a recommendation to get enough sleep (Spall, 2018).
Although in the absence of a systematic survey it is difficult to quantify the prevalence of success narratives relative to other styles of explanation, they are sufficiently numerous and influential to have inspired a mini-literature of books and articles aimed at critiquing them, (see, e.g., Bennett, 2009,Chabris, 2013,Denrell, 2005,Raynor, 2007,Rosenzweig, 2007,Taleb, 2005). Of the many criticisms that have been levelled, here we focus on two that are inherent to the success narrative style and hence are pervasive. First and most obviously, success narratives suffer from selection on the dependent variable. They overwhelmingly analyze successes but ignore failures, an often-decried inferential error (Berk, 1983,Denrell, 2003,Geddes, 1990,King et al., 1994). Because any feature common to successes may also be common among failures, simply finding that some feature (e.g., starting the workday at 5 in the morning) is present among a small sample of successes does not on its own imply that it is predictive of success. Second, an equally prevalent but less appreciated aspect of success narratives is that they also exhibit what we call selection on the independent variable(s). Any person or company can be characterized by many features (independent variables), yet emotionally satisfying narrative explanations emphasize just one or a few of them.
Given a small set of successes, one can often find a feature that is common to them; and given a feature, one can often find a small set of successes that display it.
However, a particular feature being common to a small, selected set of successes does not necessarily imply that it is common even among successes.
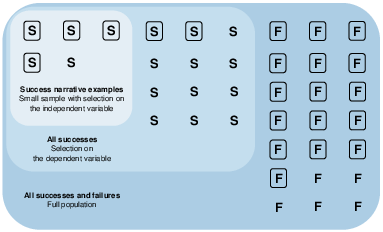
| Figure 1:
How two types of selection can lead to false conclusions.
If one focuses on only a small set of successes (the smallest region), it may appear that success is highly correlated with the rectangle feature, as 4 out of 5 of these successes have rectangles. If, however, one were to consider all successes (the middle region), one might draw the opposite conclusion, as only 6 out of all 17 successes have rectangles. Considering the full population shows that the rectangles are in fact more associated with failure than success. |
Figure 1 illustrates how selection on the dependent variable in combination with small samples and selection on the independent variable can make the presence of arbitrary features appear predictive in one direction even when the association in a more representative sample is in the opposite direction.
Consider a simple world in which people have two possible outcomes, success (S) and failure (F), and some have a feature of interest (depicted as a rectangle around their outcome) while others don’t. In the outermost region depicted in Figure 1 within “all successes and failures,” it is clear that those with the rectangle feature are more likely to be failures than successes. However, by neglecting to consider failures and focusing exclusively on successes (within “all successes”), the preponderance of rectangles among failures is obscured, although the low prevalence of rectangles among successes is still apparent. Finally, by selecting and studying only a small, biased sample of successes (within “success narrative examples”) one might be misled into thinking that the rectangle feature is over-represented among successes.
Although we do not presume that authors literally follow the steps outlined here, Figure 1 nonetheless demonstrates how, by selecting on cases and features, almost any feature of interest can appear to be associated with success in a meaningful way as long as there exists at least some successes in which the feature is present. Conversely, it follows that even the most compelling success narratives convey little information regarding the true association between a particular feature and success.
One example cited above (Gladwell, 2013) suggests that “an extraordinarily high number of successful entrepreneurs are dyslexic.” However, the evidence for this claim comes from a single survey of a convenience sample of entrepreneurs that had a 7% response rate (Logan, 2009). Given that millions of Americans could have dyslexia, and thousands of business people are at least as successful as those in the sample, the mere existence of successful dyslexics offers no evidence to support a predictive (let alone causal) effect of dyslexia on success.
While previous work on success narratives has focused on inferential errors exhibited by the narratives themselves (Denrell, 2003), here we are concerned with a related but distinct question: regardless of how authors arrive at them, do these narratives cause
readers to arrive at incorrect
inferences about reality, and if so, are these effects large enough to matter? The answer is not a priori obvious. On the one hand, prior work in other contexts has shown that readers often attend to biased subsets of data and that presentation of biased persuasive arguments can impact observer evaluations. For example, the literature on “cell-A bias” (NisbettRoss, 1980) has found that people gravitate towards subsets of cases in which both a feature and a positive outcome are present. Because selection on dependent and independent variables described above closely resembles cell-A bias, one might expect success narratives to be more appealing and more persuasive than other available explanations. Relatedly, (Brenner et al., 1996) found that participants in mock jury trials were swayed by one-sided persuasive arguments even when they knew these arguments were one-sided.
This line of evidence supports the hypothesis that individuals behave like “naïve intuitive statisticians” (FiedlerJuslin, 2006) who interpret biased samples as-is.
On the other hand, it is not clear whether these effects occur in more realistic contexts,
or whether they outweigh potentially countervailing effects, of which there are at least four.
First, from a statistical point of view, there are settings in which over-sampling on the dependent variable can be reasonable, so long as the appropriate adjustments are made when drawing inferences. For example, (KingZeng, 2001) show that when an outcome of interest is very rare (e.g., extreme success), methods that over-sample positive events (e.g., successes) and randomly sample a small fraction of nonevents (e.g., failures), and then apply the proper statistical corrections, are consistent and more efficient than straightforward random sampling. Although it is highly unlikely that readers of popular business books are applying this “case control” method in its formal instantiation, they are likely to know about other cases that are at odds with those described in a given narrative, and may use this outside information to down-weight the evidence offered by the narrative, thereby accomplishing a similar result, albeit informally and approximately.
Experimental results suggest that corrections are made by integrating biased evidence with beliefs recalled from memory (Elwin et al., 2007), or by accounting for the sampling process (Hayes et al., 2019).
Second, under very specific conditions, one can in fact make a valid inference from a sample that includes only successes without making the statistical corrections mentioned above.
As we show formally in the Appendix, Bayes’ theorem tells us that if any feature is more prevalent in a representative sample of successes than it is in the entire population, then success given the feature is more probable than success given its absence.
Crucially, however, this relies on two key assumptions, one about the set of examples the author has presented, and one about the reader’s knowledge beyond the information presented.
In particular, the sample of successes presented by the author must be representative.
Because authors typically present too few examples to be representative and because they may also sample on the independent variable, this is unlikely to be the case in success narratives.
In addition, the reader would need to have an accurate estimate of the base rate of success to know that the success rate in the sample exceeds that in the entire population.
If both of these rather unlikely conditions hold, however, one can draw a valid conclusion from reasoning about a sample that includes only successes.
Third, the authors of success narratives often append disclaimers, caveats, and alternative explanations that, if read carefully, would cause readers to discount the evidence presented. Returning to the dyslexia example, the author is careful to note that an alternative explanation to dyslexia being a cause of success is simply that “this remarkable group of people triumphed in spite of their disability: they are so smart and so creative that nothing — not even a lifetime of struggling with reading — could stop them” (Gladwell, 2013). Presumably it is not the author’s intent to undermine their own thesis by offering an alternative explanation that on its face is at least as plausible as his preferred one, but one could nevertheless argue that the reader has been properly informed about the existence of other explanations and therefore could down-weight the evidence that is presented accordingly.
Previous studies suggest that prompting the reader to consider evidence that was not shown can be an effective debiasing technique (KoehlerMercer, 2009,Tong et al., 2018).
Finally, it is possible that consumers of success narratives view them more as a form of entertainment or inspiration than as empirically valid explanations. According to this view, authors are not making empirical claims or advancing theories in the scientific sense at all. Rather they are simply telling stories that illuminate some other, larger message about human nature or values that they consider to be important or simply thought-provoking. For example, even if the reader is not actually persuaded that dyslexia is an advantage, the idea that something as seemingly harmful as dyslexia could be viewed as an advantage is still intriguing and might cause them to wonder about other seemingly implausible associations. Likewise, even if readers of Good to Great do not come away believing that such a thing as “level 5 leadership” can be reliably identified and harnessed to make their companies great, they may still find it useful to think through Collins’ ideas about what makes some leaders more effective than others. If this “success story as fable” interpretation is correct, as some authors and even some critics have suggested (Bennett, 2009,Raynor et al., 2009), and if readers understand the authors’ true intent, then it may not matter that they aren’t empirically or statistically valid. As long as readers don’t take success narratives as literal prescriptions for success then it may not matter much that they are statistically biased.
In this paper we do not attempt to disambiguate all of these competing hypotheses. As the above discussion exemplifies, there are many ways in which biased information may — or may not — be integrated into existing beliefs, and we defer a comprehensive exploration of the precise psychological mechanisms at play for future work.
Instead we focus on the simpler, pre-requisite question of whether an effect exists at all, regardless of the underlying mechanism: to what extent do success narratives actually change readers’ real beliefs and decision-making about the predictors and even causes of success? This question is of interest for three reasons. First, the answer will determine how concerned we ought to be about the effect of success narratives in practice. If success narratives do not in fact significantly sway real decisions, then as a practical matter they are not problematic even if in principle they are flawed, just as others have argued previously. On the contrary, if the effect is large then the practical concern remains relevant. Second, if the answer is that success narratives do sway real beliefs by a large amount then we should also worry more broadly about the effects of information that is biased even if not outright false. Recently there has been great concern about the corrupting effects of misinformation in the political, scientific, and health domains; yet comparatively little attention has been paid to the corresponding effects of selectively presenting factually accurate information in a way that implies a false conclusion. Finally, if the effect is large then it raises additional theoretically interesting questions about the psychological mechanisms that are responsible, and hence which potential mitigating strategies would be effective.
Experimental Design
We designed a three-condition, between-subjects experiment to answer the following questions:
-
How much are participants’ incentive-compatible bets on the likelihood of a particular outcome swayed by a small and biased set of examples, even when the underlying bias is acknowledged by them?
- How confident are participants in these bets?
- To what extent do participants offer explanations that rationalize their beliefs?
Participants were tasked with the goal of predicting whether a startup company founded by a college graduate or a college dropout is more likely to become a billion-dollar “unicorn.” We chose this topic in part because of its close resemblance to an especially influential example of the genre of success narratives (Lee, 2013,Lee, 2015) and in part because the relationship between education and entrepreneurial success has been widely but inconclusively discussed by both academics and journalists.1
Thus, the domain has external validity while still allowing participants to enter the experiment with a diversity of opinions on the matter.
We emphasize that our test of the effect of success narratives was intended to be as conservative and tightly controlled as possible. First, by stripping out the rich storytelling that authors often deploy to engage their readers, by explicitly featuring clear caveats and alternative explanations, and by requiring participants to actively acknowledge these caveats, our manipulation was substantially weaker than in most real-world examples.
Second, by requiring our participants to make incentive real-stakes bets
based on the information we provided, our measurement of the effect was
again conservative. As has been demonstrated in other contexts (Bago et al., 2020,PennycookRand, 2019,Van Bavel et al., 2020), respondents are less susceptible to false information when they are required to deliberate on it; thus, to the extent that we do see effects in our experiments, we again expect the influence of real-world success narratives to be greater than what we observe here.
Third, because the direction of a bet could shift even with a small change in beliefs — from a weakly held belief in one direction to a weakly held belief in the other direction — we also asked participants to explicitly state their confidence in their bets. In this way we were able to quantify not only whether beliefs shifted, but if so, by how much. Finally, we deliberately omitted from our own narratives any causal or even associational justifications. In contrast with many real-world examples, therefore, if participants felt the need to rationalize their decisions with an explanation, they had to generate that explanation themselves.
Our experiment design and analysis plan was pre-registered on AsPredicted2, and was approved by the Microsoft Research IRB (#561). Participation in the study was conditional on providing informed consent.
We recruited participants and administered the experiment on Amazon Mechanical Turk. Screenshots of the experiment as it appeared for all three conditions are available in the Supplementary Material Figures S1–S6.
Participants were paid $0.50 for completing the study with the possibility of a $1.00 bonus (USD).
Experimental conditions and treatment
Upon agreeing to participate in the experiment, participants were told that “unicorns” are startup companies that have achieved a venture-capital valuation of over $1 billion.
Next, participants were randomly assigned to one of three data conditions where they were shown either a) a set of only successful college graduates, b) a set of only successful college dropouts, or c) no data.
In the first two conditions, participants were shown a short narrative stating that “Some people believe that a startup is more likely to be a unicorn if it was founded by” either a graduate or a dropout, depending on their data condition.
This sentence was followed by “Not everyone believes this, of course, and there are plenty of examples of unicorn startups” with founders of the opposite educational status.
In the no data condition, this sentence simply said that “People debate whether” graduate or dropout founders are more likely to be founders of unicorn companies.

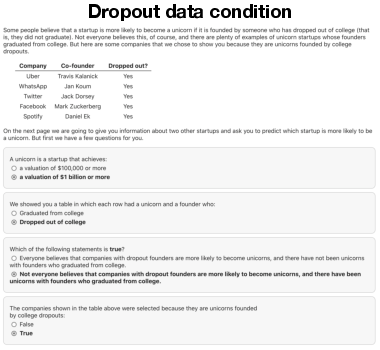
| Figure 2:
Stimuli and attention checks for each of the three conditions.
In our between-subjects experiment, participants were shown examples of either successful graduate or dropout founders (of the same companies), or no data in a control condition. |
Participants in the graduate (dropout) condition were then shown a table of five example startups that conformed to the narrative they were shown, including the names of the companies and the names of the five corresponding founders, all of whom had graduated (dropped out) of college.
To minimize confounds between the data conditions, we showed participants in both conditions identical sets of companies (Figure 2).
This was possible because many of the unicorn startups mentioned in these success narratives have at least two founders, one of which graduated from college and another who dropped out (e.g., Spotify, which was founded by Martin Lorentzon, who graduated from college, and Daniel Ek, who dropped out of college).
As a result, besides the narrative sentence mentioned above, the only thing that varied between conditions was the names of the five founders shown to participants and whether these founders graduated from (dropped out of) college.
Examples in the table were randomly ordered to avoid systematic position effects.
After seeing this information, participants answered a series of questions to verify that they understood both the scenario and the underlying bias in the examples they were shown. Specifically, we confirmed that:
-
They understood that a unicorn company is valued at over $1 billion;
- We showed them examples of graduates (in condition a) or dropouts (in condition b);
- “Not everyone believes” (conditions a and b) or “most people are unsure” (condition c) that it is more likely for one group to found unicorns over the other;
- And the examples in the table were selected because they are founded by graduates (condition a) or because they are founded by dropouts (condition b).
Each question was a binary choice. To avoid position effects, the order of response choices for each question was randomized for each participant.
Screenshots of these questions as they appeared in each condition of the experiment are provided in the Supplementary Material Figures S1–S3.
Aside from ensuring that participants had a sufficient understanding of our operationalization of success, these questions clearly indicated that the examples shown were biased and that data supporting the “other side” also existed. It was expected that requiring participants to answer these questions would mitigate the effect of the biased examples on our subsequent measurements of belief.
When answering these questions, participants were not shown whether or not their answers were correct, and were able to proceed in the experiment regardless of their answers; however, those failing any of these questions were excluded from our analysis as per our pre-registration plan.
Incentive-compatible decision and payout scheme
After participants were shown the narrative and examples, they were presented with the choice to bet on either an (unnamed) graduate founder or an (unnamed) dropout founder, and told that if their choice was a founder who started a “unicorn” company, they would receive a bonus payment of $1.00 USD.
This incentive-compatible decision was designed to elicit honest beliefs as long as participants recognized that their choice would be evaluated against examples drawn from an unbiased distribution of founders. To that end, before participants made their bets, we explained that these two founders were to be drawn from a representative database of startup companies that did not include the examples they had already been shown. Participants were again asked to acknowledge this information and could proceed in the experiment regardless of their answer; however, participants who answered negatively were also excluded from our main analysis.
Screenshots of the experiment for this decision task including acknowledgments are provided in the Supplementary Material Figures S4–S6.
To assign bonuses based on participants’ predictions, we relied on (imperfect) estimates (Lee, 2013,Lee, 2015) suggesting that approximately 0.1% of all startups become unicorns.
After the experiment, for each participant we randomly assigned a success outcome to each the graduate founder and the dropout founder with equal odds of 1 in 500 (which doubles our rough estimate of the probability of unicorn success), and awarded the bonus payout if the founder they chose obtained the randomized success outcome.
Confidence
To allow participants to express richer beliefs, we also asked them to indicate their confidence in their decision bet on a continuous slider (coded from 0-100) where the endpoints are labeled “completely unsure” to “absolutely certain”.
Although the actual numeric value of the slider was not visible, as participants adjusted the slider they were shown a sentence summarizing their bet and their provided confidence expressed in words as
“completely unsure” (value of 0), “somewhat confident” (value from 1 to 32), “fairly confident” (value from 33 to 66), “very confident” (value from 67 to 99), “absolutely certain” (value of 100).
To avoid anchoring effects, this slider was not initialized to any default value (the handle appeared when the cursor hovered over the slider region), and participants had to click to choose a value before proceeding.
Free-text justification and coding procedure
After making their bet and providing confidence in their decision, participants were given the option to provide justification of their bet as a free-text response, prompted by the question “Could you explain the reason(s) why you made this decision?”
As described in the Appendix and discussed below, these justifications were categorized using a pre-registered codebook to distinguish between “explanations”, “associations”, and otherwise “uninformative” responses.
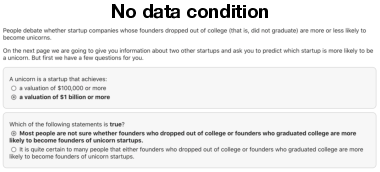
| Figure 3:
Schematic of the experiment design. |
The experimental flow just described is summarized and illustrated in Figure 3. As noted in the previous section, our manipulation was relatively weak compared with the sort of best-selling books that present much longer and richer versions of these narratives. To reiterate, we showed five tightly-controlled examples in each condition, unaccompanied by any further description of them or how they relate to each other. More importantly, we did not present any argument for why the feature in question (in our case, graduating from or dropping out of college) should be related to success. Further, we ensured that participants explicitly and correctly stated they understood that the data being presented to them were biased by selecting successful companies that were founded by graduates (or dropouts, depending on their experimental condition). This allowed us to measure the effects of identical populations consuming biased and opposing accounts of success. To the extent that participants in these opposing conditions differ in their incentive-compatible decisions, consuming even a weak version of a biased success story has measurable consequences.
Results
We recruited 1,650 participants on Amazon Mechanical Turk, of which 84% correctly answered all attention checks in their condition, and 94% indicated that they understood the payout was to be judged on two companies sampled from our representative data (and did not include any that were shown to the participant). After applying the pre-registered exclusion of participants who did not meet both conditions, our final sample comprised N = 1,317 participants, 80% of our original sample.
Participants were assigned to experimental conditions using their worker ID string as a randomization, resulting in n = 451 participants who saw graduates data, n = 460 participants who saw no data, and n = 406 participants who saw dropouts data.
The results of this analysis on the full sample are available in the Supplementary Material Figures S7, S8, and yield similar results to those presented below. In this section and the Supplementary Material, we report all measures, conditions, exclusions, and analysis mentioned in our pre-registration plan. All data and code necessary to reproduce the analyses in this paper and the Supplementary Material are freely available online3.
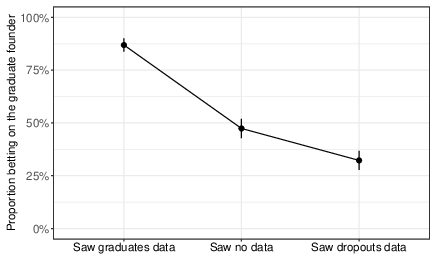
| Figure 4:
Proportion of participants in each condition who bet on the graduate founder.
Error bars show 95% confidence intervals. |
Incentive-compatible bets
Our main dependent variable is the proportion of participants in each data condition who chose to bet on the unnamed graduate founder. Are participants more likely to bet on a graduate founder after seeing a few examples of successful graduate founders, even though they explicitly acknowledged that this small set was hand-selected to fit a particular narrative and not representative of successes more generally?
We observe a strikingly large difference in how participants bet depending on which biased set of examples they were randomly assigned to see.
As shown in Figure 4, participants who saw examples of graduate co-founders subsequently bet on an unnamed graduate founder 87% of the time, while only 32% of participants who were shown examples of dropout co-founders bet on the graduate founder
(Pearson χ2 = 266.02, df = 1, P < 0.0001, 95% CI = 0.49 to 0.60), a difference of 55 percentage points.
This constitutes an effect on participants’ propensity to bet on the graduate founder (Cohen’s h = 1.19) significantly beyond the 0.8 value that is deemed “large” in Cohen’s classification of h values (Cohen, 1988).
Furthermore, this substantial effect on decisions occurs despite the fact that all participants in this analysis acknowledged that the small set of examples they saw were specifically selected based on the highlighted feature and for being successful.
Our experimental setup also did not include an accompanying narrative or compelling story to argue why graduates or dropouts should be more likely to find startup success.
Rather than discounting the few examples they were shown, participants were heavily influenced by them — and in opposing, mutually exclusive directions.
In the success narratives that appear in bestselling books and influential articles, where carefully selected sets of examples are presented with narratives and explanations but without disclaimers alerting readers to the bias of the presentation, the effects on subsequent decisions are likely even greater than the large one we observe here.
Besides acknowledging selection bias in the examples they were shown, participants also made their bets with the understanding that bonus payments would be determined by an unbiased random draw of founders. As such, participants were incentivized to bet on the founder that they truly believed to have the higher probability of success. We verified that our participants behaved accordingly in two ways. First, we asked participants to acknowledge that their payout would rely on a random draw from a representative sample of founders, and we excluded any participants who failed to acknowledge this. Second, the vast majority of coded justifications provided by participants indicated that their bet was based on a perceived association between the feature they were shown and success, as opposed to a demand effect where participants make the choice that they perceive to be appropriate given the context of the experiment (see the Justifications section). As a result, the large difference in betting behavior we see reflects participants’ true beliefs about success after they were randomly shown successful examples of graduates or dropouts.
We also compare participants who were shown examples (i.e., in the graduate or dropout data conditions) with those who were assigned to see no examples of startup founders at all.
We observe a large, significant effect on the propensity to bet on the graduate founder between those who were shown examples of graduate founders and no data
(87% versus 47%, Pearson χ2 = 159.04, df = 1, P < 0.0001, 95% CI = 0.34 to 0.45, Cohen’s h = 0.88),
as well as a small, significant effect between those who were shown no data and those who were shown examples of dropout founders
(47% versus 32%, Pearson χ2 = 19.88, df = 1, P < 0.0001, 95% CI = 0.08 to 0.22, Cohen’s h = 0.31).
These results suggest that simply showing biased examples of successes can substantially affect people’s beliefs relative to not showing examples at all.
In our specific case of startup success, it appears that examples of graduate founders are more compelling than examples of dropout founders, but participants were significantly swayed in both directions.
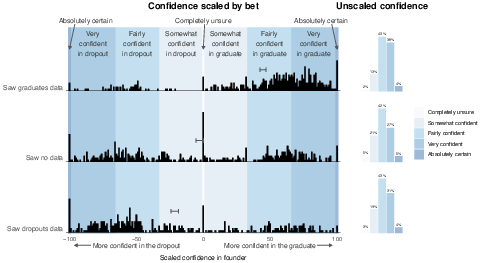
| Figure 5:
Confidence indicated by participants.
Left panel: the full distribution of slider values provided by participants in each condition, scaled by their bet. A value of 100 means the participant was “absolutely certain” and bet on the graduate, while -100 means the participant was “absolutely certain” and bet on the dropout, and 0 means the participant was “completely unsure”.
Error bars show standard error of the mean.
Shaded regions indicate the label shown to participants that corresponds to the confidence they provided.
Right panel: the proportion of (unscaled) confidence responses that fall within each label. |
Confidence
To complement the incentive-compatible forced-choice bet that participants made, we collected a secondary measure of each participant’s confidence in their decision. This second measure is important because one could in principle observe large directional differences in bets, but very low confidence in these bets if people are generally unsure of which founder to choose and are only mildly influenced by the examples they were shown. That is, people might indicate that they are effectively guessing. This was not the case.
Despite seeing opposing examples (or no data at all), the overwhelming majority of participants in all conditions expressed a substantial level of confidence in their decisions.
Specifically, 85% of participants who saw graduates, 78% of participants who saw dropouts, and 74% of participants who saw no data expressed that they were either “fairly confident”, “very confident”, or “absolutely certain” in their decision (Figure 5, right panel; the ungrouped distribution of confidence is presented in the Supplementary Material Figure S9, and for the full sample without exclusions in Supplementary Material Figure S10.
To quantify the directional shift in participants’ beliefs, we rescaled the confidence measure to account for the direction of each participant’s bet. Participants who bet on the graduate founder are coded as having a confidence ranging from 0 to 100, and participants who bet on the dropout founder as having confidence ranging from −100 to 0. As a result, a scaled confidence of 100 indicates certainty in the graduate, −100 indicates certainty in the dropout, and 0 indicates being completely unsure, regardless of the bet made.
The distribution of this scaled confidence measure is shown in the left panel of Figure 5.
The mean scaled confidence of participants who saw graduate co-founders is significantly higher than those who saw dropout co-founders
(45 versus -21, two-sided t-test, t(784.6) = 18.3, P < 0.0001, 95% CI = 58.88 to 73.03, Cohen’s d = 1.26).
Without representative data to make their inference, it is reasonable for participants to either indicate that they have low or zero confidence when choosing to bet on the graduate or the dropout founder, or to indicate the confidence level they felt before the experiment, regardless of which condition they were assigned to. Instead most participants indicated a relatively high degree of confidence in their decision, despite that decision being strongly influenced by the biased set of examples that they were randomly assigned to see.
Justifications
As noted earlier, the “narratives” provided in our treatment deliberately omitted any causal explanations or any other justification of the association between founder status and company success. To better understand how participants reasoned about this association, we gave all participants the opportunity to provide an optional free-text justification for their decision. Details on the coding procedure are described in the Appendix.
In all conditions, the vast majority of participants (99%) provided some kind of response.
Approximately 92% of responses included in the analysis had an “informative” code, meaning they appeared to reflect genuinely motivated responses (informative responses by data condition is presented in the Supplementary Material Table S1).
In contrast, only a small fraction of justifications were coded as demand effects: 3.1% among participants who were shown dropout examples, 1.6% among those who were shown graduate examples, and 0.2% among those shown no examples.
In all treatments a substantial proportion of participants provided an explanation as a justification for their decision.
Participants who saw examples of graduate co-founders provided explanations 49% of the time, compared to 32% for those who saw examples of dropout co-founders. These proportions were substantially higher than expected a priori, since we offered no information regarding possible mechanisms. Also surprisingly, the proportion of participants in the “no data” condition who provided an explanation for their decision was even higher (66%) than for those who did see data. Together, these results suggest a tendency for people to spontaneously generate causal explanations to rationalize their decisions even in the absence of supporting information.
We also observe that the explanations that our participants generated were overwhelmingly likely to offer positive reasons over negative ones. That is, people tended to give an explanation for why the founder they bet on is more likely to succeed, rather than providing reasons why the founder they bet against is less likely to succeed.
Of the participants who provided explanations,
94% of those who saw graduates data,
90% of those who saw dropout data,
and 95% of those who saw no data
provided positive explanations for their decision.
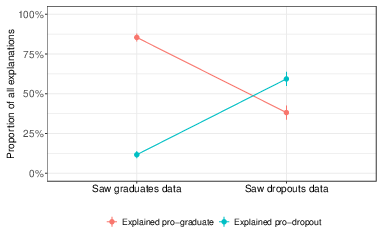
| Figure 6:
Types of explanations as a proportion of all explanations given.
Error bars show standard error. Some explanations were coded “unclear” as they did not specify which founder they were in favor of
(between 2.4% and 3.5% in each data condition), so these proportions do not sum to 1. |
Finally, Figure 6 shows the fraction of explanations in each condition that favored the graduate and dropout founders. Consistent with the betting behavior we observed, participants offered explanations that favored the examples they were randomly assigned.
Of participants who were shown examples of graduate co-founders and provided an explanation, 85% provided an explanation favoring the graduate founder, whereas only 38% of participants who were shown examples of dropout co-founders and provided an explanation did so in favor of the graduate founder
(Pearson χ2 = 77.99, df = 1, P < 0.0001, 95% CI = 0.37 to 0.58, Cohen’s h = 1.03).
The trend is reversed for explanations favoring the dropout founder: of participants who were shown dropout co-founders and provided an explanation, 59% of participants provided an explanation that favored the dropout founder, whereas only 12% of participants shown graduate co-founders and provided an explanation did so in favor of the dropout founder
(Pearson χ2 = 83.27, df = 1, P < 0.0001, 95% CI = 0.37 to 0.58, Cohen’s h = 1.06).
Among those who saw no data and provided explanations, 49% provided explanations in favor of the graduate founder:
this significantly differs between the 85% who provided explanations in favor of the graduate among those who saw graduates and provided explanations
(Pearson χ2 = 68.29, df = 1, P < 0.0001, 95% CI = 0.28 to 0.44, Cohen’s h = 0.80)
but does not significantly differ from the 38% who provided explanations in favor of the graduate among those who saw dropouts and provided explanations
(Pearson χ2 = 3.82, df = 1, P = 0.051, 95% CI = 0.00 to 0.22, Cohen’s h = 0.22).
Among those who saw no data and provided explanations, 47% of explanations favored the dropout founder:
this is significantly different from the 12% of explanations favoring the dropout provided by those who saw examples of graduates and provided explanations
(Pearson χ2 = 68.87, df = 1, P < 0.0001, 95% CI = 0.28 to 0.43, Cohen’s h = 0.82)
and also significantly different from the 59% of explanations favoring the dropout provided by those who saw examples of dropouts and provided explanations
(Pearson χ2 = 4.60, df = 1, P = 0.032, 95% CI = 0.01 to 0.23, Cohen’s h = 0.24).
Discussion
Our results contribute to several interrelated strands of prior work that have studied how people make inferences from biased samples of data. For example, scholars in sociology (Berk, 1983), comparative politics (Geddes, 1990), and the social sciences more broadly (King et al., 1994) have underscored that when studying empirical relationships, it is essential to include data that vary on the dependent variable. In the domain of this paper, this amounts to analyzing both successes and failures. As noted in the introduction, the well-documented tendency for popular books and articles to focus on successes (and exclude failures) has provoked a number of researchers to demonstrate the numerous ways that this approach can distort empirical observations about success and its relation to performance (Denrell, 2003,Raynor et al., 2009,Rosenzweig, 2007). However, from the perspective of individual actors, this bias towards successes has also been viewed as a potentially reasonable strategy in an uncertain world with limited information (StrangMacy, 2001). Studying how people make inferences from data, one generation of psychologists spurned neglect of falsifying examples (Smedslund, 1963,Wason, 1960), while a later generation acknowledged the adaptive benefits of learning from positive examples (KlaymanHa, 1987,NavarroPerfors, 2011,OaksfordChater, 1994).
Finally, it has been observed that in some settings people fail to adjust for non-representative examples (Hamill et al., 1980) or one-sided scenarios, such as hearing only the plaintiff’s arguments in a judicial case (Brenner et al., 1996).
In this paper, we complement and build upon these previous efforts by focusing on the extent to which popular and widely-read success narratives containing plainly biased examples affect people’s decision-making in terms of what choices they make, how confident they are in those choices, and the justifications they provide around them.
In our experiment, we observed a strikingly large difference in participants’ decisions depending on which condition they were assigned to: while 87% of people shown examples of successful graduates bet that graduates are more likely to succeed, only 32% of people shown examples of successful dropouts bet on graduates, a difference of 55 percentage points.
Far from discounting the small sets of examples they acknowledged as biased, participants were substantially swayed by them.
This strong effect on beliefs is caused by a weak manipulation that involves no outright deception.
The reversal occurs despite people being told that the examples were a selected sample designed to fit a particular narrative, despite each group being shown the same set of example companies, and despite the monetary bonus providing an incentive to respond truthfully.
Though some prior work predicts that our participants would not correct inferences due to the sampling bias presented in our treatment examples (Brenner et al., 1996,Fiedler, 2000,NisbettRoss, 1980,BorgidaNisbett, 1977), other prior work would predict either the opposite (Elwin et al., 2007,Hayes et al., 2019) or that transparency about the sampling process would significantly temper the effect sizes we observed (KoehlerMercer, 2009,Tong et al., 2018). Instead, we found that participants’ beliefs were significantly altered, with very large effect sizes. Our results suggest that people are strongly susceptible to this type of subtle but powerful distortion, which we believe to be common practice in media and communication.
Furthermore, participants in all groups reported high levels of confidence in their (ultimately opposing) bets.
Finally, participants tended to offer explanations — for instance that graduates are more successful because graduating requires persistence, or that dropouts are more successful because they are more creative — that were consistent with the biased sample they were randomly assigned to see, and often causal in nature.
Since the ability to explain correlational data is indicative of whether the data were perceived as causal evidence (Lombrozo, 2006), the rate at which participants provided explanations consistent with the data shown in their condition suggests that biased success stories may be used as the basis for causal beliefs.
As with any controlled study on human judgment, the effects observed in our experiment do not necessarily generalize to the more complex setting of real-world decision making. Nonetheless, as stated previously, our treatment is more conservative than most success narratives found in popular media. Additionally, our choice to elicit decisions as a forced binary choice may inflate effect size, but as our secondary measures of confidence and justifications indicate, there were few participants who would likely have indicated no change in belief. Moreover, a single binary decision mimics everyday decision making more faithfully than eliciting distributions of beliefs. Finally, since our study intended to measure the effects of success narratives, we do not claim that similar effects would be observed in all contexts beyond success stories, though we speculate that in many contexts of social decision making they would.
Our results also suggest that some success narratives are more persuasive than others. We expected that the specific examples of founders shown may impact participants’ perceptions of success differently, so we controlled for companies between conditions. However, we found it difficult to find examples where both co-founders are equally prominent; specifically, the dropout founders tended to be more prominent than their graduate counterparts (e.g., compare college dropout Mark Zuckerberg of Facebook to Eduardo Saverin; or the dropout Travis Kalanick of Uber, versus Garrett Camp, who received a bachelor’s degree).
As a result, we anticipated a possible bias favoring the dropout founder’s chances of success, but instead observed the opposite.
Relative to the baseline belief measured in the no data condition, showing examples of graduates produces a larger effect on participants’ bet outcome than showing examples of dropouts.
This bias towards graduate founders corresponds with studies showing that college education is over-represented among various samples of successes (Lee, 2013,Lee, 2015,Wadhwa et al., 2010,WaiRindermann, 2017).
Finally, our results also have implications for the impact of biased selections of examples on beliefs more generally. In recent years, researchers from a variety of disciplines have expressed great concern about the harmful effects of false information in the domains of politics, science, and health (Lazer et al., 2018). Our work shows that it is possible to induce individuals to arrive at unwarranted conclusions with factually accurate information that is simply presented in a biased manner. Even more strikingly, the effect occurs even when the selective nature of the evidence is clearly disclosed and the reader explicitly acknowledges the bias.
We have focused our attention on the domain of business success, but the style of manipulation we used — advocating for a particular position by “cherry picking” positive examples while excluding counterexamples — is broadly applicable. There are many examples of the selective presentation of factually accurate data in polarizing domains like climate science, gun control, immigration, police violence, and social insurance programs. Given the size of the effect that we found with a manipulation that would clearly pass a conventional fact check, our results suggest that more attention should be paid to the prevalence and impact of presenting biased selections of factually accurate examples.
References
-
[Bago et al., 2020]
-
Bago, B., Rand, D. G., & Pennycook, G. (2020).
Fake News, Fast and Slow: Deliberation Reduces Belief in False
(but Not True) News Headlines.
Journal of Experimental Psychology: General, 149(8),
1608–1613, https://doi.org/10.1037/xge0000729.
- [Bennett, 2009]
-
Bennett, D. (2009).
Luck Inc: The 7 Secrets of Really, Really Lucky Companies.
The Boston Globe.
https://bit.ly/3oMGpn7.
- [Berk, 1983]
-
Berk, R. A. (1983).
An Introduction to Sample Selection Bias in Sociological
Data.
American Sociological Review, 48(3), 386–398,
https://doi.org/10.2307/2095230.
- [Borenstein et al., 2009]
-
Borenstein, M., Hedges, L. V., Higgins, J. P. T., & Rothstein, H. R. (2009).
Introduction to Meta-Analysis.
Chichester, U.K.: John Wiley & Sons.
- [BorgidaNisbett, 1977]
-
Borgida, E. & Nisbett, R. E. (1977).
The differential impact of abstract vs. concrete information on
decisions.
Journal of Applied Social Psychology, 7(3), 258–271.
- [Brenner et al., 1996]
-
Brenner, L. A., Koehler, D. J., & Tversky, A. (1996).
On the Evaluation of One-Sided Evidence.
Journal of Behavioral Decision Making, 9(1), 59–70,
https://doi.org/10.1002/(SICI)1099-0771(199603)9:1<59::AID-BDM216>3.0.CO;2-V.
- [Chabris, 2013]
-
Chabris, C. (2013).
The Trouble With Malcolm Gladwell.
Slate Magazine.
https://bit.ly/3qmNP0U.
- [Cohen, 1988]
-
Cohen, J. (1988).
Statistical Power Analysis for the Behavioral Sciences.
Lawrence Erlbaum Associates, 2nd edition.
- [Collins, 2001]
-
Collins, J. (2001).
Good To Great: Why Some Companies Make the
Leap...And Others Don’t.
New York, NY: HarperBusiness.
- [DeMers, 2018]
-
DeMers, J. (2018).
Are College-Dropout Billionaire Entrepreneurs Really That
Common?
Entrepreneur.
https://bit.ly/2QBJirj.
- [Denrell, 2003]
-
Denrell, J. (2003).
Vicarious Learning, Undersampling of Failure, and the
Myths of Management.
Organization Science, 14(3), 227–243,
https://doi.org/10.1287/orsc.14.2.227.15164.
- [Denrell, 2005]
-
Denrell, J. (2005).
Selection Bias and the Perils of Benchmarking.
Harvard Business Review, 83(4), 114–119, 134.
- [EinhornHogarth, 1981]
-
Einhorn, H. J. & Hogarth, R. M. (1981).
Behavioral Decision Theory: Processes of Judgement and
Choice.
Annual Review of Psychology, 32(1), 53–88,
https://doi.org/10.1146/annurev.ps.32.020181.000413.
- [Elwin et al., 2007]
-
Elwin, E., Juslin, P., Olsson, H., & Enkvist, T. (2007).
Constructivist Coding: Learning From Selective Feedback.
Psychological Science, 18(2), 105–110,
https://doi.org/10.1111/j.1467-9280.2007.01856.x.
- [Fiedler, 2000]
-
Fiedler, K. (2000).
Beware of Samples! A Cognitive–Ecological
Sampling Approach to Judgment Biases.
Psychological Review, 107(4), 659–676,
https://doi.org/10.1037/0033-295X.107.4.659.
- [FiedlerJuslin, 2006]
-
Fiedler, K. & Juslin, P., Eds. (2006).
Information Sampling and Adaptive Cognition.
Cambridge: Cambridge University Press.
- [Fleiss et al., 2003]
-
Fleiss, J. L., Levin, B., & Paik, M. C. (2003).
Statistical Methods for Rates and Proportions.
Hoboken, N.J.: John Wiley & Sons, 3rd edition.
- [Frank, 2016]
-
Frank, R. H. (2016).
Success and Luck: Good Fortune and the Myth of
Meritocracy.
Princeton: Princeton University Press.
- [Geddes, 1990]
-
Geddes, B. (1990).
How the Cases You Choose Affect the Answers You Get:
Selection Bias in Comparative Politics.
Political Analysis, 2, 131–150,
https://doi.org/10.1093/pan/2.1.131.
- [Gladwell, 2013]
-
Gladwell, M. (2013).
David and Goliath: Underdogs, Misfits, and the
Art of Battling Giants.
New York: Little, Brown and Company.
- [Grice, 1989]
-
Grice, P. (1989).
Studies in the Way of Words.
Harvard University Press.
- [Hamill et al., 1980]
-
Hamill, R., Wilson, T. D., & Nisbett, R. E. (1980).
Insensitivity to Sample Bias: Generalizing from Atypical
Cases.
Journal of Personality and Social Psychology, 39(4),
578–589, https://doi.org/10.1037/0022-3514.39.4.578.
- [Hayes et al., 2019]
-
Hayes, B. K., Banner, S., Forrester, S., & Navarro, D. J. (2019).
Selective Sampling and Inductive Inference: Drawing Inferences
Based on Observed and Missing Evidence.
Cognitive Psychology, 113, 101221,
https://doi.org/10.1016/j.cogpsych.2019.05.003.
- [King et al., 1994]
-
King, G., Keohane, R. O., & Verba, S. (1994).
Determining What to Observe.
In Designing Social Inquiry: Scientific Inference in
Qualitative Research (pp. 115–149). Princeton, New Jersey:
Princeton University Press.
- [KingZeng, 2001]
-
King, G. & Zeng, L. (2001).
Logistic Regression in Rare Events Data.
Political Analysis, 9(02), 137–163,
https://doi.org/10.1093/oxfordjournals.pan.a004868.
- [KlaymanHa, 1987]
-
Klayman, J. & Ha, Y.-W. (1987).
Confirmation, Disconfirmation, and Information in
Hypothesis Testing.
Psychological Review, 94(2), 211–228,
https://doi.org/10.1037/0033-295X.94.2.211.
- [KoehlerMercer, 2009]
-
Koehler, J. J. & Mercer, M. (2009).
Selection Neglect in Mutual Fund Advertisements.
Management Science, 55(7), 1107–1121,
https://doi.org/10.1287/mnsc.1090.1013.
- [Lazer et al., 2018]
-
Lazer, D. M. J., et al. (2018).
The Science of Fake News.
Science, 359(6380), 1094–1096,
https://doi.org/10.1126/science.aao2998.
- [Lee, 2013]
-
Lee, A. (2013).
Welcome To The Unicorn Club: Learning From Billion-Dollar
Startups.
TechCrunch.
https://tcrn.ch/38Jzjdr.
- [Lee, 2015]
-
Lee, A. (2015).
Welcome To The Unicorn Club, 2015: Learning From
Billion-Dollar Companies.
TechCrunch.
https://tcrn.ch/38KYmwE.
- [Logan, 2009]
-
Logan, J. (2009).
Dyslexic Entrepreneurs: The Incidence; Their Coping Strategies and
Their Business Skills.
Dyslexia, 15(4), 328–346,
https://doi.org/10.1002/dys.388.
- [Lombrozo, 2006]
-
Lombrozo, T. (2006).
The Structure and Function of Explanations.
Trends in Cognitive Sciences, 10(10), 464–470,
https://doi.org/10.1016/j.tics.2006.08.004.
- [Mabmud, 2012]
-
Mabmud, S. M. (2012).
Cohen’s Kappa.
In N. J. Salkind (Ed.), Encyclopedia of Research Design
(pp. 188–189). Thousand Oaks: SAGE Publications, Inc.
- [Maidment, 2016]
-
Maidment, P. (2016).
7 College Dropouts Who Made Millions.
CNBC.
https://cnb.cx/3nN8h9k.
- [Mauboussin, 2012]
-
Mauboussin, M. J. (2012).
The Success Equation: Untangling Skill and Luck in
Business, Sports, and Investing.
Boston, Mass: Harvard Business Review Press.
- [McKenzie, 2005]
-
McKenzie, C. R. M. (2005).
Judgment and Decision Making.
In K. Lamberts & R. L. Goldstone (Eds.), Handbook of
Cognition (pp. 321–338). London: SAGE Publications Ltd.
- [NavarroPerfors, 2011]
-
Navarro, D. J. & Perfors, A. F. (2011).
Hypothesis Generation, Sparse Categories, and the Positive Test
Strategy.
Psychological Review, 118(1), 120–134,
https://doi.org/10.1037/a0021110.
- [NisbettRoss, 1980]
-
Nisbett, R. & Ross, L. (1980).
Human Inference: Strategies and Shortcomings of
Social Judgment.
New Jersey: Prentice-Hall.
- [OaksfordChater, 1994]
-
Oaksford, M. & Chater, N. (1994).
A Rational Analysis of the Selection Task as Optimal Data
Selection.
Psychological Review, 101(4), 608–631,
https://doi.org/10.1037//0033-295X.101.4.608.
- [PennycookRand, 2019]
-
Pennycook, G. & Rand, D. G. (2019).
Lazy, Not Biased: Susceptibility to Partisan Fake News Is Better
Explained by Lack of Reasoning than by Motivated Reasoning.
Cognition, 188, 39–50,
https://doi.org/10.1016/j.cognition.2018.06.011.
- [PetersWaterman, 2006]
-
Peters, T. J. & Waterman, R. H. (2006).
In Search of Excellence: Lessons from America’s
Best-Run Companies.
New York: Harper Business, reprint edition.
- [Raynor, 2007]
-
Raynor, M. E. (2007).
The Strategy Paradox: Why Committing to Success
Leads to Failure.
New York: Crown Business.
- [Raynor et al., 2009]
-
Raynor, M. E., Ahmed, M., & Henderson, A. D. (2009).
Are “Great” Companies Just Lucky?
Harvard Business Review.
- [Rosenzweig, 2007]
-
Rosenzweig, P. (2007).
The Halo Effect ... and the Eight Other Business Delusions
That Deceive Managers.
Riverside: Free Press.
- [Sawilowsky, 2009]
-
Sawilowsky, S. (2009).
New Effect Size Rules of Thumb.
Journal of Modern Applied Statistical Methods, 8(2),
https://doi.org/10.22237/jmasm/1257035100.
- [Smedslund, 1963]
-
Smedslund, J. (1963).
The Concept of Correlation in Adults.
Scandinavian Journal of Psychology, 4(1), 165–173,
https://doi.org/10.1111/j.1467-9450.1963.tb01324.x.
- [Spall, 2018]
-
Spall, B. (2018).
I’ve Interviewed 300 High Achievers About Their Morning
Routines. Here’s What I’ve Learned.
The New York Times.
https://nyti.ms/2MX31mQ.
- [StrangMacy, 2001]
-
Strang, D. & Macy, M. W. (2001).
In Search of Excellence: Fads, Success Stories, and
Adaptive Emulation.
American Journal of Sociology, 107(1), 147–182,
https://doi.org/10.1086/323039.
- [Taleb, 2005]
-
Taleb, N. N. (2005).
Fooled by Randomness: The Hidden Role of Chance in
Life and in the Markets.
New York: Random House, 2nd edition.
- [Tong et al., 2018]
-
Tong, J., Feiler, D., & Larrick, R. (2018).
A Behavioral Remedy for the Censorship Bias.
Production and Operations Management, 27(4), 624–643,
https://doi.org/10.1111/poms.12823.
- [Van Bavel et al., 2020]
-
Van Bavel, J. J., et al. (2020).
Using Social and Behavioural Science to Support COVID-19 Pandemic
Response.
Nature Human Behaviour, 4(5), 460–471,
https://doi.org/10.1038/s41562-020-0884-z.
- [Wadhwa et al., 2010]
-
Wadhwa, V., Freeman, R., & Rissing, B. (2010).
Education and Tech Entrepreneurship.
Innovations: Technology, Governance, Globalization, 5(2),
141–153, https://doi.org/10.1162/inov_a_00018.
- [WaiRindermann, 2017]
-
Wai, J. & Rindermann, H. (2017).
What Goes into High Educational and Occupational Achievement?
Education, Brains, Hard Work, Networks, and Other Factors.
High Ability Studies, 28(1), 127–145,
https://doi.org/10.1080/13598139.2017.1302874.
- [Wason, 1960]
-
Wason, P. C. (1960).
On the Failure to Eliminate Hypotheses in a Conceptual Task.
Quarterly Journal of Experimental Psychology, 12(3),
129–140, https://doi.org/10.1080/17470216008416717.
- [Zimmer, 2013]
-
Zimmer, R. J. (2013).
The Myth of the Successful College Dropout: Why It Could
Make Millions of Young Americans Poorer.
The Atlantic.
https://bit.ly/31oaKyU.
Appendix
Statistical analysis
For all comparisons of proportions, we use Cohen’s h effect size index for the difference between two proportions p1 and p2, defined by (Cohen, 1988) as
For discussing effect sizes, we pre-registered the use of the benchmarks defined by (Cohen, 1988), with an h of 0.2, 0.5, and 0.8 being indicative of small, medium, and large effects, respectively.
It is worth noting that our main effect (with a Cohen’s h = 1.19) substantially exceeded the upper benchmark of h=0.8 defined by Cohen. We can convert this into Cohen’s d by assuming that betting on the graduate is our event of interest and betting on the dropout is a “non-event”, while being assigned to see examples of graduates is the treatment condition and seeing dropouts the control (Borenstein et al., 2009). This exercise estimates our main effect as Cohen’s d=1.45, which is considered “very large” (Sawilowsky, 2009).
Our comparison of participants’ indicated confidence values (see the Confidence subsection of Results) employs a t-test, for which we measure the effect size using Cohen’s d (Cohen, 1988). For the independent samples of scaled confidence responses in the graduate data condition Xa and the dropout data condition Xb, we first compute the pooled standard deviation
| s = | | |
|
| | ∑(Xa − X_a)2 + ∑(Xb − X_b)2 |
|
| na + nb − 2 |
|
|
|
then compute Cohen’s d = (X_a − X_b) / s.
For all comparisons of proportions, we employ the Pearson chi-squared test for equality of proportions and apply Yates’ continuity correction (Fleiss et al., 2003), which yields more conservative P values.
All Pearson chi-squared tests reported in this paper are not sensitive to the Yates’ correction at the α = 0.05 level except for one: the proportion of participants who provided explanations in favor of the graduate founder between the the dropout data condition and the no data condition (see Justifications section) is considered to be significantly different without Yates’ correction.
Free-text justification and coding procedure
After making their bet, participants in the experiment were allowed to provide a free-text justification for their decision.
To analyze these responses, we constructed a codebook from responses received in pilot experiment data and pre-registered it before running the experiment4.
Our codebook categorizes these justifications as falling into one of three broad categories.
The first, which we call “explanations”, can be considered a response that provides a causal explanation for why the founder they based their decision on had a chance of succeeding.
For example, one participant wrote “If the college graduate has a business degree they would have more insight to starting and running a business”, while another wrote “I believe that the dropout could be a visionary, who doesn’t fit the confines of typical education, but thrives in terms of creativity and managing his business.”
The second category which we call “associations”, suggested there is a disproportionate likelihood of one group succeeding over the other, but did not provide a specific reason why. For instance, “I was torn between the two but I think there is a slightly better chance for the college graduate” or “Statistically, the evidence points to college dropouts having more success in regards to becoming unicorns.” The codebook included more granular codes which fell under the umbrella of associations, but as indicated in our pre-registration, we only intended to consider these responses under the single category of “associations”.
We consider both the “explanations” and “associations” categories to be “informative”, while the final category which we deem “uninformative” is reserved for responses which are either guesses, unclear, or “demand effects”. A response coded as a demand effect indicates that the participant simply answered in one way or another because they believed that they were being led by the experiment, or that they would be rewarded for a decision which was favorable to the experimenters. An example of a guess is “Since I had absolutely no other information it was really just a random choice”, and an example of a “demand effect” is “The questions in the survey led me to believe that was the correct answer.”
Almost all (99%) of the participants included in our analysis provided free-text justifications for their decision bet, even though they were able to proceed to the final stage without doing so.
Three independent coders classified each of these 1,299 justifications following the codebook described above. Coders were blind to both the experimental conditions assigned to each participant and the bet each participant made.
The pairwise Cohen’s Kappa (κ) agreement between coders ranged from 0.77 to 0.79, considered a “good” level of agreement (Mabmud, 2012) (see Supplementary Material Figure S11, and Supplementary Material Figure S12 for κ over the ungrouped set of codes).
For each response we used the majority vote code as determined from our coders (excluding any responses for which there was no majority agreement), leaving us with 1,261 coded justifications in total.
Explanations were specifically coded with whether they are in favor or against graduates or dropouts (a small number of responses were coded as an “unclear” explanation if the participant provided an explanation but it is ambiguous whether the explanation refers to graduates or dropouts, since coders were blind to participants’ bets and experiment conditions: in total, these accounted for 3% of responses coded as explanations).
Normative response
Suppose participants in our experiment follow an idealized decision making process. How should we expect them to bet, and how should the examples they were shown enter into their decision?
To answer the first question, people should simply bet on the dropout founder if they believe that the probability of success among dropout founders is greater than the probability of success among graduate founders (i.e., Eq. 1). In principle this is straightforward, but in practice this requires knowledge about two conditional probabilities that are potentially difficult for people to estimate or reason about.
Using Bayes’ rule, however, we can convert this decision rule into an equivalent but potentially more useful form:
p(success|dropout)> p(success|graduate) 1
p(success|dropout)> p(success|¬dropout)
p(dr|s) p(s)/p(dr)> p(¬dr|s) p(s)/p(¬dr)
p(¬dr) p(dr|s)> p(dr) p(¬dr|s)
(1-p(dr)) p(dr|s)> p(dr) (1-p(dr|s))
p(dr|s) - p(dr) p(dr|s)> p(dr) - p(dr) p(dr|s)
p(dropout|success)> p(dropout) 2
Eq. 2 is a simplified decision rule which states that one should bet on the dropout founder if dropouts are more prevalent among successful founders than in the general population of founders. Compared to Eq. 1, this has two advantages: first, it requires knowledge of only founder dropout rates instead of success rates in two different populations (graduate and dropout founders); and second, one can make inferences about the left-hand side when presented with data about only successes. Thus selection on the dependent variable can in fact be informative as long as it is combined with good knowledge of base rates for the feature under consideration: if dropping out is rare for founders in general, but more common among successful founders, it may indeed make sense to bet on the dropout founder.
In order for readers of success narratives, and participants in our experiment, to make sound updates to their prior beliefs using the examples they are shown, the examples clearly need to be a representative sample of successes. This would allow readers to properly make inferences about the left-hand side of Eq. 2. Unfortunately, however, the data presented in success narratives are often not a representative sample of successes, but have instead been selected to match an attribute of interest (in this case, founders dropping out). The small amount of data people are shown in these settings thus differ from an ideal dataset (a representative sample of founders) in three ways: first, they are limited to successes (which we show above can still be informative if combined with accurate base rate statistics); second, they are limited to successes with an attribute of interest (e.g., dropout founders); and third and most importantly, they are small, unrepresentative samples with arbitrary biases. Furthermore, in our experiment — unlike most success narratives in the media — we even explicitly informed participants that the data they were presented was biased, and had them confirm their understanding of this fact. In short, the data our participants are shown comes from a completely different data-generating process than the one they are trying to make inferences about. As a result, there is no useful, valid inference that can be made about the dropout rate among successful founders (the left-hand side of Eq. 2) from the data participants are shown, other than the fact that it is non-zero.
In addition to the difficulty in making inferences about the left hand side of Eq. 2, it may also be difficult for people to have reasonable estimates of the overall founder dropout rate (the right-hand side of Eq. 2). Even determining the relevant sample space is often unclear (EinhornHogarth, 1981,McKenzie, 2005). As “unicorn-club” author Lee acknowledges, “Figuring out the denominator to unicorn probability is hard” (Lee, 2013), in regards to estimating the prevalence of billion-dollar companies within the space of all startups.
Suppose an individual attempts to estimate p(dropout) with a quick online search, and upon finding the first article with concrete figures5, sees that it suggests 57% of students do not finish college after six years, but only 33% drop out entirely.
Either definition is arguably valid for defining what constitutes dropping out, but choosing one over the other yields substantially different estimates for p(dropout).
To determine the rate of dropping out among startup founders, one also has to define what constitutes a student, which is essential since the education of all startup founders could systematically differ from the broader population, creating an additional problem when deciding which sample space to use. The same article describes how dropout rates differ dramatically between community college (43% dropped out) and an Ivy league school (like Harvard, where only 2% dropped out).
Based on the model presented above, the normative response would be for participants in our experiment to ignore the examples they are shown when deciding on which founder to bet on in the decision task.
A potential objection to this conclusion is that when people are exposed to success narratives there is something like a Gricean norm at play that could lead them to think that the examples they are shown are representative of an underlying relationship in the world or are sufficient in quality, quantity, and relevance for drawing sound conclusions (Grice, 1989).
However, in our experiment we took steps to prevent such inferences from being made: we explicitly informed participants that there is no consensus about graduates and dropouts and that counter-examples to the narrative they were shown exist. Participants actively answered multiple choice questions to acknowledge these disclaimers.
Thus, while people may make inferences based on Gricean norms when reading success narratives in the popular press, in this experiment, participants actively acknowledged that they do not apply.
This document was translated from LATEX by
HEVEA.