| Figure 1: Proportion of responses falling into each category for all 10 topics in Study 1. Higher category numbers indicate stronger agreement with the statement |
Judgment and Decision Making, Vol. 16, No. 3, May 2021, pp. 638-686
More is easier? Testing the role of fluency in the more-credible effectWilliam J. Skylark* |
Abstract:People are more likely to endorse statements of the form "A is more than B" than those of the form "B is less than A", even though the ordinal relationship being described is identical in both cases -– a result I dub the "more-credible" effect. This paper reports 9 experiments (total N = 5643) that probe the generality and basis for this effect. Studies 1–4 replicate the effect for comparative statements relating to environmental change and sustainable behaviours, finding that it is robust to changes in participant population, experimental design, response formats and data analysis strategy. However, it does not generalize to all stimulus sets. Studies 5–9 test the proposition that the effect is based on the greater ease of processing "more than" statements. I find no meaningful effect of warning people not to base their judgments on the fluency of the sentences (Studies 5 and 6), but do find associations between comparative language, credibility, and processing time: when the more-credible effect manifests, the more-than statements are read more quickly than the less-than statements, and this difference partly mediates the effect of comparative on agreement with the statements; in contrast, for a set of comparisons for which changes in the more/less framing did not affect truth judgments, there was no meaningful difference in the time taken to read the more- and less-than versions of the statements. Taken together, these results highlight the importance of comparative language in shaping the credibility of important socio-political messages, and provide some limited support for the idea that the effect of language choice is partly due to differences in how easily the statements can be processed -– although other mechanisms are also likely to be at work.
Keywords: comparisons; language; credibility; fluency
Comparing magnitudes is a fundamental cognitive and social operation (Gerber et al., 2018; Laming, 1997; Matthews & Stewart, 2009); correspondingly, describing the ordinal relations between pairs of items is an important component of communication. In many languages, speakers can describe the same ordinal relationship in two ways: with a "larger" comparative (e.g., bigger, taller, higher, more), or with a "smaller" comparative (e.g., smaller, shorter, lower, less). For many dimensions, the "smaller" comparatives are described as marked, meaning that they are less common and that they denote a comparison between items that are at the low end of the magnitude scale (e.g., "one person is shorter than the other" implies that both are relatively short, whereas "one person is taller than the other" is presumed to carry no implication of their absolute size; e.g., Clark, 1969). In language production tasks, people indeed seem to favour "larger" comparatives (Hoorens & Bruckmüller, 2015; see also Halberg & Teigen, 2009) -– a so-called higher use of larger comparatives (HULC) effect (Matthews & Dylman, 2014). However, the choice is not arbitrary: whether people use the "smaller" or "larger" comparative to describe a given pair of items depends, inter alia, on the spatial and temporal layout of the objects and on their absolute magnitudes (Matthews & Dylman, 2014; Skylark, 2018); there is also indication that people who are older and those who are more agreeable, conscientious, and emotionally stable are more likely to use "larger" comparatives, although these effects are small (Skylark et al., 2018).
These linguistic choices also shape the inferences that people make about the described objects. For example, Choplin (2010) reports that target individuals were judged heavier if they were compared to other people using the word "fatter" (e.g., A is fatter than B) than if the same comparison was made using the word "thinner" (e.g., B is thinner than A) (see also Choplin & Hummel, 2002). Likewise, Skylark (2018) found that the choice of comparative shapes English-speakers’ inferences about the spatial layout of the compared items (for example, sentences of the form "A is taller than Person B" typically lead to the inference that A was on the left from the viewer’s perspective; "B is shorter than A" leads to the inference that A was on the right). Thus, the speaker’s choice of comparative is shaped by a range of factors, and in turn shapes the message-receiver’s inferences about the compared items, in a manner that can be both efficient (e.g., the comparative signals true information about the spatial layout) and potentially biasing (e.g., the spatial layout shapes the choice of comparative which in turn leads to unjustified inferences about the absolute magnitudes of the items). (For related work on the selection and interpretation of comparative language in the context of statements that compare a target item to a numeric value – such as “The shoes cost less than £100” – see e.g., Halberg & Teigen, 2009; Halberg et al., 2009; Teigen et al., 2007a, 2007b, Teigen, 2008; Zhang & Schwarz, 2020.)
The present paper examines one particularly striking but somewhat overlooked consequence of the choice of comparative, reported by Hoorens and Bruckmüller (2015). These authors focused on one particular pair of comparatives: "more" and "less", both of which can be used to describe the same ordinal relation in quantity or extent. In a comprehensive series of experiments, Hoorens and Bruckmüller found that statements phrased as "A is more than B" were preferred, more likely to elicit agreement, and more likely to be judged factually correct true than statements in which the same ordinal relations were described with the word "less". For example, in their Study 5 participants read 20 statements that compared men and women; for one group of participants the statements were framed as "more than", for another group they were framed as "less than". Participants rated their agreement with each statement on a 7-point scale (strongly disagree to strongly agree). The "more than" group reported higher mean agreement than the less than group (M = 4.08 vs M = 3.56, Cohen’s d ≈ 0.5 based on pooling the reported SDs), and this effect was not meaningfully moderated by whether the statements fit with gender stereotypes or by the desirability of the attribute on which males and females were being compared. In a subsequent experiment, Hoorens and Bruckmüller (2015, Study 6) had people judge the truth of 12 statements comparing men and women and again manipulated the comparative (e.g., men are more likely to own a pet fish than women vs. women are less likely to own a pet fish than men); the more-than framing elicited a higher proportion of "true" responses (42%) than did the less-than statements (30%, effect size for the difference reported as d=0.43). More recently, Bruckmüller et al. (2017) have replicated the effect of more/less framing on agreement with statements about the legitimacy of inequality, although in this case the effect was moderated by the size of the gap between rich and poor (e.g., when temporary workers received only slightly less than permanent workers, it made little difference whether temporary workers were described as receiving less than permanent workers, or permanent workers as receiving more than temporary ones).
It is convenient to label these results a more-credible effect: people are typically more likely to agree with, or judge true, comparisons of the form "A is more than B" than those of the form "B is less than A", even though the ordinal relation is identical in each case. Hoorens and Bruckmüller (2015) suggested that the more-credible effect is a fluency effect. That is, they proposed that it arises because "more than" statements are easier to process than "less than" statements, and that this metacognitive experience of ease forms the basis for judgments of quality, agreement, and truth (e.g., Alter & Oppenheimer, 2009; Hasher et al., 1977; Reber, 2016; Silva et al., 2017; Whittlesea, 1993).
Indirect support for this proposition comes from the fact that "more" is used more frequently than "less" (e.g., Matthews & Dylman, 2014), and word frequency is one basis for fluency (Brysbaert et al., 2018). Hoorens and Bruckmüller (2015) also sought empirical evidence that fluency underlies the more-credible effect, basing their approach on previous work indicating that judgments are less affected by ease of processing when fluency can be discounted as a source of information – for example, because people have been warned that it may be a source of bias (e.g., Greifeneder et al., 2010; Lev-Ari & Keysar, 2010; McGlone & Tofighbakhsh, 2000). To this end, Hoorens and Bruckmüller’s final experiment had participants rate agreement with gender comparison statements in three conditions: one group read "more than" sentences; one read "less than" sentences describing the same ordinal relations; and a critical third group also read "less than" sentences but with a warning in the instructions that "some statements might be worded a bit strangely or might seem hard to evaluate and encouraging participants to try to give their view nonetheless" (p. 763). Replicating the more-credible effect, the standard more-than statements produced higher mean agreement than the standard less-than statements; the less-than statements preceded by a warning were intermediate between these two conditions, eliciting higher average agreement than the standard less-than comparisons. This provides initial support for the idea that fluency underlies the more-credible effect, although it is not definitive: the sample size was relatively small (c. 40 per group), the p-value only just below the threshold for "significance" (p = .037), and the experimental design only included a warning for the "less than" condition rather than rather than a factorial 2 (comparative) x 2 (warning condition) structure. More importantly, an effect of warning is indirect support for a fluency explanation: more direct evidence would require finding that "more than" statements are easier to process than "less than" statements – as indexed by some objective measure such as reading time (e.g., Whittlesea, 1993) –- and, ideally, that this difference in ease of processing mediates the effect of comparative on people’s agreement with the statement.
In short, previous work suggests that (1) a speaker’s decision to frame the same comparison as "less" or "more" exerts a pronounced effect on the message receiver’s acceptance of that statement as a plausible description of the world, (2) there is some indication that this effect is lessened when people are warned to ignore the ease with which the statements can be read, and (3) this in turn may indicate that fluency underlies the effect of comparative on the acceptance of the claim. Given the practical implications of these findings – for example, in crafting public communications about political issues –- and the relatively nascent evidence regarding the processes at work, the present studies sought to test the generality and robustness of the foregoing results, and to probe their basis in more detail.
The present studies therefore had three aims. First, I seek to replicate and generalize the more-credible effect. To this end, I examine how the choice of comparative affects agreement and truth judgments for statements concerning environmental impacts and priorities; I apply novel analytic strategies to ensure that the results are not a consequence of the particular approach taken in previous work (e.g., Mixed vs Fixed effects analyses, Frequentist vs Bayesian estimation, Ordinal vs Metric models) and to gain deeper insight into the effects that the choice of comparative has on people’s decision processes. The second aim is to provide a more substantial test of the effect of warnings on the more-credible effect. As noted, if warnings diminish the effect, it can be taken as (indirect) support for a fluency-based mechanism; it would also have practical significance in providing a straightforward way to overcome the biasing effect of comparative adjectives. The third aim is to provide a more direct assessment of the fluency hypothesis by examining whether "more than" comparisons are, indeed, easier to process than "less than" statements, and whether any such difference mediates the effect of comparative on judgements of agreement and truth.
Studies 1 and 2 examined the effects of more/less framing on people’s agreement with comparative statements relating to environmental issues. Study 1 manipulated the comparative (less vs more) between subjects; Study 2 manipulated the comparative within subjects and also examined whether the effect of comparative was modulated by a simple procedural change to the response format. Because the studies are similar, their Methods and Results are reported together. None of the studies here were pre-registered, and all can be viewed as somewhat exploratory.
All studies were conducted on-line using participants whose first language was English, recruited from Prolific (www.prolific.co). Sample sizes were determined by financial considerations and a desire to have a final samples size of 100-200 participants per cell of the design. I requested 10% more participants than the desired final sample size, to protect against attrition from participant exclusions (and the recruitment platform sometimes provided 1 or 2 people above the number requested). For example, for Study 1 I requested 440 people in the hope of obtaining at least 200 people in each condition. Power analyses are not straightforward for the multilevel analyses conducted here, and would depend on largely arbitrary assumptions about the error structure. I therefore focus on parameter estimates and confidence intervals (assessed with a range of techniques) and acknowledge when there is a lot of uncertainty about the probable value of a given parameter. In all studies apart from Study 2, the platform was asked to provide participants resident in the UK; for Study 2, participants were requested to be from the USA. Further details of the inclusion/exclusion criteria and sampling plan are provided in the Appendix.
The participant samples for all studies are described in Table 1. For Study 1, the final sample comprised 433 participants, 216 in the Less condition and 217 in the More condition. For Study 2, the final sample comprised 434 participants, 219 in the Standard mapping condition and 215 in the Reversed condition.
Table 1: Participant Demographics. Note. Ncompleted indicates the number of people who finished the task and were remunerated; Nfinal indicates the size of the analysed sample, after excluding potential duplicate respondents (and, in Study 7, one participant who skipped questions). The demographic information was obtained from the recruitment platform and refer to the final, analysed samples. "Other" indicates people for whom gender status was not available.
Study Ncompleted Nfinal Male Female Other Age Range Mage SDage 1 441 433 139 291 3 18–76 34.74 12.68 2 442 434 217 207 10 18–73 32.59 11.65 3 440 432 184 246 2 18–75 35.78 13.75 4 441 431 166 260 5 18–80 36.65 14.62 5 552 538 181 356 1 18–69 34.30 12.87 6 550 511 220 291 0 18–76 35.74 13.06 7 552 537 172 363 2 18–80 35.12 12.82 8 1101 1059 461 593 5 18–79 36.76 13.91 9 1321 1268 533 724 1 18–85 36.02 13.78
Initial instructions told participants that "On the following pages you will be asked to rate your agreement or disagreement with various statements. There are no right or wrong answers – we are just interested in your opinions." There followed 10 comparative statements relating to environmental change and sustainability. In the More condition, the statement made a comparison using "more than"; in the Less condition, the same ordinal comparison was expressed using the words "less than". The statements are listed in Table 2. The ordinal relation between the pair of items within each comparison (i.e., which item of the pair was more important, impactful, damaging etc) was determined randomly when preparing the stimulus materials and then kept the same for all participants. Participants were randomly assigned to the Less or More condition (here and throughout, the software was set to randomly assign participants with each condition used equally often).
Table 2: Study 1 Stimuli
Less Condition More Condition Europe has been less successful than China in moving towards a sustainable economy. China has been more successful than Europe in moving towards a sustainable economy. Businesses have less influence over CO2 emissions than individual citizens do. Individual citizens have more influence over CO2 emissions than businesses do. Plastic waste is a less serious problem than deforestation Deforestation is a more serious problem than plastic waste In the next general election, health policies will receive less attention than environmental policies. In the next general election, environmental policies will receive more attention than health policies. Manufacturing causes less environmental damage than farming does. Farming causes more environmental damage than manufacturing does. To understand environmental issues, studying history is less useful than studying geography. To understand environmental issues, studying geography is more useful than studying history. For most old houses, installing double glazing is less beneficial than installing roof insulation. For most old houses, installing roof insulation is more beneficial than installing double glazing. Recycling glass has less impact than recycling paper. Recycling paper has more impact than recycling glass. As the UK moves away from fossil fuels, nuclear power will be less important than solar power. As the UK moves away from fossil fuels, solar power will be more important than nuclear power. Air pollution is less harmful than water pollution. Water pollution is more harmful than air pollution.
Each statement was on a separate page, with order randomized for each participant; each statement was preceded by the words "Please indicate the extent to which you agree or disagree with the following statement". Participants responded on 7-point scale: 1. Strongly Disagree; 2. Disagree; 3. Somewhat Disagree; 4. Neither Agree Nor Disagree; 5. Somewhat Agree; 6. Agree; 7. Strongly Agree. All questions were mandatory (participants could not progress until a response had been made).
After completing the questions, participants were thanked and debriefed; demographic information (age and gender) were extracted from the export file provided by the recruitment platform.
Study 2 built on Study 1 by using a different set of comparisons and using a US-based rather than UK-based sample to check that the results generalize to another English-speaking country/culture, and to a different set of comparisons. The new stimuli are shown in Table 3. The procedure was very similar to Study 1, except that for each of the 10 topics the participant was randomly assigned to read the Less or More version; the switch to a within-subject manipulation of comparative helps ensure generality/robustness (e.g., because repeating the same comparative 10 times in a row might be rather artificial). The study also introduced a between-subject factor of response mapping: the Standard mapping used the same response scale as Study 1, with response options labelled from "1. Strongly Disagree" to "7. Strongly Agree", arranged from left to right (or top to bottom if the participant’s browser window was very narrow). Conceivably, the association of "more" with larger numbers (or particular spatial locations) could influence willingness to use certain response categories; the Reversed mapping condition therefore labelled the response options from "1. Strongly Agree" (on the left/at the top) to "7. Strongly Disagree" (at the right/bottom); participants were randomly assigned to mapping condition.
Table 3: Study 2 Stimuli
Less Condition More Condition Preventing soil pollution should receive less priority than improving air quality. Improving air quality should receive more priority than preventing soil pollution. In 2030, conventional cars will be less common than electric cars. In 2030, electric cars will be more common than conventional cars. When it comes to ensuring a sustainable future, the actions of the government are less important than the behaviors of private citizens. When it comes to ensuring a sustainable future, the behaviors of private citizens are more important than the actions of the government. In the coming decade, military threats are going to be less of an issue than climate change will be. In the coming decade, climate change is going to be more of an issue than military threats will be. Overall, China causes less environmental damage than Europe does. Overall, Europe causes more environmental damage than China does. Conventional investment funds generate less income than "sustainable" investment funds. Sustainable investment funds generate more income than conventional investment funds. Fossil fuel use is less of a problem than plastic waste. Plastic waste is more of a problem than fossil fuel use. Good recycling services are less important than good public transport. Good public transport is more important than good recycling services. Wasting water causes less harm than wasting energy does. Wasting energy causes more harm than wasting water does. Solar power is less useful than wind power in helping to reduce C02 emissions. Wind power is more useful than solar power in helping to reduce C02 emissions.
For all studies, the data were analysed in several ways – not in order to "fish" for a particular result but rather to reduce the risk of conclusions being influenced by one or more arbitrary analysis decisions (e.g., Matthews, 2011; Skylark et al., 2020, 2021).
Hoorens and Bruckmüller (2015) treated agreement ratings as metric (interval scale) data. They averaged the responses for each participant and then submitted these to standard frequentist tests such as t-tests and ANOVA. For the sake of comparison with their work, I apply a similar approach.
I also use multilevel modelling, which allows variation across people and topics (depending on the experimental design) in both the overall tendency to agree with a statement and in the effect of comparative language on that tendency. (In the frequentist tradition, such effects are usually called "random effects"; in the Bayesian approach, they are often called "group level effects"). I fit "maximal" models (Barr et al., 2013) – that is, I allowed by-participant and by-topic intercepts and slopes for all relevant predictors1, along with correlated group-level effects. On some occasions when using frequentist estimation, the fitted model was flagged as singular by the software (roughly, this means that one of the random effects is estimated as being zero or the random effects are perfectly correlated), or inspection indicated a singularity issue. This is not necessarily a problem, but it is helpful to see whether simplifying the model to avoid the issue leads to different inferences. In such cases I therefore successively simplified the model until the issue was resolved, and report both the full (maximal) and reduced frequentist model fits.
I conducted a range of analyses that differed in whether they treated the data as metric or ordinal (cumulative Probit); the former treat agreement ratings as interval-scale data and predict the mean response for a given condition; the latter treat the responses as if they result from a latent, normally-distributed "agreement" variable with thresholds dividing the continuum into discrete response categories (e.g., Bürkner & Vuorre, 2019; Liddell & Kruschke, 2018). For both types of model, I used both Frequentist and Bayesian parameter estimation; for ordinal models, the frequentist (likelihood-based) approach allowed flexible thresholds (i.e., with 7 response categories, 6 intercepts are estimated as free parameters) and both population-level and group-level effects on the location of the latent agreement dimension, but fixed the standard deviation (or, equivalently, discrimination, which is the inverse of standard deviation) to be constant (specifically, 1.0); the software used for the Bayesian ordinal analyses is more flexible in that it allows variability in the standard deviation of the latent variable as well as location shifts. Thus, for each study I fit the same "fixed standard deviation" model as the frequentist analysis, and a "variable SD" model which included the population- and group-level predictors for discriminability, too. Further details of the statistical analyses are provided in Appendix 1.
In all regression analyses, comparison condition was effect coded as Less = -0.5, More = +0.5, so the coefficient indicates the difference between the conditions; for Study 2, response mapping was coded Reversed = -0.5, Standard = +0.5.
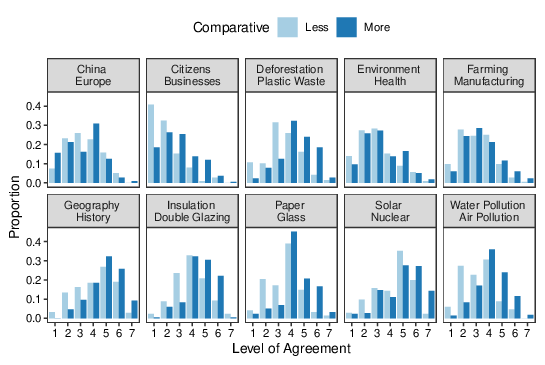
Figure 1 shows the proportion of responses falling into each of the 7 agreement categories for each topic in Study 1, plotted separately for the More and Less conditions. For all 10 topics, phrasing the comparison as "A is more than B" produces stronger agreement than phrasing the same comparison as "B is less than A".
Figure 1: Proportion of responses falling into each category for all 10 topics in Study 1. Higher category numbers indicate stronger agreement with the statement
For the Study 2 data, responses from participants in the Reversed mapping condition were reverse-coded so that, for all participants, larger values indicated stronger agreement. The top panels of Figure 2 show the response proportions, collapsed over the response mapping condition. Like for Study 1, the plot indicates more use of the "agree" categories when the comparisons are framed as "more" than when they are framed as "less"; the bottom panels of Figure 2 plot the response proportions separately for the Standard and Reverse mapping conditions, collapsed over topic; the results look very similar for both mappings.
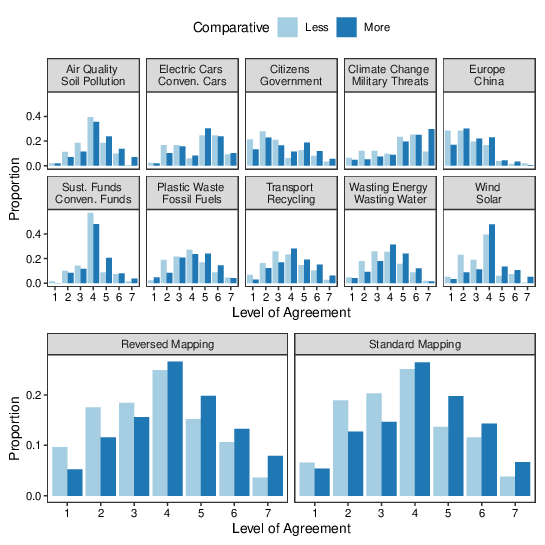
Figure 2: Proportion of responses falling into each category in Study 2. Higher category numbers indicate stronger agreement with the statement. The top panels show the results for each topic, collapsed over response mapping; the bottom panels show the results for each mapping, collapsed over topic.
The inferential analyses support these impressions. For Study 1, computing the mean agreement rating for each participant, the More condition engendered stronger agreement (M = 4.00, SD = 0.53) than the Less condition (M = 3.42, SD = 0.52), t(431) = 11.42, p <.001, d = 1.10, 95% CI = [0.89, 1.30]. Likewise, for Study 2, ANOVA indicated higher mean agreement for the More condition than the Less condition, with very little effect of response mapping and no interaction (Table 4).
Table 4: ANOVA results for Studies 2, 3, and 4 Comp = Comparative; Resp = Response Mapping. Here and throughout I follow convention and report 90% CIs for partial η2.
Study Term F (df) p ηp2 90% CI 2 Comp 72.26 (1, 431) <.001 .144 [.096, .194] 2 Resp 0.01 (1, 431) .931 .000 [.000, .001] 2 Comp x Resp 0.84 (1, 431) .359 .002 [.000, .015] 3 Comp 0.10 (1, 430) .757 .000 [.000, .007] 3 Truth 50.24 (1, 430) <.001 .105 [.063, .151] 3 Comp x Truth 0.17 (1, 430) .681 .000 [.000, .151] 4 Comp 88.33 (1, 428) <.001 .171 [.120, .223] 4 Version 8.94 (1, 428) .003 .020 [.004, .048] 4 Comp x Version 0.30 (1, 428) .585 .001 [.000, .011]
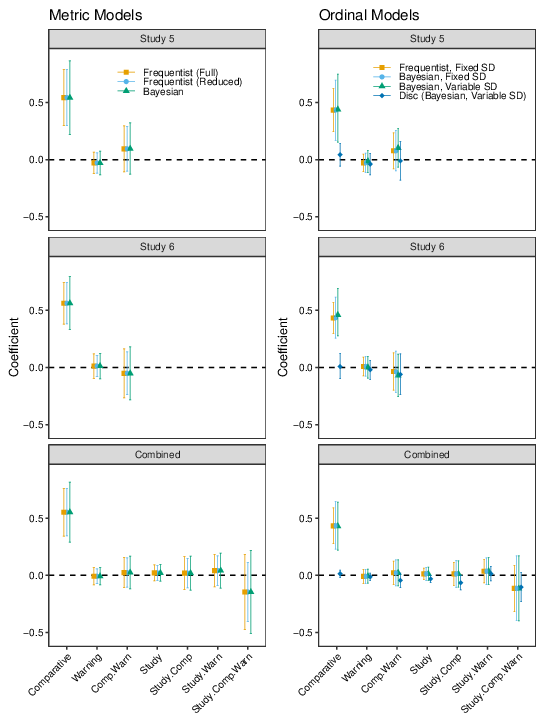
The parameter estimates from the multilevel regression analyses are plotted in Figure 3; the top panel shows the results of fitting the metric model, the bottom panel shows the results of fitting the ordinal models. In this figure and throughout, predictors of the form "X.Y" indicate the interaction between X and Y, the error bars show 95% CIs (Frequentist analyses) or 95% equal-tailed intervals (Bayesian analyses), and for the Bayesian estimation of the ordinal model "Disc" indicates the effect of each predictor on log-Discrimination (where Discrimination is inversely related to the SD of the latent variable; Bürkner & Vuorre, 2019). All versions of the regression analyses indicate a substantial effect of comparative language, with CIs ranging from approximately 0.3 to 0.8 on the agreement scale. The most complex model is the ordinal regression in which both the location and variance of the latent "agreement" dimension have population-level and group-level effects. Notably, for this model the CIs for the effect of comparative language are wide, reflecting uncertainty that results from the complex model structure. As indicated by the discrimination parameter estimate, there is very little indication that the more/less framing has a meaningful effect on the variance of the agreement dimension. It is useful to show the latent variable models graphically. To this end, Figure 4 shows the distribution of the "agreement" latent variable for each condition of Studies 1 and 2, based on the population-level parameter estimates.
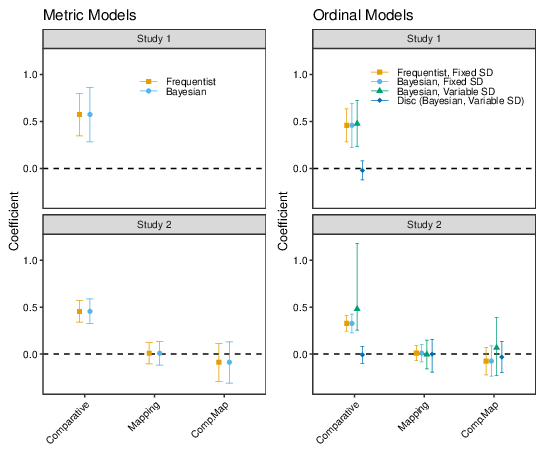
Figure 3: Regression coefficients for each predictor in Studies 1 and 2.
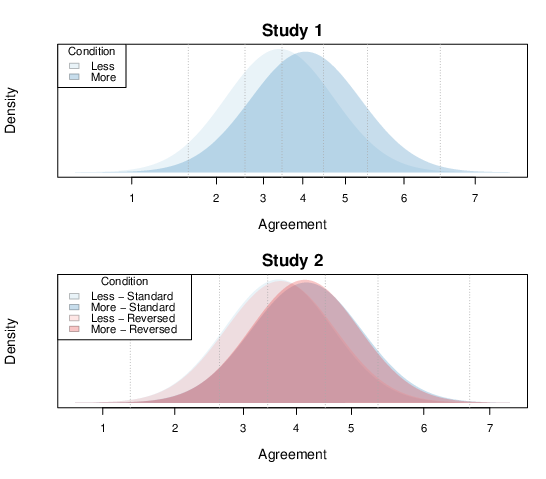
Figure 4: Cumulative Probit models for the rating data from Studies 1 and 2. The plots show the predicted location and variability of the latent "agreement" dimension for each cell of the design, based on the population-level estimates obtained by Bayesian parameter estimation. The dotted lines indicate the population-level estimates of the response category boundaries.
Asking people to answer 10 questions in succession is rather artificial, and the micro-environment created by the set of questions might modify participants’ behaviour. I therefore checked whether the foregoing results held when only the first trial from each participant was analysed. These analyses yielded the same patterns as the main analyses.2
These studies replicate and extend the more-credible effect reported by Hoorens and Bruckmüller (2015): participants indicated greater agreement with comparative statements about the environment when those statements used the word "more" than when the same ordinal relation was described using the word "less". This effect was unaffected by whether "agree" responses were mapped to small numbers and the left/top of the screen or large numbers and the right/bottom. Nor was it a consequence of collapsing over heterogeneous stimuli, or of assuming a metric model: ordinal, multilevel models yielded very similar results to the simpler approach based on participant means. Indeed, there was very little indication that the choice of comparative affected the discriminability (inverse of the standard deviation of the putative latent variable) when this was allowed to vary. The effect of comparative was substantial: looking at the estimate of Cohen’s d from Study 1, more-than phrasing increased mean agreement by approximately 1 standard deviation relative to less-than phrasing; in absolute terms, the shift was approximately half a response category.
Study 3 tested the effect of comparative on judgments of truth or falsity. The relationship between such judgments and agreement ratings of the type used in Studies 1 and 2 is an open question: on the one hand, both types of judgment may be based on the same underlying sense of the plausibility of a statement (e.g., true/false judgments might be equivalent to two-category agreement ratings, and modelled by dichotomization of the same latent, Gaussian agreement dimension); on the other hand, truth and falsity are linguistically distinct from agreement, and it is not clear that declaring a statement to be “true” is psychologically the same as saying “I agree with it”. For example, asking whether a statement is true or false implies that there is an objectively correct response (even if, in practice, all statements involve an element of uncertainty). Correspondingly, the effect of linguistic framing might be distinct. Hoorens and Bruckmüller (2015) examined this issue in one experiment (their Study 6). In that study, participants judged the truth of 12 gender-comparison statements, which had been selected based on previous market research as being domains for which no gender difference actually existed, and which pre-testing had found to be regarded as domains in which there was no reliable gender difference. Six of the statements had a more-than framing and 6 a less-than framing, with allocation of comparisons to frames and direction of comparison (i.e., "A is more than B" or "B is more than A") both counterbalanced. On average participants judged 30% of the less-than comparisons to be true, but 42% of the more-than comparisons to be true, with reported effect size estimates of d = 0.43 and ηp2 = .16.
In the present experiment, participants made true-or-false judgments for 12 statements relating to an environmental issue, namely the land required to produce particular foodstuffs. One feature of Hoorens and Bruckmüller’s (2015) study is that, because all of the statements were objectively false (and expected to be subjectively false, based on the pre-testing), there was no scope for examining a potential interaction between comparative language and truth-status. But this is important practically and theoretically. The present study therefore examined the effect of more/less framing on the perceived truth of comparative statements which were either true or false (as judged by current scientific consensus).
The final sample comprised 432 participants, 217 in the Less condition and 215 in the More condition.
The comparison statements were formed by selecting 24 foodstuffs for which the amount of land required to produce 1 kilogram (or 1 litre) of the item was reported by Poore and Nemecek (2018), with minor revisions for a British audience (e.g., "peanuts" in place of "groundnuts"). Items from this list were randomly paired to give the set of 12 pairs shown in Table 5. For each pair, I constructed both true and false comparative statements using both less and more as the comparative adjective; examples are shown at the bottom of Table 5.
Participants were randomly assigned to the Less or More conditions and saw all 12 comparative statements in random order with the truth status of each statement randomly selected on each trial. Participants indicated whether each statement was true or false by selecting a radio button (with True above False) before progressing to the next statement. They were told at the start to answer based on their own knowledge and not to look anything up. In other respects, the procedure was like that for the previous studies.
Table 5: Stimuli for Study 3.
Item requiring more land Item requiring less land Dark chocolate (68.96) Pig meat (17.36) Rapeseed oil (10.63) Bread (3.85) Cheese (87.79) Cane sugar (2.04) Poultry meat (12.22) Rolled oats (7.60) Eggs (6.27) Palm oil (2.42) Peanuts (9.11) Potatoes (0.88) Tofu (3.52) Bananas (1.93) Beer (1.11) Tomatoes (0.80) Sunflower oil (17.66) Citrus fruit (0.86) Milk (8.95) Apples (0.63) Olive oil (26.31) Wine (1.78) Rice (2.80) Soymilk (0.66) Example statements: More, True: Producing a kilo of dark chocolate uses more land than producing a kilo of pig meat More, False: Producing a kilo of pig meat uses more land than producing a kilo of dark chocolate Less, True: Producing a kilo of pig meat uses less land than producing a kilo of dark chocolate Less, False: Producing a kilo of dark chocolate uses less land than producing a kilo of pig meat Note. Values in parentheses are the land use, in m2, per kilo or litre of the product, based on Poore & Nemecek (2018); these values were not shown to participants.
Figure 5 shows the mean proportion of "True" responses for the Less and More versions of each comparison. Following Hoorens and Bruckmüller (2015), I computed, for each participant, the proportion of "true" responses in each condition; the overall means of these proportions are plotted in the top panel of Figure 6. This plot indicates no meaningful effect of comparative condition but, overall, participants were approximately 10% more likely to respond "true" to true statements than to false statements. Submitting the data plotted in Figure 6 to a 2x2 mixed ANOVA indicated very little effect of comparative language, a quite substantial effect of truth-status, and no interaction (Table 4).
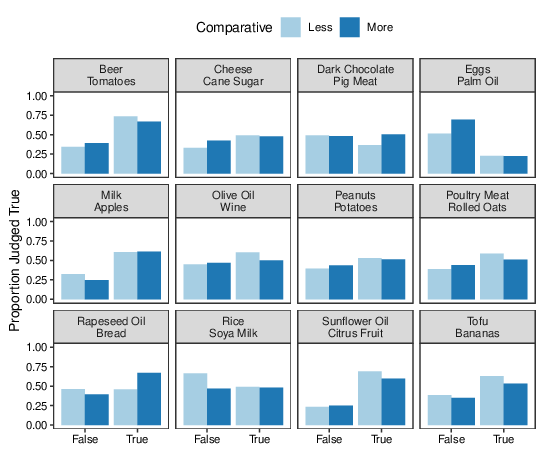
Figure 5: Proportion of statements judged to be true for each pair of compared items in Study 3, grouped by whether the statement was in fact true or false and whether the comparison was phrased as "more than" or "less than".
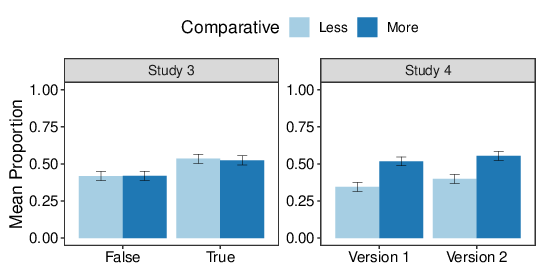
Figure 6: Mean proportion of statements judged true by participants in Studies 3 and 4, organized by the framing of the comparison ("less than" or "more than") and the type of statement (True or False in Study 3; Version 1 or Version 2 in Study 4). Error bars are 95% CIs calculated for a within-subject design (Morey, 2008).
Like for the previous studies, the data were also submitted to multilevel modelling, with Truth Status coded as -0.5 (for false) and +0.5 (for true). The population-level parameter estimates for the effects of Comparative, Truth Status and their interaction are plotted in the top panel of Figure 7 (the Frequentist (Reduced) model dropped the correlation between random effects); by analogy with the use of a cumulative Probit model for the analysis of ordinal data in Studies 1 and 2, the plot shows the results of Probit regression; using logistic regression produced the same pattern.
The parameter estimates for the effect of comparative language are almost exactly zero and tightly bracketed by the CIs. There is also little indication that comparative language moderates the effect of truth, although there is more uncertainty about this conclusion. Interestingly, the CIs for the overall effect of truth status just include zero. This contrasts with the very small p-value and substantial effect-size estimate found in the within-subject ANOVA. The reason for the discrepancy seems to be the heterogeneity in the truth effect across topics, as plotted in Figure 5.3
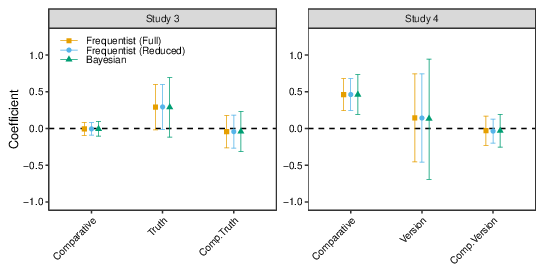
Figure 7: Regression coefficients for Studies 3 and 4. The points labelled Frequentist (Full) and Frequentist (Reduced) show the parameter estimates obtained by maximum likelihood estimation with either a maximal or reduced random effects structure; the points labelled Bayesian show the results when the full model was fit by Bayesian estimation.
Like for Studies 1 and 2, the results were very similar when only the first trial for each participant was analyzed.4 I also wondered whether the difference between the results of Study 3 and those of Studies 1 and 2 might be due to the dichotomous response scale for the judgments of truth in Study 3. To explore this I dichotomized the responses from Studies 1 and 2 and re-analyzed the data; the results mirrored those from the original analyses.5
Unlike Hoorens and Bruckmüller (2015), this study found no meaningful effect of comparative language on judgments of truth. Possible reasons for this are discussed and tested below. For now, an interesting tangential observation is that the results of multilevel modelling were different from those obtained by computing participant means and submitting them to ANOVA. The perils of ignoring stimulus heterogeneity have long been known (Clark, 1973) but contemporary researchers (including myself) have not always adapted their analysis strategies accordingly.
To further clarify whether the difference between the results for the "agreement" studies (Studies 1 and 2) and the "truth judgment" study (Study 3) lies in the response mode, the next experiment modified Study 1 to be more directly analogous to the design of Study 3, differing only in the specific content of the statements presented for judgment. That is, participants were presented with the statements from Study 1 with either a more-than or less-than framing, and judged whether each statement was true or false.
The final sample comprised 431 participants, 216 in the Less condition and 215 in the More condition.
The structure of this study was as far as possible identical to that of Study 3. Participants were presented with the same comparative statements that were used in Study 1, but instead of indicating agreement on a 7-point scale, participants were asked (like in Study 3) to judge whether each statement was True or False. As before, participants were randomly assigned to the Less or More condition. There is no definitive truth for the statements used in Study 1; the truth-status factor of Study 3 was therefore replaced by "Version", where Version 1 consisted of the ordinal relation described in Study 1 (e.g., in the More condition: "Water pollution is more harmful than air pollution") and Version 2 reversed this relation (e.g., "Air pollution is more harmful than water pollution"). Like truth-status in Study 3, Version was randomized on each trial. Given that the ordinal relations described by the statements in Study 1 were determined randomly, I did not expect any particular effect of the Version factor; nonetheless, it was included because (a) it is possible that the effect of comparative language in Study 1 was due to a quirk of the the specific set of (random) ordinal relations described in the comparative statements, and (b) including Version means that the data structure for this study is the same as for Study 3, helping to ensure that any differences between the results are not a consequence of the specific statistical procedures applied to the data.
Apart from the change of stimuli, the study was virtually identical to Study 3. For each comparative statement, participants were asked: "Do you think the following statement is true or false?" and indicated their response via radio buttons.
Figure 8 shows the proportion of "true" responses for each topic, separately for each combination of comparative language (Less vs More) and stimulus set (Version 1 vs Version 2). On average, 54% of statements were judged to be true in the More condition whereas only 38% were judged to be true in the Less condition. As one might expect, the effect of Version is heterogeneous. The right-hand panel of Figure 6 shows the mean proportion of "true" responses from each participant in each condition (one participant did not encounter any Version 2 statements and so was not included in the figure or subsequent ANOVA). The two versions of the comparative statements yielded similar overall responses, with some indication that the Version 2 stimuli were endorsed as true slightly more often than the original statements. There is little indication that Version moderates the effects of comparative.
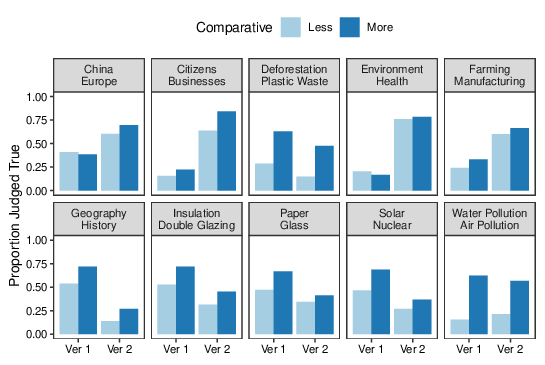
Figure 8: Proportion of statements judged to be true for each topic (pair of compared items) in Study 4, grouped by whether the comparison was phrased as "more than" or "less than". Ver 1 and Ver 2 are the two versions of each comparison, which differ in which of the two items is stated to be larger.
These impressions were supported by the inferential analyses. A 2x2 ANOVA of the mean proportions from each participant indicated that participants in the More condition endorsed more statements than those in the Less condition, with a small effect of Version and very little indication of an interaction (Table 4).
The multilevel Probit regression coefficients (with Version coded -0.5 for Version 1 and +0.5 for Version 2) are plotted in the bottom right panel of Figure 7.6 Logistic regression yielded the same pattern of results as the Probit analysis. Like the ANOVA, the multilevel analyses indicate a substantial effect of comparative. However, the population-level effect of Version is small and has very wide confidence intervals. This echoes the difference between the ANOVA and regression analyses in Study 3; once again, the discrepancy presumably arises because of the heterogeneity in the effect of Version across topics, which is ignored when one computes the mean proportion of "true" responses from each participant.
Study 4 found a substantial effect of comparative whereas Study 3 found very little effect, despite the structural similarity of the experiments. As a simple test of the difference in the results from the two studies, the mean proportion of "true" responses was computed for each participant and submitted to a 2x2 ANOVA with Comparative and Study as the two between-subject factors. (When computing the proportion of "true" responses from each participant, the truth-status and version factors were ignored, because they are not comparable between the two experiments). The results indicated a sizeable overall effect of Comparative, F(1,859) = 54.10, p<.001, ηp2=.059, 90% CI = [.036, .086] and little overall difference between the studies, F(1,859) = 2.97, p=.085, ηp2 = .003, 90% CI = [.000, .013]; however, as expected from the analysis of the individual studies, there was a substantial interaction between Comparative and Study, F(1.859) = 57.68, p<.001, ηp2 = .063, 90% CI = [.039, .091]. More sophisticated multilevel models could be constructed that treat the stimuli in each set as samples from a larger population of stimuli of that type, but they are not considered here; instead, we simply note that the effect of comparative language on judgments of truth differs systematically between the specific sets of stimuli used in Studies 3 and 4.
Study 4 replicated the finding that "more than" comparisons are more likely to be judged true than "less than" comparisons (Hoorens and Bruckmüller, 2015), but Study 3 found no such effect. Given the similarities between the studies, it seems most likely that the difference results from the stimuli selected in each case.7
The possible mechanisms underlying this pattern are discussed in more detail after consideration of the next set of experiments, which probe one putative explanation for the more-credible effect (when it arises), namely the idea that "more" is easier to process than "less", and that this difference in fluency is attributed to a difference in credibility (Hoorens & Bruckmüller, 2015). Hoorens and Bruckmüller provided initial evidence for this proposal by warning some people in the Less condition that the statements might seem rather odd; this reduced the difference in mean agreement ratings between the "more than" and "less than" conditions. As described in the Introduction, the evidence from this study is relatively weak and it is important to check whether it is robust. Studies 5 and 6 therefore examined the effect of warning participants about the potential influence of fluency on their judgments.
For Study 5, the final sample comprised 538 participants (for the No Warning condition: 136 in the Less condition and 135 in the More condition; for the Warning condition: 130 in the Less condition and 137 in the More condition). For Study 6 the final sample comprised 511 participants (for the No Warning condition: 132 in the Less condition and 127 in the More condition; for the Warning condition: 126 in the Less condition and 126 in the More condition).
In Study 5, participants were randomly allocated to a Warning condition or a No Warning condition. For those in the No Warning condition the experiment was identical to Study 1: participants were randomly allocated to the More or Less condition and rated their agreement with the 10 comparative statements. For those in the Warning condition the procedure was the same except that immediately prior to the first stimulus participants were shown, in large font, a warning similar to that presented by Hoorens and Bruckmüller (2015): "Important: You might find some of the statements to be worded rather strangely. Please try to ignore this – focus on the meaning of the statements rather than on how easy or hard they are to read". At the end of the task all participants were given a memory-check question: "At the start of the survey, did you see an instruction asking you to focus on the meaning of the statements rather than on how easy or hard they are to read?" with response options "Yes", "No", and "I don’t remember" (in randomized top-to-bottom order).
Study 6 was the same as Study 5 except that the wording of the warning was changed and based on that used by Greifeneder et al.’s (2010) study of fluency effects on judgments of essay quality, as follows: "Important: Prior research suggests that the ease or difficulty with which sentences can be read influences their evaluation. Please try not to be influenced by how hard or difficult it is to read the statements that you are asked about". In addition, for participants in the Warning condition this exhortation was repeated in the instructions presented above every to-be-judged comparison sentence, as follows: "Please indicate the extent to which you agree or disagree with the following statement. Please try not to be influenced by how easy or difficult it is to read the sentence", with the second sentence being underlined. The memory-check question was also modified: "In this study, did you see instructions asking you not to be influenced by how easy or hard the statements were to read?" with the same response options as before.
Figure 9 shows the mean agreement ratings for each condition in each study and when the data from the two studies are pooled. The results from the two experiments are similar: like Studies 1 and 2, there is a marked more-credible effect, but there is little indication that warning participants not to base their responses on fluency had any effect either on overall agreement or, more importantly, on the effect of comparative language on agreement. This pattern was reasonably consistent across the 10 pairs of compared items, as shown in the bottom of the figure.
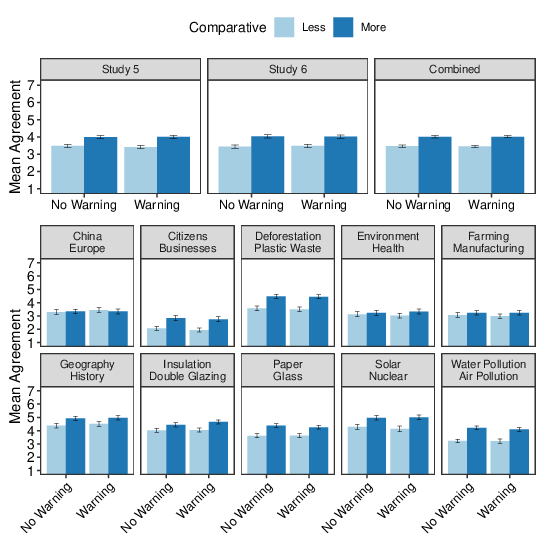
Figure 9: Mean agreement ratings for Studies 5 and 6. The top row shows the results for each study and when the data from the two studies are pooled; in these plots, the data have been collapsed across the 10 topics. The bottom two rows show the results for each topic, with the data pooled across the two studies; the pattern shown in the averaged data emerges quite consistently for each topic. The error bars show 95% confidence intervals, calculated separately for each condition (i.e., not using a pooled error term).
Inferential analyses supported these conclusions. Treating the agreement ratings as metric, for each study the means from each participant were submitted to a 2 (Comparative: Less vs More) x 2 (No Warning vs Warning) between-subjects ANOVA. The results are shown in Table 6 and indicate a substantial increase in agreement when comparatives are framed as more-than rather than less-than, with very little effect of warning; there is also very little indication that the two studies differ from one another.
The same approach to multilevel modelling was taken as for Studies 1 and 2, with both metric and ordinal (cumulative Probit) models fit via both frequentist and Bayesian estimation procedures.8 Warning condition was coded as -0.5 for No Warning, +0.5 for Warning. The parameter estimates for the metric models are shown in the left panel of Figure 10. The right-hand panels of the figure show the results from the cumulative Probit models. In all cases, the pattern is the same as from the ANOVAs. In addition, the Bayesian estimates of the Discrimination parameters (reflecting the effect of the experimental variables on the variance of the latent agreement dimension) are near zero, with only small values being credible.
Table 6: ANOVA results for Studies 5 and 6. Note. Passed Check indicates the subset of participants who did not falsely report seeing the warning when it had not been presented or report not seeing the warning when it had been presented. Comp = Comparative (Less vs More); Warn = Warning Condition (No Warning vs Warning).
Study Data Term F (df) p η2 90% CI 5 All Comp 145.84 (1, 534) <.001 .215 [.166, .263] 5 All Warn 0.40 (1, 534) .529 .001 [.000, .009] 5 All Comp x Warn 1.12 (1, 534) .291 .002 [.000, .013] 6 All Comp 138.62 (1, 507) <.001 .215 [.165, .264] 6 All Warn 0.07 (1, 507) .785 .000 [.000, .006] 6 All Comp x Warn 0.29 (1, 507) .594 .001 [.000, .009] 5 Passed Check Comp 124.92 (1, 478) <.001 .207 [.156, .258] 5 Passed Check Warn 0.01 (1, 478) .912 .000 [.000, .002] 5 Passed Check Comp x Warn 1.45 (1, 478) .228 .003 [.000, .017] 6 Passed Check Comp 125.94 (1, 473) <.001 .210 [.159, .261] 6 Passed Check Warn 0.14 (1, 473) .713 .000 [.000, .008] 6 Passed Check Comp x Warn 0.06 (1, 473) .806 .000 [.000, .006] 5 & 6 All Comp 284.45 (1, 1041) <.001 .215 [.180, .249] 5 & 6 All Warn 0.05 (1, 1041) .815 .000 [.000, .003] 5 & 6 All Study 0.41 (1, 1041) .524 .000 [.000, .005] 5 & 6 All Comp x Warn 0.11 (1, 1041) .736 .000 [.000, .003] 5 & 6 All Comp x Study 0.08 (1, 1041) .772 .000 [.000, .003] 5 & 6 All Warn x Study 0.40 (1, 1041) .528 .000 [.000, .005] 5 & 6 All Comp x Warn x Study 1.24 (1, 1041) .265 .001 [.000, .007]
To obtain overall parameter estimates and to see whether the different warning instructions given in Studies 5 and 6 differentially affected performance, the data from the two studies were combined. The results of a 2 (Comparative) x 2 (Warning condition) x 2 (Study) factorial ANOVA on the mean agreement ratings is shown in Table 6. The corresponding multilevel model estimates are plotted in the bottom two panels of Figure 10.9
These analyses indicate the same pattern as the analyses of the individual studies, with tighter confidence intervals because of the pooled data. Apart from the effect of Comparative, the only notable results are that there is quite a lot of uncertainty about the size of the three-way interaction (i.e., whether the effectiveness of warnings at moderating the effect of Comparative varies between the two forms of warning) and that the Bayesian ordinal regression estimates of the effect of Study and the Study x Comparative interaction on Discrimination have credible intervals that just exclude zero; however, the intervals are very narrow and do not extend far from zero, so while the studies may differ in the standard deviation of the latent agreement variable, any difference is probably small.
Studies 5 and 6 differ from some studies that have used warnings to moderate the use of fluency in that they probed whether participants had processed the warning sufficiently to remember having seen it at the end of the experiment. Table 7 shows the proportion of participants in the Warning and No Warning conditions who indicated that they had, had not, or could not remember having seen the warning. In general, 80–90% of participants correctly indicated that they had or had not seen the warning, although a sizeable portion of those in the No Warning condition were unsure, perhaps thinking that they might have missed it. To explore whether poor attention from some participants might underlie the minimal effect of warnings on participants’ responses, I analyzed the data from each study after excluding participants who answered the memory check question incorrectly (people who responded "don’t know" were not excluded). The ANOVA results are shown in Table 6 and are very similar to those for the full data sets. The multilevel regression analyses likewise yielded parameter estimates and CIs that closely resembled those for the full data set.
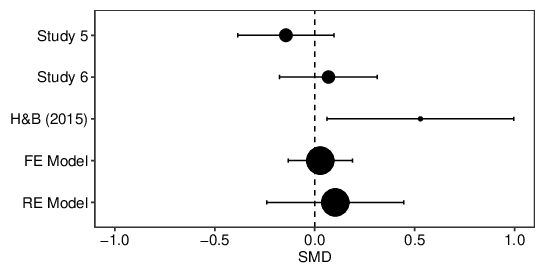
Finally, I compared the present results with those of Hoorens and Bruckmüller’s (2015) Study 7. I focused on the effect of Warning condition on the participants in the Less condition (because Hoorens and Bruckmüller did not include a warning for participants in the More condition). Figure 11 shows the standardized mean differences (Hedge’s g) for each study; positive values mean the warning increased agreement. The population effect was estimated using both fixed and random effect meta-analyses (Viechtbauer, 2010; the analyses indicated that the studies were heterogeneous, Q(df=2) = 6.48, p=.039). As shown in the figure, the confidence intervals for the originally-published effect are wide; the meta-analytic estimates are close to zero, although as would be expected with so few studies, the estimate from the random effects model has quite wide confidence intervals.
Taken together, Studies 5 and 6 suggest that warning participants not to base their responses on fluency has little effect on the influence that comparative language has on agreement. The only previous investigation of this issue used a smaller sample of participants (total N = 130, cf 1049 here) and only issued a warning to participants in the Less condition. Of course, the present data do not negate that earlier work, but overall there is little indication that warnings exert much effect.
The effect of warnings was taken by Hoorens and Bruckmüller (2015) as evidence that the more-credible effect is a fluency effect: "more" is presumed to be easier to process than "less", and this ease is mis-attributed to the truthfulness of the statement. Putting aside the fact that warnings had little effect in Studies 5 and 6, this reasoning is indirect. Studies 7–9 therefore investigate the role of processing fluency by measuring the time taken to read each type of comparative sentence, and the link between this processing time and the perceived credibility of the statement.
In Study 7, participants read 10 comparative statements framed as "more than" or "less than"; the viewing time was recorded. In order to avoid viewing time being influenced by the process of overtly deciding upon the credibility of the statement and producing a response, the questions probing agreement and perceived truth came after all of the statements had been read.
The final sample comprised 537 participants, 275 in the Less condition and 262 in the More condition.
The initial instructions stated: "On the following pages you will be asked to read various statements. Please read each statement carefully. We will ask you some questions about them at the end." (The last sentence was in boldface and underlined.) In a between-subjects design, participants were then randomly allocated to read either the Less or the More versions of the comparative statements used in Study 1. When they had read the sentence they clicked the continue button to progress to the next statement. The survey software recorded the time spent on each page.
After reading all 10 comparative statements (with order randomized for each participant), participants came to a page that asked them: "Overall, do you agree or disagree with the set of statements that you have just read?" with response options "Strongly Disagree", "Disagree", "Somewhat Disagree", "Neither Agree nor Disagree", "Somewhat Agree", "Agree", and "Strongly Agree"), and "Do you think the statements you just read were:" with response options "All True", "Mostly True", "Slightly More True than False"; "Equally True and False"; "Slightly More False than True"; "Mostly False"; "All False". Both questions were on the same page, with the vertical arrangement of the questions randomized. Due to a problem with the software, participants could progress to the debriefing page without answering either question; 1 participant did so and was remunerated but excluded from the final sample.
For this study and the next, the responses were treated as metric variables.10 Responses to both questions were coded from 1 to 7 with larger numbers indicating greater credibility (stronger agreement/more of the statements being true); responses to the two questions were quite strongly correlated (r = .763) and so were averaged to form an overall index of credibility. For each participant, I computed the total viewing time; these values were log-transformed (by log10(x)) in order to symmetrize the distribution and reduce the effect of extreme observations.
Figure 12 plots the associations between Comparative condition, viewing time, and credibility judgments; Figure 13 plots the results of corresponding regression analyses. To facilitate interpretation, the coefficient for the regression of log(Viewing Time) on Comparative condition has been exponentiated (as 10B) , so that it indicates the proportional difference between the Less and More conditions (e.g., a value of 0.5 would mean that the time in the More condition was half of that in the Less condition). As shown in the figures, participants in the More condition rated the statements as more credible (M = 4.50, SD = 1.025) than did those in the Less condition (M = 3.99, SD = 1.21); they also read the statements more quickly, with geometric mean viewing times of 54.6 seconds and 46.5 seconds for the Less and More conditions, respectively. Finally, longer viewing times were associated with lower mean credibility ratings.
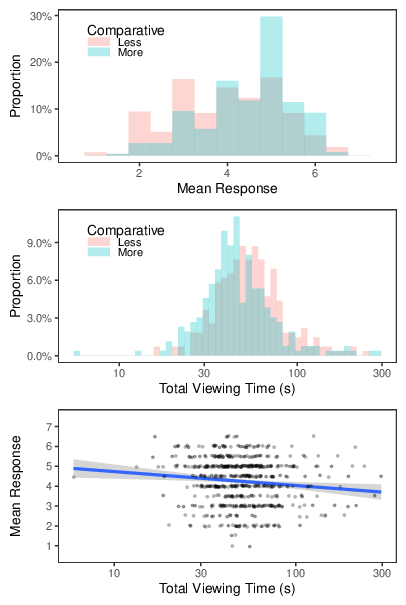
Figure 12: Results of Study 7. The top panel shows the distribution of credibility judgments for each condition; the middle panel shows the distribution of viewing times for each condition; the bottom panel shows the association between credibility judgments (with some jitter to reduce overplotting) and viewing times, with the least-squares regression line added to illustrate the trend.
To examine whether viewing time mediates the effect of Comparative on credibility, estimates of the total, direct, and indirect effects were obtained, based on the causal modelling framework described by Imai and colleagues (e.g., Imai et al., 2010). As before, different analyses were conducted in order to check the robustness of the inferences to changes in the statistical procedures: two sets of estimates were obtained using the mediation package for R (Tingley et al., 2014): bias-corrected accelerated confidence intervals with conventional standard errors, and a quasi-Bayesian approximation with robust standard errors (in each case based on 10,000 simulations); a third set of estimates was obtained via Bayesian parameter estimation using the mediation function of the bayestestR package for R (Makowski et al., 2019), with default settings.
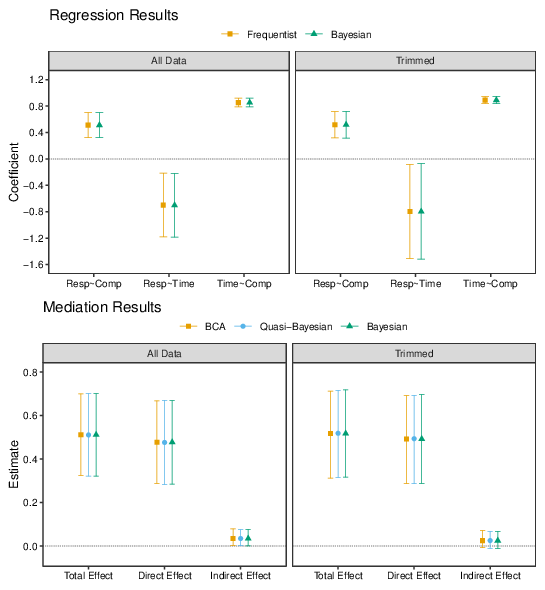
Figure 13: Regression analysis results for Study 7. The top row shows the Frequentist and Bayesian coefficient estimates when responses are regressed on Comparative condition (Resp~Comp), when responses are regressed on log-transformed viewing time (Resp~Time), and when log-transformed viewing time is regressed on condition (Time~Comp). The bottom row shows the estimated total effect, direct effect and indirect effect from mediation analyses; the BCA, Quasi-Bayes and Bayesian points indicate the results obtained with different estimation procedures, as described in the main text.
The bottom panels of Figure 13 show the results of these mediation analyses. As indicated by the foregoing regression analyses, there is a substantial total effect of Comparative, corresponding to a shift in mean credibility judgments of about half a scale point; there is uncertainty about the size of this effect, but even the lower ends of the CIs indicate quite a sizeable influence of language on agreement and perceived truth. The estimates of the indirect effect provide some indication that this effect is partially mediated by the increased time taken to process less-than statements. The bias-corrected and quasi-Bayesian confidence intervals both just exclude zero, with estimates of the proportion of the total effect of Comparative that is mediated by log-transformed viewing time estimated to be 6.72% (95% CI = [1.04, 18.19], p=.044) in the BCA analysis and 6.49% (95% CI = [0.32, 16.74], p=.036) in the Quasi-Bayesian analysis. The Bayesian estimate has a 95% credible interval that just includes zero, with the proportion mediated estimate being 6.71%, 95% CI = [-1.50, 14.92]. (Caution should be exercised when interpreting "proportion mediated" estimates – see e.g., Vuorre & Bolger, 2018 – but they provide a useful indicator of the contribution of the indirect pathway.)
Although the log-transformed viewing time distribution is approximately normal, it is rather heavy-tailed with some very small and very large observations, perhaps indicating participants who were inattentive. To check the robustness of the results, the analyses were repeated after removing those participants with the shortest 5% and longest 5% of viewing times (as indicated by the empirical cumulative distribution function). The corresponding regression coefficients are shown in the right-hand panels of Figure 13; the relations between condition, responses, and viewing times are similar to before but the estimate of the association between credibility judgments and viewing times is noticeably imprecise. In the mediation analysis, the central estimates of the indirect effect are similar to the analysis of the whole data set, but the confidence intervals now just include zero.
These results provide some support for the idea that fluency contributes to the more-credible effect. People spent longer reading more-than statements than less-than statements, indicating that the latter were harder to process – a sine qua non for the proposition that fluency underlies the effect of comparatives on credibility. The mediation analyses suggest that the effect of language choice on processing time may partly mediate its effect on credibility, but the estimated contribution of fluency is modest and could plausibly be zero or something very close to it.
In the previous study, participants read all 10 comparative statements and then provided a global judgment about the ensemble. In Study 8, each participant read a single comparative sentence and then rated their agreement with that claim.
The final sample comprised 1059 participants, 523 in the Less condition and 536 in the More condition.
The stimuli were the comparative statements used in Study 2. Participants received the same initial instructions as in Study 7; they then read a single randomly-selected comparative statement in either the Less or More condition; the viewing time was recorded by the survey software. On the next page they were asked: "To what extent to you agree or disagree with the statement that you just read?" with 7 responses options from "Strongly Disagree" to "Strongly Agree", as in Study 7.
The associations between Comparative condition, viewing time, and agreement judgments are plotted in Figure 14, which shows the results collapsed over topic. Figure 15 shows the corresponding regression results, both for the full dataset and after removing the participants with the shortest 5% and longest 5% of viewing times within each topic.11 As before, the coefficient for the regression of log(Viewing Time) on Comparative has been exponentiated (as 10B) so the coefficient indicates the proportional reduction in viewing time upon moving from the Less condition to the More condition.
As shown in the figures, participants in the Less condition indicated lower levels of agreement with the statements (M = 3.79, SD=1.60) than did those in the More condition (M = 4.29, SD=1.54); participants in the Less condition also took longer to read the statements (geometric M = 7.36 s) than did those in the More condition (geometric M = 6.34 s). And participants who spent longer viewing the statements indicated less agreement than did those who processed them more quickly.
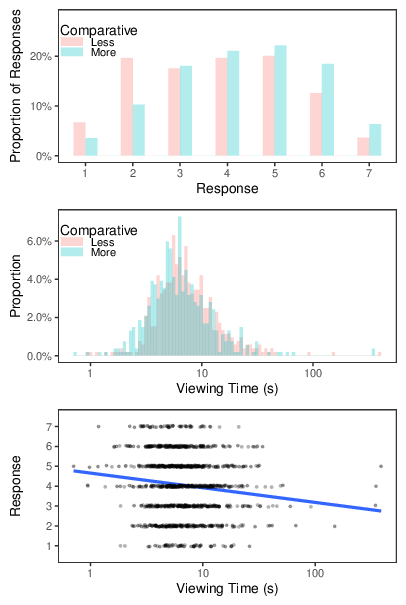
Figure 14: Results of Study 8. The top panel shows the distribution of agreement ratings for each condition; the middle panel shows the distribution of viewing times for each condition; the bottom panel shows the association between agreement ratings (with jitter to reduce overplotting) and viewing times, with the least-squares regression line added to illustrate the trend.
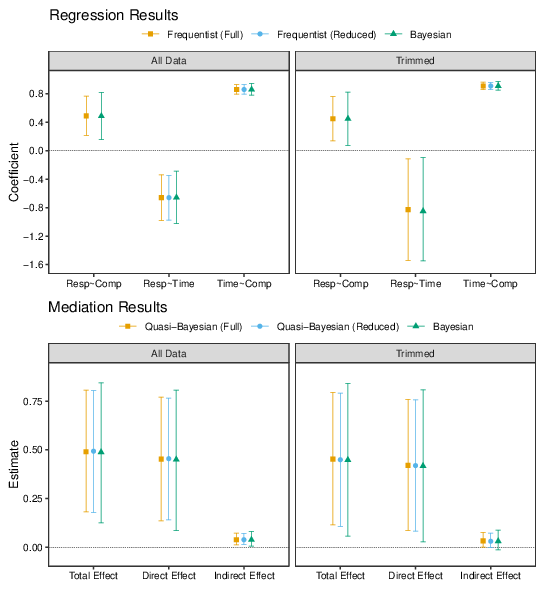
Figure 15: Regression analysis results for Study 8. The top row shows the Frequentist and Bayesian coefficient estimates when responses are regressed on Comparative condition (Resp~Comp), when responses are regressed on log-transformed viewing time (Resp~Time), and when log-transformed viewing time is regressed on condition (Time~Comp). The bottom row shows the estimated total effect, direct effect and indirect effect from mediation analyses. The different sets of points show the results obtained with different estimation strategies, as described in the main text.
Several different multilevel mediation analyses were conducted. The first two used the mediation package for R (Tingley et al., 2014): one was based on the maximal random effects structure for both the M-Model (the regression of log-Viewing Time on Comparative) and the Y-Model (the regression of Response on Comparative and log-Viewing Time simultaneously); the other analysis simplified the random effects structures when the maximal model was singular.12 The mediation package does not permit bias-corrected accelerated confidence intervals or robust standard errors for this kind of model, so only the Quasi-Bayesian confidence intervals are reported. A third set of estimates were obtained by Bayesian estimation using the bmlm package for R (Vuorre, 2017); for this analysis, the log-viewing times are mean-centred within each topic (Vuorre & Bolger, 2018).
The bottom panels of Figure 15 show the results of these mediation analyses. For the full dataset, the average total effect is substantial although there is quite a bit of uncertainty/imprecision in the estimates; by comparison, the indirect effect (average causal mediation effect) is quite small, although for all three analyses the CIs exclude zero. The estimates of the proportion of the total effect that is mediated by log-Viewing Time are estimated to be about 7 or 8 percent (for the Quasi-Bayesian (Full) analysis: 7.61%, 95% CI = [2.10 – 26.14]; for the Quasi-Bayesian (Reduced) analysis: 7.62%, 95% CI = [2.52 – 23.24]; for the Bayesian analysis: 9.00%, 95% CI = [0.01 – 28.59]). The estimates of the effects are similar for the trimmed data, but the confidence intervals for the Bayesian and Quasi-Bayesian (Reduced) models now just include zero; the estimates of the proportion of the total effect mediated by viewing time are 6.72%, 95% CI = [-0.00 – 27.24], 6.41%, 95% CI = [-0.00, 26.54], and 11.64%, 95% CI = [-0.06, 34.85] for the Quasi-Bayesian (Full), Quasi-Bayesian (Reduced) and Bayesian estimates, respectively.
This study, like the last, provides some limited support for the fluency account of the more-credible effect: more-than statements had shorter viewing times than less-than statements, and the effect of comparative language was partially mediated by this difference in processing time. However, the central estimates of the mediation effect were not very large and the CIs were quite wide, extending down to near zero – and if the data are trimmed to exclude the participants with the most extreme viewing times (arguably a sensible approach for noisy on-line measurements), the hypothesis of no mediation at all remains plausible.
The final study further examined the links between comparative language, processing time and credibility judgments. It used the stimuli and true-or-false decision task of Study 3 (which found no effect of more/less framing on judgments of truth) but adopted the procedure and viewing-time recording of Study 8. This structure means that we can check the replicability of the results of Study 3 and, more importantly, examine whether the nugatory effect of comparative adjective on responses in that study is or is not accompanied by a change in processing time. For example, if we find that the more-than statements are again processed more quickly than the less-then statements but with no corresponding difference in truth judgments, it would imply that fluency is not a sufficient cause of the more-credible effect.
The final sample comprised 1268 participants: of those in the Less condition, 317 read false statements and 316 read true statements; in the More condition, 320 read false statements and 315 read true ones.
Each participant was randomly assigned to read one of the true or false statements from Study 3, in either the Less or More framing; viewing time was recorded. On the subsequent page, they were simply asked: "Was the statement that you just read:" and selected either "True" or "False". In other respects, this study was identical to the last two.
Figure 16 shows the results collapsed across the 12 topics; the left column shows the results when the statements were false, the right columns those when the statements were true. The top panel indicates the effect of Comparative condition on the overall tendency to endorse statements as true; there is little indication of a difference between less-than and more-than framing (overall proportion of statements judged true = 61.1% and 59.2%, respectively). The middle row plots the distributions of viewing times; again, the Less and More conditions appear to be similar (overall geometric means = 9.80 s and 9.13 s for the Less and More conditions, respectively). Finally, the bottom row plots the viewing time distributions as a function of whether the participant went on to judge the statement True or False; the time distributions are similar for each response (overall geometric means = 9.77 s and 9.27 s for "False" and "True" responses, respectively).
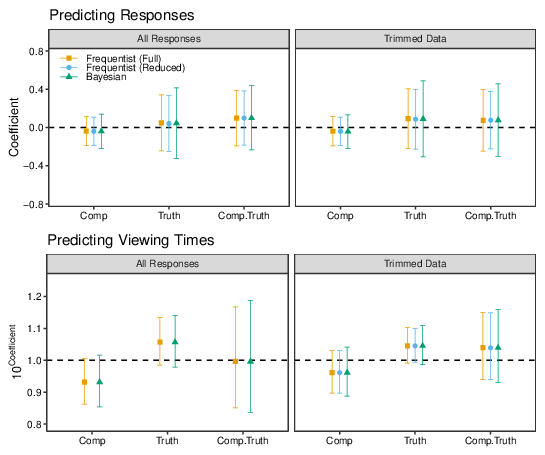
Figure 17 plots the Frequentist and Bayesian regression coefficients from models in which responses and log-viewing times were predicted from Comparative, Truth Status (coded -0.5 for False, +0.5 for True) and their interaction; as for the previous studies, the analyses were conducted on the full dataset and after removing the shortest 5% and longest 5% of viewing times (separately for each of the 12 topics). For the response analysis, Probit regression is reported (the pattern was the same with logistic regression); for the viewing-time analysis, the plot shows exponentiated coefficients (as 10B), so they indicate the ratio of the viewing time in the More condition to that in the Less condition.13
The parameter estimates echo the visual impressions from Figure 16: the effect of Comparative on judgments of truth has confidence intervals that tightly cluster around zero. There is some indication that more-than statements were processed more quickly than less-than statements and that false statements were read more rapidly than true ones, but these effects are small and not reliably different from zero. The effect of truth-status on responses, and the interaction between truth and comparative language, are estimated to be near zero, but there is more uncertainty about these coefficients. The results with the trimmed data are virtually identical to the those for the full dataset, and the effect of comparative on viewing time is even closer to zero.
Like Study 3, which used the same sentences, Study 9 found no meaningful effect of comparative on credibility. Although there was some indication that the more-than statements were read more rapidly than the less-than statements, we can be reasonably confident that this effect was small – especially after exceptionally long/short viewing times are discounted. When there is no effect of comparative on responses, there is no need to perform mediation analysis. Nonetheless, the results of this study speak indirectly to the proposal that fluency underlies the more-credible effect: had the observed similarity of responses in the More and Less conditions been accompanied by a pronounced difference in processing times, it would have indicated that processing fluency is not sufficient for the more-credible effect and have necessitated some qualification of the fluency explanation. As things stand, the data are broadly consistent with the idea that, when more-than comparisons are processed more easily than less-than statements, they are also more likely to regarded as credible.
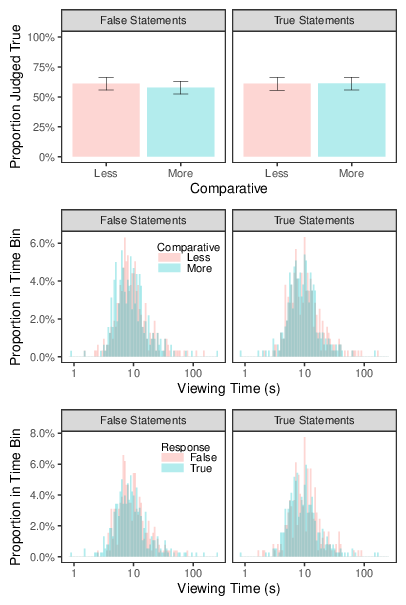
Figure 16: Results of Study 9, pooled across topics. The left column shows the results for false statements; the right column shows the results for true statements. The top panels show the proportion of statements judged to be true in the Less and More conditions; the error bars are 95% Wilson confidence intervals, calculated separately for each cell of the design. The middle row shows the distribution of viewing times for the Less and More conditions. The bottom row shows the distribution of viewing times for statements judged True and for those judged False.
These studies generalize and help clarify the effect of comparative language on credibility. In Studies 1, 2, and 4-8, participants indicated greater agreement with, and judged as more likely to be true, statements of the form "A is more than B" than those of the form "B is less than A", despite the same ordinal relation being described in each case. This pattern was robust to changes in a wide variety of experimental design variables (between-subject versus within-subject manipulation of comparative; single-trial decisions versus multiple responses; US vs UK participants; mapping of stronger agreement to low numbers or high numbers; agreement ratings versus true-or-false judgments) and to explicit warnings not to use ease-of-processing as the basis for judgment. The results were also largely unaffected by different analysis/estimation procedures. However, the effect of comparative did not hold for all stimulus sets: the perceived truth of the land-use statements in Studies 3 and 9 were unaffected by the choice of comparative, implying an important constraint on the generality of the effect. Finally, Studies 7-9 established links between the choice of comparative, processing time, and judged credibility of the statement.
These results help to clarify the basis for the more-credible effect. The ordinal regression analyses indicate that the choice of comparative can be conceptualized as a shift in the location of a latent "agreement" dimension, with little or nor change in the variance of that distribution. More importantly, these studies provide several lines of evidence regarding the role of fluency in producing the effect. First, warning participants to ignore ease of processing had minimal impact. Of course, this could be idiosyncratic to the stimuli used here, or a type II error. Still, the only previous study to have examined the effects of warnings (Hoorens & Bruckmüller, 2015) found an effect that, while substantial, had confidence intervals that reach almost to zero, and meta-analysis indicates that the current best estimate of the effect is very small. This might imply that fluency is irrelevant to the more-credible effect. Alternatively, drawing on studies of anchoring effects (where comparison of a target quantity with an ostensibly irrelevant number influences a subsequent estimate of that target even when people have been warned about the effect of anchors -– e.g., Epley & Gilovich, 2005), the null effect of warnings could indicate that the effect of comparative adjectives arises via activation of semantic knowledge upon which the judgment is based (Strack & Mussweiler, 1997), and/or that people are unaware of the direction of their own bias and hence do not know how to correct it (Simmons et al., 2010). Notwithstanding its implications for the fluency account, the near-zero effect of warnings is of practical significance: a simple warning is probably not enough to "debias" people.
Second, Studies 7 and 8 found that more-than framing resulted in statements being processed more quickly, as well as judged more credible, than less-than statements; in Study 9, which used statements whose credibility was unaffected by the choice of comparative, there was no effect of comparative on processing time. This pattern is consistent with the idea that processing time underlies the link between comparative and credibility. However, when the mediation effect was assessed it was found to be modest: in Studies 7 and 8, viewing time accounted for about 6 or 7% of the total effect, and when the data were trimmed to remove extreme observations, the confidence and credible intervals for the indirect effect often included zero.
Measurement error probably contributes to this limited effect: recording viewing times on-line is error-prone, and error in the measurement of a mediator will reduce the estimate of the indirect effect (e.g., Fritz et al., 2016). Perhaps a better indication of fluency would be obtained by asking participants to read the statements as quickly as possible rather than using the self-paced approach taken here. It might also be worth asking for self-reported judgments of ease of processing, rather than relying on reading time, since it is this "metacognitive" experience that is presumed to be critical to the effect. An additional observation is that the processing times for the stimulus sets that produced the more-credible effect were, on average, shorter than those for the stimulus set that did not. This might suggest a floor/ceiling effect (i.e., differences in fluency due to the choice of comparative only affect behaviour when the overall fluency of the sentences is relatively high). Finally, it should be noted that reading time does not purely indicate processing fluency (for example, it may also be influenced by the extent to which the participant engages in deep contemplation of the implications of the statement). In any case, taken together, the available data suggest that differences in fluency make some contribution to the effect of comparative language on credibility, but that other mechanisms are also at play and are perhaps more important.
One candidate for such a mechanism concerns the perceived magnitudes of the compared items. As noted in the Introduction, linguists typically assume that "more" is unmarked whereas "less" is marked –- and hence that the latter is reserved for comparisons in which both items are of low magnitude (e.g., Clark, 1969). Inspecting the items in Tables 2 and 3 (which elicited the more-credible effect), it is plausible that in most or all cases the compared items are both "high magnitude" –- for example, air pollution and water pollution both cause substantial harm, and health and environmental policies will probably both receive considerable attention in future elections. Although these stimuli were constructed with the aim of representing the kind of socio-political claims that people encounter in everyday life, they might inadvertently cluster at the upper end of the relevant magnitude scales. In other words, "air pollution is less harmful than water pollution" might be taken to imply that both forms of pollution are relatively unimportant, and consequently rejected as implausible.14
In contrast, the stimulus set for which the choice of comparative made negligible difference contrasted the land required to produce foodstuffs (Table 5); conceivably, participants had little sense of the magnitudes involved -– or perhaps regarded the land use as low because the question relates to only 1 kilo of the items. For such comparisons, a "less than" framing may no longer seem like such a violation of conventional usage, with correspondingly less effect on credibility judgments. (Alternatively, the land-use questions may be so far outside most participants’ realm of expertise that they feel they have no basis for judgment and respond randomly15; the small, potentially zero, population-level effect of truth status on truth judgments may support this idea.)
The possibility that absolute magnitude might modulate the more-credible effect was also noted by Hoorens and Bruckmüller (2015), but neither they nor the current studies provide data that directly test the idea. One approach to doing so would involve eliciting subjective magnitude ratings for the items forming each pair and seeing whether these moderate the effect of comparative language on credibility. Such a strategy would be hard to apply at the participant level, however, because having people explicitly indicate the perceived sizes of items is likely to affect the way that they process comparative statements about those items (and vice-versa). A more direct approach would be to incorporate magnitude as a design variable -– for example, by adopting a 2 (size of one object in the pair) x 2 (size of the other object) x 2 (comparative adjective: less or more) structure. Again, doing this in practice is not straightforward, because absolute magnitudes are likely to be confounded with the (perceived) magnitude difference between them (e.g., two large items are likely to be harder to discriminate than two small ones with the same absolute difference in magnitude). Nonetheless, with careful experimentation it might be possible to test the contributions of perceived magnitudes to the effect of comparative adjective on agreement and truth judgments.
Of course, other factors may also underlie the current results. As a general point, the choice of comparative signals the speaker’s knowledge, intentions and preferences (see e.g., Halberg et al., 2009; Matthews & Dylman, 2014; Teigen, 2008); correspondingly, speakers might typically use “more than” statements when they are more confident about the truth of their claim (a possibility which could readily be tested), such that greater agreement with “more than” statements is a rational response from the message-receiver. Relatedly, for comparisons involving numeric boundaries, an upper-bound modifier is more specific than the lower-bound modifier because of the bounded nature of the number system. That is, saying “A costs more than $X” permits an unbounded set of values for A, whereas saying “A costs less than $Y” means “A is between 0 and $Y. This scalar property of the number system may mean that, in general, “more than” statements are more likely to be true (see Halberg & Teigen, 2009; for a different perspective on the same principle, see Chandon & Ordabayeva, 2017).16 Finally, the choice of comparative might affect the ease with which the message-receiver can infer a context for the claim. Arguably, the statement “Electric cars will be more common than conventional cars” strongly implies that electric cars are the focus of discussion, whereas the context is less clear when the comparison is phrased as “Conventional cars will be less common than electric cars” – and people may find it easier to agree with statements whose context is easier to infer.17 Again, this possibility could be empirically investigated, by asking people to indicate their inferences about the context and examining whether these inferences predict agreement with the comparative claim.
It will also be important to generalize beyond "more" and "less". The tendency to favour "larger" comparatives applies to many dimensions (Matthews & Dylman, 2014), so a straightforward question is whether comparisons phrased as "larger", "taller", "higher" etc are judged more credible than those phrased as "smaller", "shorter", "lower" etc. Another line of enquiry concerns the potential for presentational factors to affect credibility via changes in the choice of comparative. For example, Skylark (2018) found that whether people say "A is more than B" or "B is less than A" depends on the left-right layout of the items, and the current experiments (and those of Hoorens and Bruckmüller, 2015) suggest that this language choice will, in turn, affect whether the message-receiver believes or agrees with the speaker’s claim. That is, the spatial and temporal presentation of items to one person may shape the beliefs that another individual forms about the relative magnitudes of those items – a possible source of miscommunication that has not yet been explored.
This area of research is at an interesting stage of development. On the one hand, the choice of comparative often exerts a pronounced effect on people’s acceptance of the statement in ways that are likely to have important practical implications and which cannot be eliminated by a simple warning. On the other hand, the mechanisms behind this effect are not yet fully explicated: ease of processing may play a role but does not offer a complete explanation; likewise, it is not yet possible to anticipate which comparisons will and will not be affected by the choice of comparative. Given the importance of understanding how people evaluate the credibility of comparative claims (e.g., about economic inequality; Bruckmüller et al., 2017), further investigating the basis for the effect of more-than vs less-than framing, and how the effect can be ameliorated, is an important direction for future work.
Barr, D. J., Levy, R., Scheepers, C., & Tily, H. J. (2013). Random effects structure for confirmatory hypothesis testing: Keep it maximal. Journal of Memory and Language, 68(3), 255–278. https://doi.org/10.1016/j.jml.2012.11.001
Bates, D., Mächler, M., Bolker, B. M., & Walker, S. C. (2015). Fitting linear mixed-effects models using lme4. Journal of Statistical Software, 67(1), 1–48. https://doi.org/10.18637/jss.v067.i01
Ben-Shachar, M. S., Lüdecke, D., & Makowski, D. (2020). effectsize: Estimation of effect size indices and standardized parameters. Journal of Open Source Software, 5(56), 2815. https://doi.org/10.21105/joss.02815
Bruckmüller, S., Reese, G., & Martiny, S. E. (2017). Is higher inequality less legitimate? Depends on how you frame it! British Journal of Social Psychology, 56(4), 766–781. https://doi.org/10.1111/bjso.12202
Brysbaert, M., Mandera, P., & Keuleers, E. (2018). The word frequency effect in word processing: An updated review. Current Directions in Psychological Science, 27(1), 45–50. https://doi.org/10.1177/0963721417727521
Bürkner, P.-C. (2017). brms: An R package for Bayesian multilevel models using Stan. Journal of Statistical Software, 80(1), 1–28. https://doi.org/10.18637/jss.v080.i01
Bürkner, P.-C. (2018). Advanced Bayesian multilevel modeling with the R package brms. The R Journal, 10(1), 395–411. https://doi.org/10.32614/rj-2018-017
Bürkner, P.-C., & Vuorre, M. (2019). Ordinal regression models in psychology: A tutorial. Advances in Methods and Practices in Psychological Science, 2(1), 77–101. https://doi.org/10.1177/2515245918823199
Chandon, P., & Ordabayeva, N. (2017). The accuracy of less: Natural bounds explain why quantity decreases are estimated more accurately than quantity increases. Journal of Experimental Psycholgy: General, 146(2), 250–268. https://doi.org/10.1037/xge0000259
Choplin, J. M. (2010). I am "fatter" than she is: Language-expressible body-size comparisons bias judgments of body size. Journal of Language and Social Psychology, 29(1), 55–74. https://doi.org/10.1177/0261927X09351679
Choplin, J. M., & Hummel, J. E. (2002). Magnitude comparisons distort mental representations of magnitude. Journal of Experimental Psychology: General, 131(2), 270–286. https://doi.org/10.1037/0096-3445.131.2.270
Christensen, R. H. B. (2019). ordinal. Regression models for ordinal data. (R package version 2019.12-10). https://cran.r-project.org/package=ordinal
Clark, H. H. (1969). Linguistic processes in deductive reasoning. Psychological Review, 76(4), 387–404. https://doi.org/10.1037/h0027578
Clark, H. H. (1973). The language-as-fixed-effect fallacy: A critique of language statistics in psychological research. Journal of Verbal Learning and Verbal Behavior, 12(4), 335–359. https://doi.org/10.1016/S0022-5371(73)80014-3
Epley, N., & Gilovich, T. (2005). When effortful thinking influences judgmental anchoring: Differential effects of forewarning and incentives on self-generated and externally provided anchors. Journal of Behavioral Decision Making, 18(3), 199-212. https://doi.org/10.1002/bdm.495
Fritz, M. S., Kenny, D. A., & MacKinnon, D. P. (2016). The combined effects of measurement error and omitting confounders in the single-mediator model. Multivariate Behavioral Research, 51(5), 681–697. https://doi.org/10.1080/00273171.2016.1224154
Gerber, J. P., Wheeler, L., & Suls, J. (2018). A social comparison theory meta-analysis 60+ years on. Psychological Bulletin, 144(2), 177–197. https://doi.org/10.1037/bul0000127
Greifeneder, R., Alt, A., Bottenberg, K., Seele, T., Zelt, S., & Wagener, D. (2010). On writing legibly: Processing fluency systematically biases evaluations of handwritten material. Social Psychological and Personality Science, 1(3), 230–237. https://doi.org/10.1177/1948550610368434
Halberg, A-M., & Teigen, K. H. (2009). Framing of imprecise quantities: When are lower interval bounds preferred to upper bounds? Journal of Behavioral Decision Making, 22, 490–509. https://doi.org/10.1002/bdm.635
Halberg, A-M., Teigen, K. H., & Fostervold, K. I. (2009). Maximum vs. minimum estimates: Preferences of speakers and listeners for upper and lower limit estimates. Acta Psychologica, 132, 228–239. https://doi.org/10.1016/j.actpsy.2009.07.007
Hasher, L., Goldstein, D., & Toppino, T. (1977). Frequency and the conference of referential validity. Journal of Verbal Learning and Verbal Behavior, 16(1), 107–112. https://doi.org/10.1016/S0022-5371(77)80012-1
Hoorens, V., & Bruckmüller, S. (2015). Less is more? Think again! A cognitive fluency-based more-less asymmetry in comparative communication. Journal of Personality and Social Psychology, 109(5), 753–766. https://doi.org/10.1037/pspa0000032
Imai, K., Keele, L., & Tingley, D. (2010). A general approach to causal mediation analysis. Psychological Methods, 15(4), 309–334. https://doi.org/10.1037/a0020761
Laming, D. (1997). The measurement of sensation. Oxford University Press.
Lawrence, M. A. (2016). ez: Easy analysis and visualization of factorial experiments (R package version 4.4-0). https://cran.r-project.org/package=ez
Lev-Ari, S., & Keysar, B. (2010). Why don’t we believe non-native speakers? The influence of accent on credibility. Journal of Experimental Social Psychology, 46(6), 1093–1096. https://doi.org/10.1016/j.jesp.2010.05.025
Liddell, T. M., & Kruschke, J. K. (2018). Analyzing ordinal data with metric models: What could possibly go wrong? Journal of Experimental Social Psychology, 79, 328–348. https://doi.org/10.1016/j.jesp.2018.08.009
Lüdecke, D., Ben-Shachar, M., Patil, I., & Makowski, D. (2020). Extracting, computing and exploring the parameters of statistical models using R. Journal of Open Source Software, 5(53), 2445. https://doi.org/10.21105/joss.02445
Makowski, D., Ben-Shachar, M., & Lüdecke, D. (2019). bayestestR: Describing effects and their uncertainty, existence and significance within the Bayesian framework. Journal of Open Source Software, 4(40), 1541. https://doi.org/10.21105/joss.01541
Matthews, W. J. (2011). What might judgment and decision making research be like if we took a Bayesian approach to hypothesis testing? Judgment and Decision Making, 8, 843-856.
Matthews, W. J., & Dylman, A. S. (2014). The language of magnitude comparison. Journal of Experimental Psychology: General, 143(2), 510–520. https://doi.org/10.1037/a0034143
Matthews, W. J., & Stewart, N. (2009). Psychophysics and the judgment of price: Judging complex objects on a non-physical dimension elicits sequential effects like those in perceptual tasks. Judgment and Decision Making, 4, 64-81.
McGlone, M. S., & Tofighbakhsh, J. (2000). Birds of a feather flock conjointly(?): Rhyme as reason in aphorisms. Psychological Science, 11(5), 424–428. https://doi.org/10.1111/1467-9280.00282
Morey, R.D. (2008). Confidence intervals from normalized data: A correction to Cousineau (2005). Tutorial in Quantitative Methods for Psychology, 4(2), 61–64.
Poore, J., & Nemecek, T. (2018). Reducing food’s environmental impacts through producers and consumers. Science, 360(6392), 987–992. https://doi.org/10.1126/science.aaq0216
R Core Team. (2020). R: A language and environment for statistical computing. https://www.r-project.org/
Reber, R. (2016). Critical feeling. How to use feelings strategically. Cambridge University Press.
Silva, R. R., Garcia-Marques, T., & Reber, R. (2017). The informative value of type of repetition: Perceptual and conceptual fluency influences on judgments of truth. Consciousness and Cognition, 51, 53–67. https://doi.org/10.1016/j.concog.2017.02.016
Simmons, J., Leboeuf, R. A., & Nelson, L. D. (2010). The effect of accuracy motivation on anchoring and adjustment: Do people adjust from provided anchors? Journal of Personality and Social Psychology, 99(6), 917–932. https://doi.org/10.1037/a0021540
Skylark, W. J. (2018). If John is taller than Jake, where is John? Spatial inference from magnitude comparison. Journal of Experimental Psychology: Learning, Memory, and Cognition, 44(7), 1113–1129. https://doi.org/10.1037/xlm0000505
Skylark, W. J., Carr, J. M., & McComas, C. L. (2018). Who says "larger" and who says "smaller"? Individual differences in the language of comparison. Judgment and Decision Making, 13(6), 547–561.
Skylark, W. J., Chan, K. T. F., Farmer, G. D., Gaskin, K. W., & Miller, A. R. (2020). The delay-reward heuristic: What do people expect in intertemporal choice tasks? Judgment and Decision Making, 15(5), 611–629.
Skylark, W. J., Farmer, G. D., & Bahemia, N. (2021). Inference and preference in intertemporal choice. Judgment and Decision Making, 16(2), 422–459.
Stanley, D. (2021). apaTables: Create American Psychological Association (APA) style tables (R package version 2.0.8). https://cran.r-project.org/package=apaTables
Strack, F., & Mussweiler, T. (1997). Explaining the enigmatic anchoring effect: Mechanisms of selective accessbility. Journal of Personality and Social Psychology, 73(3), 437–446.
Teigen, K.H. (2008). More than X is a lot: Pragmatic implicatures of one-sided uncertainty intervals. Social Cognition, 26(4), 379–400. https://doi.org/10.1521/soco.2008.26.4.379
Teigen, K. H., Halberg, A-M., & Fostervold, K. I. (2007a). Single-limit interval estimates as reference points. Applied Cognitive Psychology, 21, 383–406. https://doi.org/10.1002/acp.1283
Teigen, K. H., Halberg, A-M., & Fostervold, K. I. (2007b). More than, less than, or minimum, maximum: How upper and lower bounds determine subjective intervals estimates. Journal of Behavioral Decision Making, 20, 179–201. https://doi.org/10.1002/bdm.549
Tingley, D., Yamamoto, T., Hirose, K., Keele, L., & Imai, K. (2014). mediation: R package for causal mediation analysis. Journal of Statistical Software, 59(5), 1–38. http://www.jstatsoft.org/v59/i05/
Viechtbauer, W. (2010). Conducting meta-analyses in R with the metafor package. Journal of Statistical Software, 36(3), 1–48. https://www.jstatsoft.org/v36/i03/
Vuorre, M., (2017). bmlm: Bayesian multilevel mediation. R package version 1.3.4. https://cran.r-project.org/package=bmlm
Vuorre, M., & Bolger, N. (2018). Within-subject mediation analysis for experimental data in cognitive psychology and neuroscience. Behavior Research Methods, 50, 2125–2143. https://doi.org/10.3758/s13428-017-0980-9
Whittlesea, B. W. A. (1993). Illusions of familiarity. Journal of Experimental Psychology: Learning, Memory, and Cognition, 19(6), 1235–1253. https://doi.org/10.1037/0278-7393.19.6.1235
Zhang, Y. C., & Schwarz, N. (2020). Truth from familiar turns of phrase: Word and number collocations in the corpus of language influence acceptance of novel claims. Journal of Experimental Social Psychology, 103999. 1–6. https://doi.org/10.1016/j.jesp.2020.103999
Participants received a payment of £0.45 (Study 3), £0.25 (Studies 8 and 9) or £0.40 (all other studies). Recruitment typically involved an initial "dry run" of 20 participants to check for software problems etc, followed by recruitment of the remainder of the sample. In all studies, the recruitment platform was requested to provide participants whose first language was English, aged 18-100, working on a desktop computer, and with a 98% or higher approval rating. Typically, participants were blocked from participating if they had taken part in related studies (including earlier studies in this experimental series); however, this was not always perfectly implemented. To reinforce these criteria, the survey software was set to block participants whose IP address had previously finished the study, and to screen out participants that it detected as being from outside the target country or participating on a mobile device (by redirecting them to a page asking them to "return" the job on the recruitment platform). Similarly, at the start of the session the software asked participants if English was their first language, and redirected participants who answered "no". The main task was preceded by an information sheet and consent form; participants who answered "no" to any consent questions were also directed away from the study. Finally, for Study 2 and all subsequent studies, I added a "captcha" question before the landing page, to help screen out automated responses. (For Study 3, for the initial dry run of 20 participants, a minor error meant that the "captcha" was missing from the start of the survey; this was corrected for the remaining participants.) All participants who completed the study were remunerated, but to reduce the risk of non-independent data, I subsequently excluded from analysis possible duplicate participants -– those whose IP address appeared earlier in the data file (or with overlapping timestamps) or in the data file for an earlier study in the series. For Study 5, the “dry run” revealed a randomization error and the 17 people who took part were discarded without analysis. A software glitch meant that these participants were not blocked from taking part in the final, corrected version of the study, but the usual IP and Prolific-ID duplication screening steps mean that it is unlikely that any duplicate participants made it into the final data set.
All analyses were conducted using R (R Core Team, 2020). ANOVAs were conducted using the ez package for R (Lawrence, 2016); Cohen’s d and its confidence intervals were computed using pooled standard deviations using the effectsize package (Ben-Shachar et al., 2020); confidence intervals for partial eta-squared values were calculated using the apaTables package (Stanley, 2021).
Frequentist metric mixed effects models were fit using the lme4 package for R (Bates et al., 2015), which uses restricted maximum likelihood estimation. Degrees of freedom were approximated using Satterthwaite’s method via the parameters package for R (Lüdecke et al., 2020). On some occasions the estimation procedure failed to converge; in such instances I first changed the optimizer settings (to "bobyqa" with a maximum of 20,000 iterations) and, if this did not resolve the issue, simplified the model.
Frequentist ordinal mixed effects models were fit using the clmm function from the ordinal package for R (Christensen, 2019). Like for the metric models, I initially specified a maximal random effects structure and simplified it in the event of fitting problems or perfectly correlated group-level effects. The parameter estimates are accompanied by 95% Wald confidence intervals.
The Bayesian multilevel models were fit using the brms package for R (Bürkner, 2017, 2018). I used the default priors, as described in (Bürkner, 2017); for the population-level effects, these are improper flat priors on the reals. All Bayesian fitting initially used 4 chains with 12,000 iterations per chain, of which the first 2000 were warm-up, with the fitting parameters r_init = 0.1 and adapt_delta = 0.95 (and the default max_treedepth = 10). In the event of estimation problems (e.g., divergent transitions after warm-up), the total number of iterations to was increased to 14,000 with 4000 warm-up, adapt_delta was increased to 0.99, and sometimes max_treedepth was increased to 15; if problems persisted the model was simplified.
The Bayesian multilevel mediation analysis of Study 8 conducted using the bmlm package (Vuorre, 2017) used the default priors, which are slightly different from those used in the brms package that was used for the other Bayesian regressions reported in this paper (e.g., the population-level regression coefficients have Gaussian priors with an SD of 1000). It is not completely clear from the software documentation whether the credible intervals reported by this package are equal-tailed intervals or highest density intervals. There were 4 chains with 14,000 iterations, of which the first 4000 were warmup; r_init = 0.1 and adapt_delta = 0.95.
This document was translated from LATEX by HEVEA.