Judgment and Decision Making, Vol. 16, No. 2, March 2021, pp. 267-289
Underweighting of rare events in social interactions and its implications to the design of voluntary health applications
Ori Plonsky*
Yefim Roth#
Ido Erev$
|
Abstract:
Research on small repeated decisions from experience suggests that people
often behave as if they underweight rare events and choose the options
that are frequently better. In a pandemic, this tendency implies
complacency and reckless behavior. Furthermore, behavioral contagion
exacerbates this problem. In two pre-registered experiments
(Ntotal = 312), we validate these predictions and
highlight a potential solution. Groups of participants played a repeated
game in one of two versions. In the basic version, people clearly
preferred the dangerous reckless behavior that was better most of the time
over the safer responsible behavior. In the augmented version, we gave
participants an additional alternative abstracting the use of an
application that frequently saves time but can sometimes have high costs.
This alternative was stochastically dominated by the
responsible choice option and was thus normatively irrelevant to the
decision participants made. Nevertheless, most participants chose the new
(“irrelevant”) alternative, providing the first clear demonstration of
underweighting of rare events in fully described social games. We discuss
public policies that can make the responsible use of health applications
better most of the time, thus helping them get traction despite being
voluntary. In one field demonstration of this idea amid the COVID-19
pandemic, usage rates of a contact tracing application among nursing home
employees more than tripled when using the app also started saving them
a little time each day, and the high usage rates sustained over at
least four weeks.
Keywords: decisions from experience; COVID-19; behavioral game theory
1 Introduction
Public behavioral response to physical distancing guidelines can have huge
effects on getting the coronavirus pandemic under control. For example,
model-based simulations suggest that a mere 10% increase in compliance
with guidelines can be more effective than isolating the entire senior
population of a country for three months (Barak et al., 2020). It is thus
worth trying to understand the determinants of compliance.
Compliance is likely influenced by many factors, including people’s
perception of the potential risks and their system of beliefs (e.g.,
Glöckner et al., 2020). These factors are themselves moderated by political
ideologies, religious beliefs, cultural norms, insufficient or biased
information, and lacking or incoherent communication from authorities. In
the current paper, however, we hold constant people’s perceptions of the
risks and their beliefs and aim to shed light on another factor that can
affect compliance: the basic tendencies that affect repeated decisions from
experience.
Analysis of repeated decisions from experience suggests people are unlikely
to naturally adopt responsible behaviors in a pandemic, even if it is in
their best interest to do so (Erev et al., 2020). This unfortunate
prediction is consistent with evidence that, absent supervisory
enforcement, workers often fail to engage in safe behaviors like using
protective gear, even if they perceive the potential risk to be higher than
it truly is (Zohar & Erev, 2007). More generally, people often want and
plan to behave responsibly, but experience leads them to let down their
guard and become complacent. For example, in the late 1990s, most buyers of
new vehicles in Israel chose to purchase more expansive car radios that
have detachable panels, safety devices that reduce the risk of
theft. However, after only two weeks, most people stopped detaching the
panel, behaving as if they believe “it won’t happen to me” (Yechiam et al.,
2006).
Learning to become complacent is predicted under the hypothesis that, in
repeated experience-based decisions, people are far more sensitive to the
common (high probability) experiences than they are to rare events (Erev &
Roth, 2014).1 In a pandemic, reckless behaviors lead to dire
consequences (e.g., getting infected or unknowingly infecting others)
relatively rarely; more often, such behaviors save time and/or effort
compared to the more responsible behaviors. To make things worse, in a
pandemic, even careful people are at risk when others around them behave
recklessly. The tendency of many people to behave as if “it won’t happen to
them” can then reduce the incentive for otherwise-careful people to behave
responsibly: if responsible behavior is unlikely to keep one safe, it is
not worth the extra effort.
We previously demonstrated this predicament using the “Reckless or
Responsible” game shown in the top panel (“Without-App”) of Table 1 (Roth
et al., 2020). This game abstracts a setting in which being reckless is
better most of the time, whereas responsible behavior is better on
average, but only if no other person behaves recklessly (below we provide
a detailed explanation of the logic that underlies the choice of game
features). The game has two Nash equilibria (choice profiles from which
unilateral deviation is futile): An efficient equilibrium in which all
players behave responsibly (and get 0 with certainty) and an inefficient
equilibrium in which all players behave recklessly (and lose 0.22 on
average). Importantly, beliefs concerning the pandemic and perception of
the risks involved are held constant in this game because (a) information
concerning the payoff distributions is accurate and fully disclosed and
(b) participants are unaware of the framing of the choice options as
reckless or responsible behaviors (the options are neutrally labelled).
Experimental results showed near-universal convergence to the inefficient
and dangerous equilibrium (Table 1, Exp. 1, Condition Without-App).
To increase the chances for getting the pandemic under control, it may thus
be helpful to change the game by making the common experience from
reckless behavior less attractive than the common experience from
responsible behavior. Doing this at scale is challenging, but the example
of China is revealing. One prominent example of a policy implemented there
that made the common experience from reckless behavior less appealing than
the common experience from responsible behavior is the development of
health signal applications that estimate users’ risk of being infectious
(which increases with reckless behaviors) and translate it to a color code
(green, yellow, or red). Having a green code (which implies mostly
responsible behaviors) on such applications was nearly essential for
daily life, as those without it could not travel or access public
facilities (Weinland, 2020).
Although effective, these types of systems may be incompatible with
democratic principles and are unlikely to be adopted by most western
democracies. Instead, it should be possible to offer health signal
applications on a voluntary basis. How can we achieve wide adoption for
such voluntary applications? We suggest that because people are sensitive
to the common experiences, it may suffice to make the common experience
from using the application better than the common experience from not
using it. For example, consider a policy that allows two ways to enter
workplaces and public facilities: showing a “green code” on a health
signal application or joining a queue for people without the application.
Those without applications would be required to fill certain declaration
forms and pass certain physical tests, and their numbers inside certain
public facilities (e.g., public transportation) could even be limited.
Policies of this kind can be politically justified. Access is not denied
from people without the application; it is only made slightly more
cumbersome, and for valid reasons: using the application simply serves the
need to monitor those who enter public facilities during a pandemic.
| Table 1: The Reckless or Responsible game, with and without the possibility
of App-Use. |
| | | | Choice rate |
|
Choice option | Payoff structure | EV | Exp. 1 | Exp.
2a |
| Condition Without-App |
| Reckless | +1, 0.98; −60 otherwise | −0.22 | 0.91 | 0.74 |
| Responsible | If none of the agents chooses Reckless: 0 with certainty | 0 | 0.09 | 0.26 |
| | If at least one agent chooses Reckless: 0, 0.98; −60 otherwise | −
1.20 | | |
| Condition With-App |
| Reckless | +1, 0.98; −60 otherwise | −0.22 | 0.16 | 0.14 |
| Responsible | If none of the agents chooses Reckless: 0 with certainty | 0 | 0.22 | 0.25 |
| | If at least one agent chooses Reckless: 0, 0.98; −60 otherwise | −
1.20 | | |
| App-Use | If none of the agents chooses Reckless: +2, 0.9; −19 otherwise | −0.10 | 0.62 | 0.61 |
| | If at least one agent chooses Reckless: +2, 0.88; −19, 0.1; −60
otherwise | −1.34 | | |
| Note. The notation x, p
means x with
probability p. For example, +2, 0.88; −19, 0.1; −60 otherwise
means the distribution +2 with probability .88, −19 with probability .1,
and −60 with probability .02. EV = expected value. |
| a In Condition Without-App of Exp.
2, one of the two choice options
(Reckless or Responsible) was duplicated such that participants had three
choice options to choose from on-screen. Choice rates displayed here are
the pooled choice rates of options that reflect the same payoff
distribution. |
Here, we investigate the potential of a policy designed to decrease the
prevalence of reckless behaviors while preserving people’s freedom of
choice, that is, to influence choice without significantly changing the
incentive structure (Thaler & Sunstein, 2008). Specifically, we keep the
payoff structure of both options from the original Reckless or Responsible
game unchanged, but provide an additional alternative, App-Use (Table 1).
The payoff scheme of App-Use reflects the idea that when users have a
green signal, their common experience from using the application is better
than the common experience from either of the other alternatives, as it
saves time and/or effort. However, a red signal leads to a large loss
(perhaps reflecting restricted access or entering quarantine), and the
application does not eliminate the risk of infection when others behave
recklessly. Consequently, App-Use is never the best option on average.
Specifically, the payoff structure of Responsible has second-order
stochastic dominance over that of App-Use (Hadar & Russell, 1969),
meaning the cumulative distribution function (CDF) of App-Use is never
under the CDF of Responsible. In practice, this means that for each set of
choices of other players, App-Use has a lower mean and is more uncertain
(riskier) than Responsible. This implies that any risk-averse
utility-maximizing agent would prefer Responsible over App-Use (Rothschild
& Stiglitz, 1970). Hence, in equilibrium, App-Use should never be
selected by risk averse agents. In this sense, App-Use is an irrelevant
alternative and its addition should not change the prevalence of reckless
behavior (or, should change it only to the degree that the population
consists of many risk loving agents). Nevertheless, we hypothesized that
because participants will be more sensitive to the common experiences,
they will use the application frequently and the Reckless rates will be
considerably diminished.
2 Reliance on
small samples and alternative predictions
Before describing the experiments and the results, it is worthwhile to
mention the theoretical underpinnings of our predictions, and several
alternative predictions. The prediction that people will be more sensitive
to the frequent experience and therefore will tend to choose App-Use on
account of Reckless is rooted in the notion that people tend to rely on
small samples of past experiences (Barron & Erev, 2003; Fiedler et al.,
2000; Hertwig & Pleskac, 2010; Kareev et al., 1997; Plonsky et al.,
2015). Because the probability that rare events will be included in small
samples is smaller than their objective probability, reliance on small
samples leads to over-reliance on frequent outcomes. There are many
reasons to believe people tend to rely on small samples. Reliance on small
samples can be the result of cognitive limitations (Fiedler, 2000; Kareev,
2000) and can also be the result of a sophisticated attempt to provide a
near optimal response under the assumption that there are patterns in the
environment (Plonsky et al., 2015). Moreover, reliance on small samples
was the one major common assumption of the best performing models in a
series of choice prediction competitions for repeated choice, including
competitions to predict choice when decisions makers can rely both on
complete verbal description of the choice task and on feedback from
previous choices, as is the case in our games (Erev et al., 2017; Erev,
Ert & Roth, 2010; Erev, Ert, Roth, et al., 2010; Plonsky et al., 2019).
Although our game setting adds complexity, we believe that simple models of
reliance on small samples that ignore this complexity can still provide
useful predictions of behavior in this setting (Roth et al., 2020). In the
supplement, we describe one such simple model and derive
its
predictions for the current setting (to foreshadow our results, this
simple model is surprisingly accurate).
The predictions of at least two prominent classes of models stand in stark
contrast to those of reliance on small samples. First, according to
prospect theory (Kahneman & Tversky, 1979; Tversky & Kahneman, 1992),
rare events tend to be overweighted. Hence, relative to the
stochastically-dominant option Responsible, the attractiveness of the
stochastically dominated option App-Use, which includes a low-probability
loss of −19, is predicted to be even lower than it objectively is. It
follows that, according to prospect theory, the addition of App-Use should
not influence the choice rate of the other two options and there should be
no difference between the two conditions in our experiment. Yet, while
cumulative prospect theory has been shown to describe risky choice behavior
well in some cases (e.g., Glöckner et al., 2016; Glöckner & Pachur, 2012),
it has been less successful when tasks were somewhat more complex (e.g.,
Payne, 2005; Sonsino et al., in press) and when decision makers received
feedback on previous similar choices (e.g., Cohen et al., 2020; Erev et
al., 2017).
A second class of models that would predict negligible differences between
the two conditions in our experiment are belief-based models of choice in
games, and particularly the popular “levels of reasoning” models (e.g.,
Camerer et al., 2004; Nagel, 1995; Stahl & Wilson, 1995). These models
assume that decision makers form beliefs concerning the likely actions of
other agents and then play best-response to these actions. In most of these
models, best-response is assumed to be the strategy that maximizes the
expected utility of the decision maker. As explained above, unless the
decision maker is risk seeking, expected utility maximization will never
predict choice of App-Use over Responsible. Hence, according to such
models, App-Use will not be frequently selected and surely not more
frequently than Responsible.2
3 Experiment 1
We compared choice behavior in the two games from Table 1. Condition
Without-App was originally run as part of another study (Roth et al.,
2020) and is reanalyzed here. Condition With-App was preregistered
(https://aspredicted.org/tz6vr.pdf) and run a month later. It is
analyzed
here for the first time.3
3.1 Method
3.1.1 Structure of the games
The games in this experiment (Table 1) are context-free and abstract. As
explained above, this provides the opportunity to investigate behavior
while keeping many factors that could influence decisions in a pandemic
(political ideology, risk perception etc.) fixed. The game features (the
values of the payoffs and their probabilities) we use are not meant as an
exact representation of the real-life consequences of behavior in
pandemic-related decisions. Rather, they are used as rough relative
representations of the main outcomes. Yet, while there is little meaning
to the exact values chosen to be used in the games, the conceptual
structure of the different distributions of possible payoffs aims to
capture several basic assumptions concerning the outcomes people
experience when making choices concerning their behavior in a pandemic.
This sub-section details these assumptions and explains our choice of game
parameters.
First, we assume that responsible behavior (e.g., properly wearing a
face-and-nose mask or avoiding crowded spaces) is mildly inconvenient and
thus carries a small cost in comparison with the more reckless behavior.
Therefore, the frequent outcome from choice of Responsible (0) is slightly
lower than the frequent outcome from choice of Reckless (+1). Second, we
assume that in a small proportion of the time, reckless behavior may lead
to dire events with very high costs (a natural example is getting infected
and turning ill; other examples are being forced to quarantine after
contacting someone who turns out to be infected or unintentionally
transmitting the virus to others). Thus, with small probability (2%),
choice of Reckless leads to a large negative payoff (−60). Third, we
assume
that due to the nature of the pandemic, people who behave responsibly
cannot protect themselves if others around them behave recklessly. Hence,
choice of Responsible may (with small probability) also lead to very large
negative payoff (−60) if another agent chooses Reckless. Fourth, we
assume
that using a health-signal application does not protect the user from the
consequences of other reckless agents. Therefore, choosing App-Use also
leads (with 2% chance) to very large negative payoff (−60) if another
agent chooses Reckless. Fifth, we assume that a green code on a
health-signal application provides a small benefit that outweighs the small
costs of responsible behavior (relative to reckless behavior). Therefore,
the frequent outcome from choosing App-Use (+2) is slightly higher than the
frequent outcome from choosing Reckless (+1). Finally, we assume that a red
code on a health signal application is relatively rare because those who
choose to use it usually behave responsibly (had they been frequently
reckless, their color code would have been frequently red thus invalidating
the advantage of using the app), and that a red code carries a relatively
large cost (but not as large as getting infected or similar dire
events). Thus, in relatively rare cases (10% of the time), choosing
App-Use provides a medium-size loss (−19).
3.1.2 Procedure and design
The experiment was a 4-person repeated game programmed using OTree (Chen et
al., 2016). Participants were first briefed and read the instructions,
which included a complete description of the payoff structure and an
attention check4 (see the
supplement for complete instructions). The instructions
also stated that the more points participants accumulate, the higher their
chances of winning a bonus payment at the end of the experiment (see
below).
After agreeing to participate, participants usually had to wait several
minutes until four consenting participants were available to form a group.
When a group formed, participants completed demographics data and proceeded
to face a choice between the two (Condition Without-App) or three
(Condition With-App) options presented in Table 1 for 60 rounds. Following
each choice, participants received feedback concerning both their obtained
and forgone payoff(s) in that round (see Figures S1-S2 in the
supplement for screenshots).
The group advanced to the next round only after all its members submitted a
choice. To guarantee that the experiment advanced smoothly, participants
had to
submit a choice within 10 seconds (20 seconds in the first 3 rounds).
Participants knew that if they failed to submit a choice in time, their
payoff in the round would be reduced by 2 points, and the system would
auto-submit a choice for them. Unbeknownst to participants,
auto-submissions repeated the choice the participants made in the previous
trial (except in the first round when a Responsible choice was
auto-submitted). In addition, participants knew that if they “make most of
the choices on their own”, they will get an additional $1
bonus.5 Hence, participants were incentivized to make an active
choice both in each trial and across all trials.
The total number of points participants accumulated in the 60 rounds were
converted to a probability to win an additional $1 bonus.6
3.1.3 Participants
Participants were MTurk workers who were compensated $1. Additional
bonuses were provided as explained in the Procedure section. We analyzed
the data of 48 participants (12 groups, 18 female,
Mage = 41) in Condition Without-App and 68
participants (17 groups, 25 female, 31 male, Mage
= 47) in Condition With-App. We preregistered that after data exclusions,
Condition With-App should include at least 12 groups. To guarantee
sufficient exposure of the study on the platform (so the study runs
smoothly), each session included several groups and the final group number
was higher.
As preregistered, we excluded all groups in which more than 20% of the
group choices were auto-submitted (9 groups in Without-App and 8 groups in
With-App). In nearly every instance, such high auto-submission rate
reflected a case in which participants failed to make more than a single
choice (likely due to server or computer errors). Using a different cutoff
for exclusion (e.g., more than 5% auto-submissions) does not meaningfully
affect the results. We also discarded one group in Condition With-App that
mistakenly included a participant who participated in the other condition.
3.2 Results and discussion
We analyze only rounds in which participants actively submitted a choice
(i.e., not including auto-submissions).7 Table
1 shows the mean aggregate choice rates for each option in each condition.
As preregistered, the main variable of interest was the mean group choice
rate of the Reckless option (hereafter Reckless-rate), reflecting how often
participants choose the option corresponding with the dangerous and
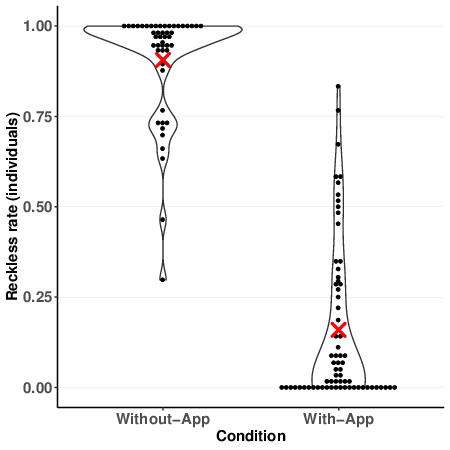
inefficient equilibrium. The Reckless-rate was 90.6% (SD = 8.0)
in Condition Without-App and 15.9% (SD = 9.3) in Condition
With-App. This difference (Mdiff = 74.7%, 95%
CI [68.0, 81.3]) is significant at any significance level, t(25.9)
= −23.1 (one-sided t-test), d = −8.5, 95% CI [−6.1,
−10.9], reflecting, as predicted, a major decrease in choice of the
Reckless alternative when App-Use is available.8
Notably, the Reckless-rates in Condition Without-App were all above 75%,
suggesting every group tended to converge to the inefficient equilibrium.
Conversely, in Condition With-App, Reckless-rates were all below 31%,
suggesting no group converged to this dangerous equilibrium. Figure 1a
shows the proportion of Reckless choices for individual participants by
condition. It highlights that the (group) Reckless-rates reported above
reflect the individual Reckless choices well. Specifically, in Condition
Without-App nearly all participants chose Reckless very often whereas in
Condition With-App most participants chose Reckless only rarely.9
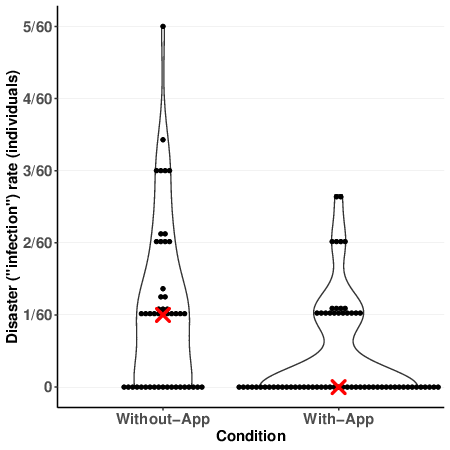
Because in Condition With-App many participants avoided the reckless
option, they also experienced fewer “disasters” (i.e., they obtained fewer
losses of 60 points abstracting, e.g., an infection) than in Condition
Without-App. The mean group disaster rate was a highly skewed variable for
which the assumption of normality was rejected by a Shapiro-Wilk test
(p = 0.012). Hence, we compared the distributions of group
disaster rates using Wilcoxon Rank Sum test. The medians for conditions
Without-App and With-App were 1.48% (IQR = [1.19, 2.43]) and 0.83% (IQR
= [0, 1.25]) respectively, a significant difference (p = .003,
effect size r = 0.52, one sided test). Figure 1b shows that the
individual disaster rates reflect the group disaster rates well.
| (a) | | (b) |
 | | 
|
| Figure 1: Individual choice rates and individual disaster rates in
Experiment 1. The two games (“Without-App” and “With-App”) are shown in
Table 1. (a) Violin and dot plots of the individual Reckless rates with
and without the application option. The red X marks the mean group
Reckless rate. Dots are binned to nearest 0.01 (b) Violin and dot plots
of the individual disaster rates (loss of 60) with and without the
application option. The red X marks the median disaster rate in each
condition. Dots are binned to nearest 0.001. The disaster rates are the
proportion of disasters out of the total number of trials in which
participants made a choice on their own (did not auto-submit) and so the
rates sometimes do not divide exactly by 60 (the number of trials). |
We further made an unplanned analysis comparing the group Responsible-rates
between conditions. These rates were 9.4% (SD = 8) and 22.8%
(SD = 10.1) in conditions Without-App and With-App respectively,
revealing an unexpected significant difference (t(26.6) = 3.99,
p < .001 two tailed, d = 1.44, 95% CI [0.58,
2.31]). This may be explained by the existence of participants who chose
to be responsible (in either condition) as long as other participants in
their group were not Reckless. Because only few people chose Reckless in
Condition With-App (most chose App-Use), such participants could then
safely choose to be Responsible, thus increasing the Responsible-rate in
this condition.
Qualitatively, there were little effects of learning within the task. The
main changes within games were a decrease in Responsible behavior and an
increase in Reckless behavior. In Condition Without-App, experience
increased choice of Reckless behavior from an average of 85.4% in the
first 10 rounds of the game to an average of 93.4% in the last 10 rounds
of the game. In Condition With-App, the increase was more modest, from an
average of 13.5% in the first 10 rounds to an average of 17.6% in the
last 10 rounds. This latter increase resulted from a decrease in
Responsible choices (from 25.3% in the first 10 to 19.8% in the last 10
rounds), whereas the choice rate of the stochastically dominated action,
App-Use, changed very little throughout the game. The full learning curves
are provided in Figure S3 in the supplement.
Note that, for simplicity, we chose the parameters of App-Use to
reflect a suboptimal design for a health signal application: Participants
could not condition their choices on the signals. Users experiencing a
“red code” could not avoid the utility loss it entailed (i.e., they could
not condition their choice on their own signal). This property of the
payoff function can reflect, for example, an application that automatically
notifies the authorities when a user
receives a red code. An app that generates a completely private signal
would likely be even more attractive. Moreover, participants could not
choose
to avoid contact with participants that could present a a green
code, a strategy that reduces the risk of infections and increases further
the
incentive to use the application. Despite these suboptimal design choices,
most people chose App-Use. Nevertheless, one may argue that our results
are driven by other experimental design choices we made. Experiment 2 was
designed to test this claim.
4 Experiment 2
To increase our confidence that the results of Experiment 1 were not due to
an immaterial design choice we made, we designed and pre-registered
(https://aspredicted.org/i4bm7.pdf) a conceptual replication with the
following changes. First, we increased the time limit for each choice
(before an auto-submission is made) from 10 to 30 seconds. This increased
our confidence that choices were deliberate and thoughtful. Consequently,
and to keep the maximal length of the experiment fixed, we reduced the
number of rounds from 60 to 20. Second, Condition Without-App also
consisted of three rather than two alternatives, with the added third
alternative a duplicate of one of the original ones (Responsible or
Reckless). All groups in a session (and all members of each of those
groups) got the same duplicated alternative. This change allows for a safer
comparison of the choice rates in the With-App and the Without-App
conditions, since they each now included the same number of alternatives.
Finally, we added an attention check at the end of the 20 rounds in which
participants were shown a screen with five options and were told the payoff
each option was going to generate in the next round (with certainty). Then,
they were asked to choose one of these options.10
4.1 Method
4.1.1 Participants
After exclusions, we analyzed data of 116 participants in Condition
Without-App and of 80 participants (20 groups, 30 female, 41 male,
Mage = 35.5) in Condition With-App.11 Among those in the With-App
condition, 48 participants (12 groups, 11 female, 29 male,
Mage = 35.7) had two identical Responsible
buttons and 68 participants (17 groups, 24 female, 34 male,
Mage = 35.4) had two identical Reckless buttons.
We planned (and pre-registered) somewhat smaller sample sizes,
particularly for Condition With-App with two Reckless alternatives, but
ended up with these sample sizes due to an error and the need to run
multiple groups in parallel for the session to run smoothly on MTurk.
Restricting the analysis to the sample sizes stated in the
pre-registration does not change the results in any way.
4.1.2 Procedure
The procedure was identical to that in Experiment 1, with the changes
listed above.
4.2 Results
We first discuss the difference between conditions, when pooling the two
sub-groups of the Without-App condition, that is, regardless of which
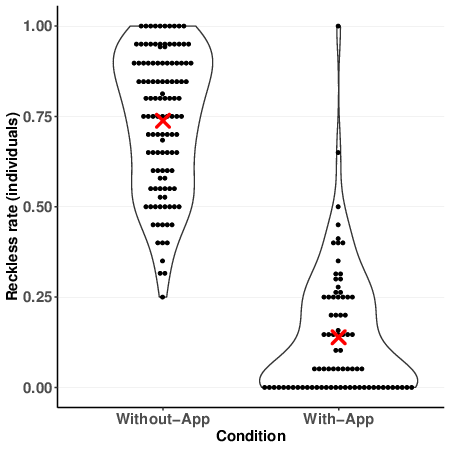
option was duplicated. As shown on the right-hand column in Table 1, in
condition Without-App, the Reckless-rate was 73.8% (SD = 9.0),
whereas in Condition With-App it was only 13.9% (SD = 9.3). This
difference (Mdiff = 59.9%, 95% CI [54.5, 65.3])
is highly significant (t(39.9) = −22.4 one-sided,
d = −6.56, 95% CI [−5.1, −8.0]), reflecting, as predicted,
a
major decrease in choice of the Reckless alternative when App-Use is
available, even when Condition Without-App includes three choice options
and participants have plenty of time to make a choice.12
As in Experiment 1, the high reckless-rate in Condition Without-App and the
low Reckless-rate in Condition With-App reflected all groups in the
condition well. The lowest group Reckless-rate in condition Without-App was
59.4%, and the highest group reckless-rate in Condition With-app was 35%.
Figure 2a shows these rates also reflect the individual choice rates well:
In Condition Without-App most participants chose Reckless very often
whereas in Condition With-App most participants chose Reckless rarely.
| (a) | | (b) |
 | | 
|
| Figure 2: Individual reckless rates and individual expected disaster rates
in Experiment 2. The two games (“Without-App” and “With-App”) are shown
in Table 1. (a) Violin and dot plots of the individual Reckless rates
with and without the application option. The red X marks the mean group
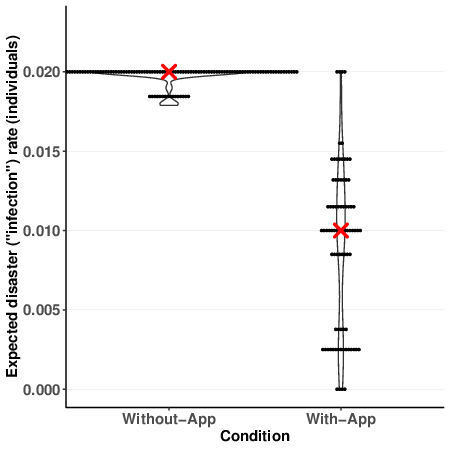
Reckless rate. Dots are binned to nearest 0.01 (b) Violin and dot plots
of the expected individual disaster rates with and without the
application option. The red X marks the median disaster rate in each
condition. Dots are binned to nearest 0.00125. |
Because in this experiment, each group played only 20 rounds, even if
participants chose Reckless in every round, their probability to
experience at least one disaster was only 1−(1−0.02)20 = 0.33. Hence,
comparing the experienced disaster-rates between conditions (as in
Experiment 1) is not a good measure for how safely groups were playing.
Instead, and as pre-registered, we compared the conditions’ expected
disaster-rates (the number of rounds in which at least one person in the
group played Reckless, multiplied by the probability for a disaster in such
case, 0.02). Again, because the Shapiro-Wilk test rejected the assumption
of
normality (p < .001), we used the Wilcoxon Rank Sum
test. The medians for conditions Without-App and With-App were 2.0% (IQR =
[2.0, 2.0]) and 1.0% (IQR = [0.38, 1.24]) respectively, a significant
difference (p < .001 one-sided, effect size r =
0.86). Figure 1b shows that the individual expected disaster rates reflect
the group expected disaster rates well. Note that in Condition
Without-App, rounds in which no person chose Reckless were extremely
uncommon, hence nearly all expected reckless-rates were exactly 2% (the
probability of disaster when at least one person chooses reckless).
The Responsible-rate in Condition With-App was 25.5% (SD = 15.6),
similar to that found in Experiment 1. Yet, the Responsible-rate in
Condition Without-App was 26.2% (SD = 9.0), which was much higher
than that found in Experiment 1. Hence, unlike in Experiment 1, in this
experiment, we did not observe a difference between Responsible rates in
the two conditions and it is unclear how robust that result is.
Moving to analysis of the two sub-groups in Condition Without-App, we found
relatively little differences. In the 12 groups that were presented with
two identical “responsible” options (and one reckless option), the mean
Reckless-rate was 70.5% (SD = 9.0), whereas in the 18 groups
that were presented with two identical “reckless” options (and one
responsible option), the mean Reckless rate was 76.1% (SD =
8.5). This difference is marginally significant (t(23) = 1.72,
p = .099). Hence, there may be some effect to providing
participants with “more opportunities” to choose Responsible, an effect
that can be explained by some random error that is uniformly distributed
among available options. Yet, even with two Responsible options and only
one Reckless option, the Reckless-rate is much greater than the
Reckless-rate in Condition With-App.
The most apparent effect of learning within-task emerged in the Without-App
condition in which the mean Reckless-rate increased from 59.8%
(SD = 15.7) in the first five trials to 79.7% (SD =
12.2) in the last five trials of the task. In contrast, in Condition
With-App there was very little learning effects over time. In particular,
the mean choice rate for App-Use was relatively stable (increased from 57%
in the first 5 trials to 61% in the last 5 trials), indicating that
participants did not learn to avoid the stochastically dominated action
with experience. Full detailed learning curves are given in Figure S4 in
the supplement.
5 General discussion
Compliance with physical distancing and similar guidelines is influenced by
many factors including political orientation (Painter & Qiu, 2020),
socio-economic status (Wright et al., 2020), and news consumption source
(Simonov et al., 2020). Yet, because compliance with guidelines consists of
many small repeated experience-based decisions, we believe that other
relevant factors include people’s basic decision making tendencies in
repeated decisions from experience.
Unlike description-based one-shot decisions without feedback, in which
prospect theory predicts people behave as if they overweight rare (low
probability) events, research on repeated decisions with feedback
has documented a robust tendency to behave as if rare events are
underweighted
(and common experiences are overweighted). Such bias was documented in
basic repeated decisions with partial (Barron & Erev, 2003), complete
(Camilleri & Newell, 2011), and biased feedback (Plonsky & Teodorescu,
2020), as well as in more complex settings of repeated choice like
two-stage decisions (Roth et al., 2016), investment decisions (Taleb,
2007), market entry games (Erev, Ert & Roth, 2010), and in animal choice
(Shafir et al., 2008). In a pandemic, underweighting rare events likely
implies reckless behaviors. Moreover, the problem is exacerbated by the
fact that reckless behaviors are “contagious”: they make it less attractive
for otherwise-careful people to behave responsibly (Erev et al., 2020).
But the same tendency that implies problematic behavior also gives rise to
a possible solution. If experiences that follow reckless behavior become
frequently worse than those that follow more responsible alternatives, we
can expect a dramatic reduction in reckless behavior. To do this in scale,
policymakers can give people the option to use voluntary health signal
applications designed to both discourage reckless behaviors and make
people’s lives simpler and more convenient. Our analysis suggests that, if
using the application frequently saves time and effort, it will get
significant traction, even if, because of infrequent poor experiences, on
average using the application is a bad idea.
A clear limitation of our design is that we use abstract experimental games
to parallel real-world behavior that is surely much more complex. Our
analysis does not prove that reckless behavior in a pandemic is driven by
high sensitivity to frequent outcomes. Yet, it does imply that such
a tendency may be a sufficient condition for the emergence of reckless
behavior. Therefore, even if policy makers would find ways to deal with
other factors that drive reckless behavior (social norms, biased
information, etc.), they may not be enough: policies may have to consider
people’s heavy reliance on the frequent outcomes of the possible
actions. Similarly, our analysis does not guarantee that changing the
incentive structure in the ways we propose will solve the behavioral
challenges in a pandemic. Yet, it raises a potential solution. In addition,
it may be unclear whether our proposed policy change can realistically map
to the real world. For example, can shorter wait times in queue really be
(slightly) more rewarding than the advantages of reckless behavior? To
increase our confidence that our experimental analysis may generalize to
the real world, we next describe a field demonstration of a policy that
takes into account people’s presumed sensitivity to frequent outcomes and
leads to compelling results.
5.1 Field demonstration
To demonstrate that this analysis is not purely theoretical or limited to
abstract games, we documented a policy change that took place in a nursing
home in Israel on the last quarter of 2020, amid the COVID-19 pandemic
(see details in the supplement.). The management of the
nursing home sought to get its
employees to use contact tracing applications while at work so that there
could be an accurate and swift epidemiological investigation and reaction
in case of an infection. Unfortunately, simply asking the employees to
voluntarily use such applications proved to be ineffective. After
observing that workers who enter to the nursing home at the beginning of a
shift form queues to get their temperature checked and answer a few
symptom questions, we advised the management to integrate an application
that automatically registered the users’ temperature and allowed them to
enter the nursing home faster with a much shorter queue. The management
chose to use Tamara®, a commercial contact tracing application. Figure 3
shows the number of employees who used this application from within the
nursing home over nine weeks: five weeks prior and four weeks after the
policy change. Before the policy change, and despite
repeated marketing efforts and appeals by the management aimed to increase
uptake, the average daily number of users was only 29.5 (SD = 30,
approximately 19% of employees). Yet, after the policy change that
implied users of the app save a few minutes when entering the nursing
home, the average daily number of users more than tripled, to 113.8
(SD = 17.3, approximately 74% of employees). Moreover, the
number of active users after the change remained relatively stable over
time.
Notably, these numbers likely reflect a lower bound on the rate of
employees that would have desired to use the app because the app was
incompatible with some types of phones (e.g., some nursing home employees
do not use smartphones for religious reasons).
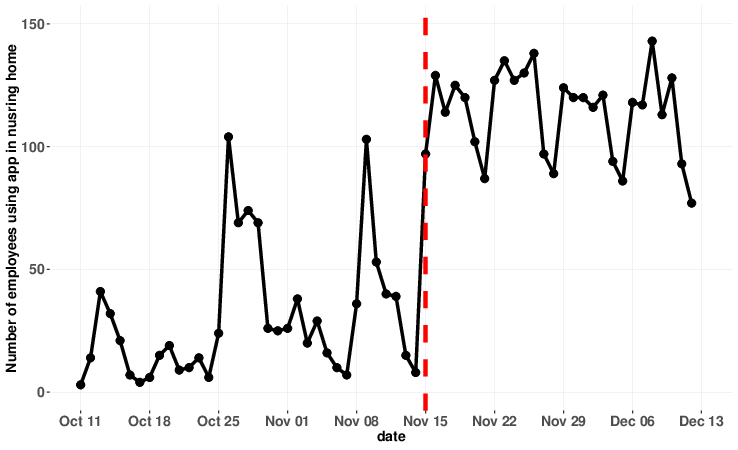
| Figure 3: Nursing home employee users of a contact
tracing application across time. The red dashed line marks the day of
change in entrance policies to the nursing home such that using the app
saved employees a few minutes each day. |
For unknown reasons, prior to the policy change, there were two days in
which there was a significant increase in usage rates (see Figure 3). These
may be due to a local initiative by a worker or a security guard that
asked arriving employees to download and use the app on these days.
Importantly, these increases, unlike the increase in usage after the
policy change, did not persist over time. Note also that regardless of
their reasons, these increases suggest that many employees had installed
the application prior to the policy change, which implies that the main
effect of this change was on the usage rate — a daily repeated
decision—rather than on the installation rate — a one-shot decision.
Although contact tracing applications are different from health code
applications described earlier in this paper, the implicit decision task
faced by the employees in the nursing home is similar to that faced by
participants in our experiments. In both cases, the decisions that imply
safer behavior were highly sensitive to the frequent experience. Another
example of the importance of the frequent experience comes from the
difference between the application Tamara, endorsed by the management of
the nursing home, and the application HaMagen, that the management of the
nursing home initially asked employees to install and use. HaMagen is
Israel’s national contact tracing application that was available for use
since early in the pandemic. Unlike Tamara, the contact data of HaMagen
never transfers to an external server (it is strictly the users’ choice
whether the data can be used for an epidemiological investigation). Hence,
choosing HaMagen over Tamara arguably may lead to better outcomes on
average. Yet, after trying it for a short period, it was revealed that
HaMagen consumes more battery power and has a high false alarm rate, hence
the
employees’ frequent experience from using it was bad. In contrast, adding
Tamara to the employees’ choice set, alongside the policy change, provided
employees with a responsible alternative with frequent positive
experiences.
5.2 Theoretical and
wider practical implications
The observation that in our experiments App-Use is chosen far more than the
other alternatives, and particularly more than Responsible that
stochastically dominates it, is consistent with the idea that people
behave as if they underweight rare events. To our knowledge, this is the
first demonstration of such a pattern in fully described social games. Of
course, we demonstrated this pattern in only a single game, and there could
be other explanations for the observed behavior. For example, behavior is
also consistent with choice of the option with the highest positive
outcome. Future research should investigate how robust this tendency is in
games, and examine alternative explanations. Nevertheless, considering the
fact that underweighting of rare events in repeated choice settings is a
highly robust phenomenon and considering the success of models of reliance
on small samples (which imply underweighting of rare events) in describing
and predicting behavior in such settings, we feel the observed pattern of
results is likely a reflection of underweighting of rare events. As a
result, we also believe that the pattern will hold under small changes in
the values of game features, as long as the general structure of the
payoff distributions is similar to those we consider here. Indeed, in the
supplement, we demonstrate that as long as App-Use remains
frequently better than other alternatives, the predictions of the naïve
sampler model are very robust to changes in the payoff structure.
If indeed people behave as if they underweight rare events in similar games
and our results are robust, this finding is theoretically important for
several reasons. First, it has been suggested that in completely described
social games people may put more focus on getting to fair and efficient
outcomes, but when they have to learn the games from experience, this
focus will be diminished (Erev & Haruvy, 2016; Hertwig & Erev, 2009).
Our results show that the effects of experience trumps those of description
when both information prompts are available in social games, consistent
with findings from individual decisions from experience (Erev et al.,
2017; Jessup et al., 2008; Lejarraga & Gonzalez, 2011; Weiss-Cohen et
al., 2016; Yechiam et al., 2005).
Second, the commonplace analysis of behavior in games focuses on the
expected outcomes (or utilities) choice profiles generate. For example,
entries in cells of normal-form games almost always include at most a
single number per player (e.g., Camerer, 2011). Our study adds to the
small literature demonstrating that this practice can mask important
regularities
and highlighting the importance of considering the distribution of
potential payoffs rather than their expected values/utilities (Avrahami et
al., 2005; Bereby-Meyer & Roth, 2006; Budescu et al., 1990; Kunreuther et
al., 2009; Levati et al., 2009; Rapoport et al., 1992; Schulze & Newell,
2015).
Finally, many models of behavior in games assume that people make the best
response to the beliefs they have concerning the strategies of other people
(Brown, 1951; Camerer et al., 2004; Stahl & Wilson, 1995). Such models
cannot predict a preference for stochastically dominated options which are
never a best response from a normative standpoint. Other mainstream models
of behavior in games that assume some form of reinforcement learning
(Camerer & Hogarth, 1999; Erev & Roth, 1998; Fudenberg & Levine, 1998)
may sometimes predict choice of stochastically dominant options, but are
very unlikely to predict underweighting of rare events on the long
term.13 In contrast, models that assume
reliance on small samples with underweighting of rare events may better
capture behavior in many games (Erev, Ert & Roth, 2010). Future research
should examine the likely properties of such models and how they differ
from models that assume reliance on small samples to capture individual
behavior.
From a practical perspective, the observation that people tend to choose
options that are better most of the time can facilitate development of
solutions to many other social issues. For example, we can use similar
ideas to promote vaccinations for SARS-CoV-2. Those who get vaccinated can
receive a certificate that will act similarly to the “green code” on a
health signal application discussed above. That is, while both people with
and without the certificate will be able to access public facilities and
workplaces, not carrying a certificate will incur a small cost in time and
effort. While this cost may not get all people to vaccinate (particularly
those
high on vaccine hesitancy), we predict that the small frequently
experienced costs will help increase vaccine uptake among most people.
Another example for the possible use of these ideas in a different domain
concerns food waste. To reduce food waste, it is desirable to get people
to purchase smaller quantities of food that has short expiration dates.
One way to do so is to promote purchase of smaller bundles or product
batches: If one buys only two yogurts rather than a bundle of eight,
there’s a better chance the yogurts are consumed by their expiration date.
It is sensible to assume people prefer large bundles and batches to avoid
having products run out. Yet, our analysis suggests that as long as these
experiences would be sufficiently infrequent, making the purchase of
smaller bundles better most of the time (e.g., by providing
subsidies/lowering taxes or by providing consumers who buy them designated
queues) would get many to people to choose buying them.
References
Avrahami, J., Güth, W., & Kareev, Y. (2005). Games of competition in a
stochastic environment. Theory and Decision, 59(4),
255–294.
Barak, O., Gavish, N., Hari, L. P., & Shohat, T. (2020). Simulator
of interventions for COVID-19.
https://applied-math.technion.ac.il/files/2020/06/Covid_simulator.pdf.
Barron, G., & Erev, I. (2003). Small feedback-based decisions and their
limited correspondence to description-based decisions. Journal of
Behavioral Decision Making, 16(3), 215–233.
Bereby-Meyer, Y., & Roth, A. E. (2006). The speed of learning in noisy
games: Partial reinforcement and the sustainability of cooperation.
American Economic Review, 96(4), 1029–1042.
Brown, G. (1951). Iterative solution of games by fictitious play. In T. C.
Koopmans (Ed.)
Activity analysis of production and allocation. John Wiley &
Sons.
Budescu, D. V, Rapoport, A., & Suleiman, R. (1990). Resource dilemmas with
environmental uncertainty and asymmetric players. European Journal
of Social Psychology, 20(6), 475–487.
Camerer, C. F. (2011). Behavioral game theory: Experiments in
strategic interaction. Princeton University Press.
Camerer, C. F., Ho, T.-H., & Chong, J.-K. (2004). A cognitive hierarchy
model of games. The Quarterly Journal of Economics,
119(3), 861–898.
Camerer, C. F., & Hogarth, R. (1999). The effects of financial incentives
in experiments: A review and capital-labor-production framework.
Journal of Risk and Uncertainty, 19(1–3), 7–42.
Camilleri, A. R., & Newell, B. R. (2011). When and why rare events are
underweighted: A direct comparison of the sampling, partial feedback, full
feedback and description choice paradigms. Psychonomic Bulletin and
Review, 18(2), 377–384.
Chen, D. L., Schonger, M., & Wickens, C. (2016). oTree — An open-source
platform for laboratory, online, and field experiments. Journal of
Behavioral and Experimental Finance, 9, 88–97.
Cohen, D., Plonsky, O., & Erev, I. (2020). On the impact of experience on
probability weighting in decisions under risk. Decision,
7(2), 153–162.
Erev, I., Ert, E., Plonsky, O., Cohen, D., & Cohen, O. (2017). From
anomalies to forecasts: Toward a descriptive model of decisions under
risk, under ambiguity, and from experience. Psychological Review,
124(4), 369–409. https://doi.org/10.1037/rev0000062.
Erev, I., Ert, E., & Roth, A. E. (2010). A choice prediction competition
for market entry games: An introduction. Games, 1(2),
117–136. https://doi.org/10.3390/g1020117.
Erev, I., Ert, E., Roth, A. E., Haruvy, E., Herzog, S. M., Hau, R.,
Hertwig, R., Stewart, T., West, R., & Lebiere, C. (2010). A choice
prediction competition: Choices from experience and from description.
Journal of Behavioral Decision Making, 23(1), 15–47.
https://doi.org/10.1002/bdm.683.
Erev, I., & Haruvy, E. (2016). Learning and the economics of small
decisions. In J. H. Kagel & A. E. Roth (Eds.) The handbook of
experimental economics (Vol. 2, pp.
638–716). Princeton University Press.
Erev, I., Plonsky, O., & Roth, Y. (2020). Complacency, panic, and the
value of gentle rule enforcement in addressing pandemics. Nature
Human Behavior, 4, 1095–1097.
https://doi.org/10.1038/s41562-020-00939-z.
Erev, I., & Roth, A. E. (1998). Predicting how people play games:
Reinforcement learning in experimental games with unique, mixed strategy
equilibria. American Economic Review, 88(4), 848–881.
Erev, I., & Roth, A. E. (2014). Maximization, learning, and economic
behavior. Proceedings of the National Academy of Sciences,
111(Supplement 3), 10818–10825.
Fiedler, K. (2000). Beware of samples! A cognitive-ecological sampling
approach to judgment biases. Psychological Review,
107(4), 659–676. https://doi.org/10.1037//0033-
295X.107A659.
Fiedler, K., Brinkmann, B., Betsch, T., & Wild, B. (2000). A sampling
approach to biases in conditional probability judgments: Beyond base rate
neglect and statistical format. Journal of Experimental
Psychology: General, 129(3), 399.
Fudenberg, D., & Levine, D. K. (1998). The theory of learning in
games (Vol. 2). MIT press.
Glöckner, A., Dorrough, A. R., Wingen, T., & Dohle, S. (2020). The
Perception of infection risks during the early and later outbreak of
COVID-19 in Germany: consequences and recommendations. PsyArXiv.
https://doi.org/10.31234/osf.io/wdbgc.
Glöckner, A., Hilbig, B. E., Henninger, F., & Fiedler, S. (2016). The
reversed description-experience gap: Disentangling sources of presentation
format effects in risky choice. Journal of Experimental
Psychology: General, 145(4), 486–508.
Glöckner, A., & Pachur, T. (2012). Cognitive models of risky choice:
Parameter stability and predictive accuracy of prospect theory.
Cognition, 123(1), 21–32.
Hadar, J., & Russell, W. R. (1969). Rules for ordering uncertain
prospects. The American Economic Review, 59(1), 25–34.
Hertwig, R., Barron, G., Weber, E., & Erev, I. (2004). Decisions from
experience and the effect of rare events in risky choice.
Psychological Science, 15(8), 534–539.
https://doi.org/10.1111/j.0956-7976.2004.00715.x.
Hertwig, R., & Erev, I. (2009). The description–experience gap in risky
choice. Trends in Cognitive Sciences, 13(12), 517–523.
https://doi.org/10.1016/j.tics.2009.09.004.
Hertwig, R., & Pleskac, T. J. (2010). Decisions from experience: Why small
samples? Cognition, 115(2), 225–237.
https://doi.org/10.1016/j.cognition.2009.12.009.[[[
Jessup, R. K., Bishara, A. J., & Busemeyer, J. R. (2008). Feedback
produces divergence from prospect theory in descriptive choice.
Psychological Science, 19(10), 1015–1022.
https://doi.org/10.1111/j.1467-9280.2008.02193.x.
Kahneman, D., & Tversky, A. (1979). Prospect theory: An analysis of
decision under risk. Econometrica, 47(2), 263–292.
Kareev, Y. (2000). Seven (indeed, plus or minus two) and the detection of
correlations. Psychological Review, 107(2), 397–402.
https://doi.org/10.1037/TO33-295X.107.2.397.
Kareev, Y., Lieberman, I., & Lev, M. (1997). Through a narrow window:
Sample size and the perception of correlation. Journal of
Experimental Psychology: General, 126(3), 278–287.
Kunreuther, H., Silvasi, G., Bradlow, E., & Small, D. (2009). Bayesian
analysis of deterministic and stochastic prisoner’s dilemma games.
Judgment and Decision Making, 4(5), 363.
Lejarraga, T., & Gonzalez, C. (2011). Effects of feedback and complexity
on repeated decisions from description. Organizational Behavior
and Human Decision Processes, 116(2), 286–295.
https://doi.org/10.1016/j.obhdp.2011.05.001.
Levati, M. V., Morone, A., & Fiore, A. (2009). Voluntary contributions
with imperfect information: An experimental study. Public Choice,
138(1–2), 199–216.
Nagel, R. (1995). Unraveling in guessing games: An experimental study.
The American Economic Review, 85(5), 1313–1326.
Painter, M., & Qiu, T. (2020). Political beliefs affect compliance
with
covid-19 social distancing orders. SSRN.
https://ssrn.com/abstract=3569098.
Payne, J. W. (2005). It is whether you win or lose: The importance of the
overall probabilities of winning or losing in risky choice.
Journal of Risk and Uncertainty, 30(1), 5–19.
https://doi.org/10.1007/s11166-005-5831-x.
Plonsky, O., Apel, R., Ert, E., Tennenholtz, M., Bourgin, D., Peterson, J.
C., Reichman, D., Griffiths, T. L., Russell, S. J., Carter, E. C.,
Cavanagh, J. F., & Erev, I. (2019). Predicting human decisions with
behavioral theories and machine learning. ArXiv Preprint
ArXiv:1904.06866.
Plonsky, O., & Erev, I. (2017). Learning in settings with partial feedback
and the wavy recency effect of rare events. Cognitive Psychology,
93, 18–43. https://doi.org/10.1016/j.cogpsych.2017.01.002.
Plonsky, O., & Teodorescu, K. (2020). The influence of biased exposure to
forgone outcomes. Journal of Behavioral Decision Making,
33, 393–407.
Plonsky, O., Teodorescu, K., & Erev, I. (2015). Reliance on small samples,
the wavy recency effect, and similarity-based learning.
Psychological Review, 122(4), 621–647.
Rapoport, A., Budescu, D. V, Suleiman, R., & Weg, E. (1992). Social
dilemmas with uniformly distributed resources. In W. B. G. Liebrand, D. M.
Messick, & H. A. M. Wilke (Eds.), Social dilemmas. Theoretical
issues and research findings (pp. 43–58). Pergamon Press.
Roth, A. E., & Malouf, M. W. (1979). Game-theoretic models and the role of
information in bargaining. Psychological Review, 86(6),
574–594.
Roth, Y., Plonsky, O., Shalev, E., & Erev, I. (2020). On the value of
alert systems and gentle rule enforcement in addressing pandemics.
Frontiers in Psychology, 11, 3252.
https://doi.org/10.31219/osf.io/zrx32.
Roth, Y., Wänke, M., & Erev, I. (2016). Click or skip: The role of
experience in easy-click checking decisions. Journal of Consumer
Research, 43(4), 583–597.
Rothschild, M., & Stiglitz, J. E. (1970). Increasing risk: I. A
definition. Journal of Economic Theory, 2(3), 225–243.
Schulze, C., & Newell, B. R. (2015). Compete, coordinate, and cooperate:
How to exploit uncertain environments with social interaction.
Journal of Experimental Psychology: General, 144(5),
967.
Shafir, S., Reich, T., Tsur, E., Erev, I., & Lotem, A. (2008). Perceptual
accuracy and conflicting effects of certainty on risk-taking behaviour.
Nature, 453(7197), 917–920.
https://doi.org/10.1038/nature06841.
Simonov, A., Sacher, S. K., Dubé, J.-P. H., & Biswas, S. (2020).
The persuasive effect of fox news: non-compliance with social
distancing during the covid-19 pandemic. National Bureau of Economic
Research. https://www.nber.org/papers/w27237.
Sonsino, D., Lahav, Y., & Roth, Y. (in press). Reaching for Returns in
Retail Structured Investment. Management Science.
Stahl, D. O., & Wilson, P. W. (1995). On players’ models of other
players: Theory and experimental evidence. Games and Economic
Behavior, 10(1), 218–254.
Taleb, N. (2007). Black swans and the domains of statistics. The
American Statistician, 61(3), 198–200.
https://doi.org/10.1198/000313007X219996.
Thaler, R. H., & Sunstein, C. R. (2008). Nudge: Improving
decisions about health, wealth, and happiness. Penguin.
Tversky, A., & Kahneman, D. (1992). Advances in prospect theory:
Cumulative representation of uncertainty. Journal of Risk and
Uncertainty, 5(4), 297–323.
https://doi.org/10.1007/BF00122574.
Weinland, D. (2020, May). China’s Covid-19 QR code surveillance state.
Financial Times.
https://www.ft.com/content/eee43c3e-8f7c-11ea-9b25-c36e3584cda8.
Weiss-Cohen, L., Konstantinidis, E., Speekenbrink, M., & Harvey, N.
(2016). Incorporating conflicting descriptions into decisions from
experience. Organizational Behavior and Human Decision Processes,
135, 55–69.
Wright, A. L., Sonin, K., Driscoll, J., & Wilson, J. (2020). Poverty and
economic dislocation reduce compliance with covid-19 shelter-in-place
protocols. University of Chicago, Becker Friedman Institute for
Economics Working Paper, 2020–40.
https://ssrn.com/abstract=3573637
Wulff, D. U., Mergenthaler-Canseco, M., & Hertwig, R. (2018). A
meta-analytic review of two modes of learning and the
description-experience gap. Psychological Bulletin,
144(2), 140–176.
Yechiam, E., Barron, G., & Erev, I. (2005). The role of personal
experience in contributing to different patterns of response to rare
terrorist attacks. Journal of Conflict Resolution,
49(3), 430–439. https://doi.org/10.1177/0022002704270847.
Yechiam, E., Erev, I., & Barron, G. (2006). The effect of experience on
using a safety device. Safety Science, 44(6), 515–522.
Zohar, D., & Erev, I. (2007). On the difficulty of promoting workers’
safety behaviour: overcoming the underweighting of routine risks.
International Journal of Risk Assessment and Management,
7(2), 122–136.
This document was translated from LATEX by
HEVEA.