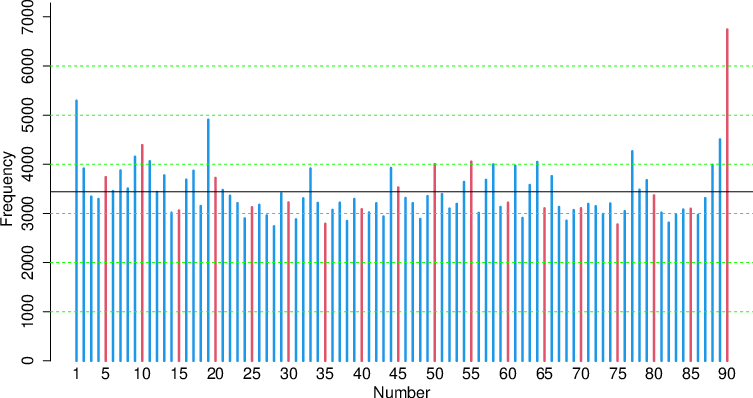
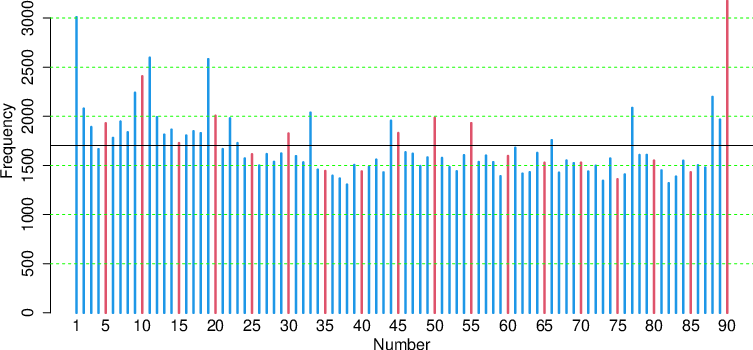
| Figure 1: Number frequencies of the National game (top) and Bazooka game (bottom). The horizontal black lines are the mean. |
Judgment and Decision Making, Vol. 16, No. 4, July 2021, pp. 1060-1071
Number preferences in selected Nigerian lottery gamesOluwaseun A. Otekunrin* Adesola G. Folorunso# Kehinde O. Alawode$ |
Abstract: In this paper, we examined two pairs of datasets from selected Nigerian lottery games to determine players’ number preferences. Data explorations were conducted in the first pair of datasets to identify patterns in players’ choices of lottery numbers. The question whether players preferred number combinations that are well-spread out regardless of their true theoretical probabilities was examined in the second pair. In the first pair of datasets, we find that most players have a preference for small numbers especially 1 and 9. They also prefer numbers with repeated digits and tend to avoid multiples of 7 and numbers containing 7 (except 7 and 77). The most popular numbers are 90 and 1. In the second pair of the datasets, more than 50% of the players preferred selecting well-spread out number combinations than expected by chance.
Keywords: lotteries, number preferences, betting systems, number culture, representative lottery number combinations, Nigeria
Lottery is one of the games of chance. It is a form of gambling which involves the drawing of prizes “by lot” with different formats in different countries (Bellhouse, 1991; Willmann, 1999; Bradley, 2001; Grundlingh, 2004; Alawode, 2011; Oyeleke & Otekunrin, 2014). Gambling dates back to pre-colonial Africa with reports of extensive gambling in West Africa, limited gambling in Central and Northern Africa with little or no gambling in Southern Africa (Binde, 2005; Louw, 2018). Gambling was restricted in most African countries during the colonial period but this has since been relaxed in at least 28 countries after independence (Louw, 2018). A comparison of gross gaming revenues across Africa shows that South Africa, Nigeria and Kenya respectively are Africa’s current largest online gambling markets (Louw, 2018; Slotegrator, 2021)
Different types of lotteries are played in many countries and they have different rules. However, to participate in a typical lottery game, players generally select k numbers, called the ticket, from a pool of n numbers. The sale of tickets is stopped by the organizers at a specified time and p winning numbers are selected randomly by the organizers from the n numbers. If any of the tickets sold match s or more of the p winning numbers, a prize is given to the holder of the matching ticket. Usually s is two or more to qualify for a prize (Li, 1999; Oyeleke & Otekunrin, 2014).
Some players select their number combinations by choosing personally significant numbers such as birthdays, house numbers, anniversary dates etc., while others prefer using heuristics leading to selection of numbers based on the frequency of occurrence of these numbers in previous draws (Simon, 1999). Representativeness heuristic (RH) is used to make predictions in gambling given known functional forms and parameters of the underlying system (Krawczyk & Rachubik, 2019). This heuristic may lead players to believe that well-spread out numbers are better than distinctive ones even though both have the same probability of occurrence. Krawczyk & Rachubik (2019) examined the concept of RH in gambling using a field experiment. They found that RH did well in predicting participants’ behavior in each task separately. Lien & Yuan (2015) studied a lottery game in China and established that most players have preferences for highly representative number combinations and over-avoided less representative number sets. This bias is known as representativeness bias. It is related to the gambler’s fallacy (GF) where people tend to believe that an event is less likely to occur because of its recent occurrence. Lottery players with this belief usually avoid recently drawn number combinations (Clotfelter & Cook, 1993; Suetens et al., 2016; Wang et al., 2016). A contrasting fallacy is the hot-hand fallacy (HHF) where people believe that an event is more likely to occur because of recent streaks of occurrence of that event (Suetens et al., 2016). Although opposite in effects, both biases may occur in the same situation (Sundali & Croson, 2006).
In other studies, players choose situationally available numbers including current date, month of play, voucher and zip codes (Wang et al., 2016). Some players prefer numbers located on the lower end of the range of numbers available (Polin et al., 2021) while others prefer numbers located at the centre of the lottery ticket (Bar-Hillel & Zultan, 2012; Wang et al., 2016). Researches involving number preferences include the work of Ziemba et al. (1986), Halpern & Devereaux (1989), Turner (2010), Gauvrit & Delahaye (2011),Wang et al. (2016) and Polin et al., (2021).
The most frequently chosen number in a large database explored by Polin et al. (2021) is 7. Some authors attributed the dominance of number 7 to its mathematical properties (Kubovy & Psotka, 1976; Shepard & Arabie, 1979; Griffiths & Tennenbaum, 2001; Gauvrit & Delahaye, 2011). Number 7, multiples of 7 and some numbers beginning with 7 are regarded as lucky numbers in many cultures (Halpern & Devereaux, 1989; Salerno, 2009). In contemporary Nigeria, number 7 and multiples of 7 are also considered lucky by some Nigerians who believe that 7 signifies perfection or completion. Traditionally, however, 3, 4, 5 and 7 are significant among the Igbos of South-East, Nigeria, where 7 signifies the number of times a man will reincarnate before stopping. The sacred numbers among the Bini people of South-South, Nigeria are 20, 2, 4, 7, 14, 40, 200 and 201 while the sacred numbers among the Yorubas of South-West, Nigeria include 4, 7, 10, 16, 40, 41, 256, 200, 201, 401, 1600 where 7 is linked with the Egungun festival dedicated to departed ancestors (Zaslavsky, 1970). Also, number 9 signifies reciprocity among the Yorubas. The belief is give more to receive more so as to have spiritual and by extension, physical abundance (Origunwa, 2016). Furthermore, in a study on number and colour preferences in four countries, children selected for the study from Niger and the Republic of Congo preferred number 9 and red (Vandewiele et al., 1986; Wang et al., 2016).
This study is distinguished from other studies in terms of data type and scope of study. Firstly, the datasets are of two types. The first data type is a compiled online staked number frequencies for direct bet types for National and Bazooka games from 3 January 2015 to 18 April 2021. They were obtained from Winners Golden Chance Lotto Company. Information on whether multiple tickets belong to the same player and the number combinations on each ticket is not available because of the aggregated nature of the datasets. The second data type is an anonymized individual-level data on lotto players’ number combinations collected from Ibadan, a city in South-West Nigeria. Three areas in Ibadan with the largest concentration of Winners Golden Chance Lotto Point of Sale (POS) booths were purposively selected based on official information. Simple random sampling was used to randomly select a total of 25 booths (10 from Mokola, 10 from Odo-Ona Apata and 5 from Challenge) from these locations. A total of 116, 5-lottery number combinations (tickets) were obtained for Bonanza (73) and Bazooka (43) games in October 2018. Bonanza is played every Friday, closing by 7:40 p.m. while Bazooka is played every Saturday, closing by 11:15 a.m. To overcome the challenge of selecting multiple tickets belonging to the same player, a data collector was stationed at each of the booths during the period of play for proper monitoring. The data collector discussed the aim of the research with each player and specifically requested for the number combinations of those who played the 5-direct betting type. Some of the players willingly revealed their 5-lottery number combinations which were recorded and used in this study.
Secondly, not much is known about Nigerian lottery players’ number preferences and belief biases. The focus of most of the researches on lotteries in Nigeria has been on taxes from lotteries, effects of lotteries on Nigerian youths, pattern, prevalence and determinants of gambling among different subpopulations in Nigeria (Akinadewo et al., 2019; Bankole, 2019; Bankole et al., 2019; Mustapha & Enilolobo, 2019; Aguocha & George, 2021). Also, Oyeleke & Otekunrin, 2014 investigated the performance of lottery winning strategies in a lottery game in South-West, Nigeria. Thus, in this paper, we examine lottery players’ preferences for numbers in our datasets. This would provide the Nigerian dimension to the discussion on numbers regarded as lucky in most cultures in the literature. Also, we examine whether players prefer number combinations that are well-spread out regardless of their true theoretical probabilities. This would enhance our understanding of decision making processes among Nigerian lottery players and how Nigerians make choices outside of lotteries.
Winners Golden Chance Lotto Company is a private lottery business organization in Nigeria set up in 2005 to engage in lotto services. It currently operates via different channels including point of sale terminals, online mobile applications among others. A minimum of four games is played per day. The betting systems adopted are direct, permutation and against 1-90. In the direct system, players select either 1, 2, 3, 4, or 5 number combination respectively from the available pool of 1 to 90 numbers. At the close of the game, the organizers select 5 winning numbers. To win a prize, the number combination selected by the player must match either 1, 2, 3, 4, or 5 of the winning numbers (based on the type of direct system used by the player). In the permutation system, players select 10 number combination from the pool of 1 to 90 numbers. A prize is won if either 2, 3, 4, or 5 of the numbers selected by the player is among the 5 winning numbers drawn by the organizers. Against 1-90 involves the selection of just one number out of 1 to 90 numbers. A player wins if the number selected is among the 5 winning numbers selected by the organizers. The minimum amount players can place on a bet is NGN5 while the maximum amount is NGN10,000. Bet is rewarded according to the amount placed on a bet by the player and the factor placed on each bet by the lotto company. The factor is the fixed prize for each bet type and is determined by the lotto company. If there are multiple winners of the jackpot, the total prize money is split among the winners leading to reduced payments for the winners. Table 1 shows the bet types, prize factor and the probability of winning for direct bet types.
Table 1: Bet Types and amount to be won. The amount placed on the bet is multiplied by the Prize Factor to yield the amount to be won, in Naira (NGN, $1 is about 400 NGN).
Bet type Number Selected 1 Direct
/ first betSelect 1 number from 90 ) (
1 1 ) /(
89 0 ) = 0.011111
90 1 2 Direct
/ 2 sureSelect 2 numbers from 90 ) (
5 2 ) /(
85 3 ) = 0.0224376
90 5 3 Direct
/ 3 sureSelect 3 numbers from 90 ) (
5 3 ) /(
85 2 ) = 0.00081230
90 5 4 Direct
Select 4 numbers from 90 ) (
5 4 ) /(
85 1 ) = 0.000009670
90 5 5 Direct
/ JackpotSelect 5 numbers from 90 ) (
5 5 ) /(
85 0 ) = 0.00000002275
90 5 Perm 2
Select 10 numbers from 90 Perm 3 Select 10 numbers from 90 Perm 4 Select 10 numbers from 90 Perm 4 Select 10 numbers from 90 Against
1–90Only one number Source: https://winnersgoldenchance.com.
National game is played every Saturday. The game closes by 7:40 p.m. The data are online staked number frequencies from 3 January 2015 to 18 April 2021. These data are from direct betting systems where a player selects either 1, 2, 3, 4 or 5 number combinations. In this game, the total number frequencies is 309,722 while the mean number frequencies is 3441.36. Each number is expected to be selected randomly with equal probability 1/90 (1.1%). From Figure 1 (top), we observe players’ preferences for number 90, selected 6743 times (2.18%), followed by numbers 1 and 19, selected 5292 (1.71%) and 4906 (1.58%) times respectively. Numbers 89, 10, 77 and 9 are each selected 4506 (1.45%), 4389 (1.42%), 4263 (1.38%) and 4152 (1.34%) times respectively. It is worthy to note that 50% (29, 39, 49, 59 and 69) of all numbers containing 9 have their frequencies of selection below the line in Figure 1. Number 7 is the 18th most frequently selected number, selected 3874 (1.25%) times, just above the line. Number 77 is the 6th most popular number while the number of times of selection of majority (66.7%) of all multiples of 7 fall below the line. Furthermore, the number of times of selection of majority (66.7%) of all numbers containing 7 fall below the line. In particular, all numbers with repeated digits (11, 33, 44, 55, 66, 77, and 88) except 22 are chosen more often than the mean. Also, 90, the most popular number, is located at the upper end of the possible range 1-90 while number 1, the 2nd most popular number, is at the lower end of the range.
Bazooka game is played every Saturday. The game closes by 11:15 a. m. The data are online staked number frequencies from 3 January 2015 to 18 April 2021. These data are from direct betting systems where a player selects either 1, 2, 3, 4 or 5 number combinations. The mean number of times each number was selected is 1702.1 while the total number of times each number was selected is 153,189. Each number is expected to be selected randomly with equal probability 1/90 (1.1%). From Figure 1 (bottom), the most popular numbers are 90, 1, and 11 each occurring 3175 (2.07%), 3008 (1.96%) and 2596 (1.69%) times respectively. These are followed by numbers 19, 10 and 9 occurring 2581 (1.68%), 2407 (1.57%) and 2239 (1.46%) times respectively. The frequencies of selection for each of 29, 39, 49, 59, 69 and 79 all fall below the line. Number 7 is the 17th most popular number with 1946 (1.27%) selections, slightly above the mean while 77 is the 8th most popular number with 2085 (1.36%) selections. The frequency of selection of 75% of all multiples of 7 fall below the line while the frequency of selection of majority (83.33%) of all numbers containing 7 also fall below the line. Also, all numbers with repeated digits (11, 22, 33, 44, 55, 66, 77, and 88) are chosen more often than the mean. Furthermore, 90, the most popular number, is located at the upper end of the possible range 1-90 while 1, the 2nd most popular number, is at the lower end of the range.
Figure 1: Number frequencies of the National game (top) and Bazooka game (bottom). The horizontal black lines are the mean.
Note that both parts of Figure 1, from different samples, show very similar patterns of preferences. From the two datasets, players seem to have a high preference for small numbers (single digits) especially 1 and 9. Various authors including Stern & Cover, (1989), Oyeleke & Otekunrin, (2014) and Wang et al. (2016) reported a preference for small numbers. Also, players have a preference for numbers with repeated digits in the two datasets (11, 22, ... 88, which are above the mean for all but one case). This contradicts the results of Halpern and Devereaux, (1989), which implied that players avoided doubled digits and those of Holtgraves and Skeel (1992), which suggested that players preferred numbers without repeated digits over numbers with repeated digits. The popularity of number 7 in the two games might be connected to the belief held by some Nigerians that 7 is a lucky number while the popularity of 77 may have arisen both from a preference for 7 and a preference for repeated numbers. Players do not seem to have a preference for multiples of 7 and numbers containing 7 except 7 and 77. This contradicts Halpern & Devereaux, (1989) where high proportion of bets were reported on these numbers. Furthermore, we have not been able to fully explain the popularity of numbers 90, 19, 89 and 9 among the players in the two datasets. The players seem to have a preference for numbers containing 9 located at the relatively lower (9 and 19) and upper (89 and 90) edges of the range of numbers available while avoiding numbers containing 9 located at the centre. This result is similar to one of the results in Bar-Hillel (2015) and Panitz (2000) where items placed at the beginning and end of a menu list are preferred over those that are at the centre of the list because of serial position effect. However, Halpern & Devereaux (1989) reported that players tended to avoid endpoints of a range of numbers while Bar-Hillel & Zultan (2012) and Wang et al., (2016) reported that players preferred numbers located at the centre of the lottery ticket. Furthermore, Polin et al., (2021) stated that players preferred numbers located at the lower end of the possible range of numbers. The popularity of 9 and 19 might also be linked to personally significant numbers (birthdays, house numbers et cetera) and the belief in the principle of give more to receive more that 9 symbolizes among the Yorubas of South-West, Nigeria.
The motivating factor for many lottery players is the possibility of winning the jackpot despite very low winning probabilities (Oyeleke & Otekunrin, 2014). To increase their chances of winning, different strategies of selecting number combinations are usually employed. For example, many players prefer spreading out their number combinations as evenly as possible favoring “random-looking” combinations over distinctive ones even though both have the same probability of occurrence (Lien & Yuan, 2015; Wang et al., 2016; Krawczyk & Rachubik, 2019). These “random-looking” combinations are said to be representative of the uniform distribution (1-90 for the games under consideration). Krawczyk and Rachubik (2019) examined whether subjects prefer well-spread out combinations by pairing tickets that were randomly generated with tickets that had distinctive number combinations. The participants were thereafter asked to choose between the two tickets. They found that most people prefer lottery tickets with random-looking number combinations over distinctive ones.
Thus, using the second pair of the datasets (with much smaller samples but with a list of five bets from each player), we ask whether players prefer number combinations that are well-spread out regardless of their true theoretical probabilities. We first examine the five-bin heuristic and then compare the variances of the number combinations selected by each player with the variance of the discrete uniform distribution (numbers 1–90).
The five-bin heuristic is an adaptation of the three-bin heuristic described by Lien & Yuan (2015) which is based on some gambling advice literature. It involves partitioning the number range into sections before players select their numbers evenly across the sections.
We adapted this approach by partitioning the integers 1–90 into five sections, each section representing a bin, that is, 1–18, 19–36, 37–54, 55–72 and 73–90.
Let Ticketi = n1,n2,n3,n4,n5 where i = (1,2,3,4,5) denote each number in the lottery number combination for a particular ticket i. Let R1,R2,R3,R4,R5 denote chosen numbers which fall into bins (1–18), (19–36), (37–54), (55–72) and (73–90) respectively. The vector (R1,R2,R3,R4,R5) is a measure of how evenly spread the numbers are across the five bins. For example, Ticket = (8,15,49,78,32) corresponds to vector (2,1,1,0,1): 8 and 15 from R1; 32 from R2; 49 from R3; no number from R4; 78 from R5.
Results from the Bazooka 5-number combinations showed that 2.3% (1) of the 43 players selected their numbers from just one bin, 13.9% (6) selected from 2 bins, 53.5% (23) selected their numbers from 3 bins, 30.2% (13) selected from 4 bins while none selected from all the 5 bins.
From the Bonanza 5-number combinations, 13.7% (10) of the 73 players selected their numbers from 2 bins, 46.6% (34) selected their numbers from 3 bins, 37% (27) selected from 4 bins, 2.7% (2) selected their numbers from all the 5 bins while none selected from a single bin.
Thus, more than half of the players in each of the games selected their number combinations from at least 3 bins suggesting that they preferred well spread out number combinations.
However, such a result could arise by chance if players selected randomly. To simulate such a situation, we created 10,000 vectors of 5 numbers from 1–5 and examined the proportions of number of bins. These were 0.2%, 9.6%, 47.9%, 38.5%, and3.8%, for 1–5 bins, respectively. These simulated numbers were on the average somewhat higher for Bazooka (significantly so at p=.03 by t test), and approximately the same for Bonanza. Thus, although some players may have used a 5-bin heuristic, they were likely offset by others who chose numbers in the same bin for some other reason.
Secondly, the variances of the number combinations selected by each player were computed and compared with the variance of the discrete uniform distribution (numbers 1–90). Of the 73 different tickets in the Bonanza game, 44 (60.3%) have variances above the variance of the distribution (682.5). In the Bazooka game 22 (53.5%) tickets have variances above the variance of the distribution. Thus, for each of the games, more than 50% of the players prefer well spread out number combinations than expected by chance.1 Players do seem to try to vary their bets.
These results corroborate earlier research findings. Krawczyk & Rachubik (2019) confirmed that players prefer well-spread out number combinations over number sets that are not randomly-looking. Lien & Yuan (2015) concluded that gamblers employed representativeness bias, selecting more representative number sets and over-avoiding less representative sets.
In this paper, we examined two pairs of datasets from selected Nigerian lottery games to determine players’ number preferences. In the first pair of datasets, players exhibited a high preference for small numbers (single digits) especially 1 and 9. These results are in line with related past literature. It is worthy to note that players had a preference for numbers with repeated digits and avoided multiples of 7 and numbers containing 7 (except 7 and 77) in the two datasets. These contradict results in related past literature. Furthermore, the most popular numbers were 90 and 1 in the two datasets, contradicting results on edge aversion in related past literature. The popularity of these numbers can also be linked to the notion that gamblers prefer selecting number combinations that “appear” random, covering the entire range, 1 and 90 inclusive. Also, the belief about number 7 being regarded as the lucky number in Nigeria is contradicted by the popularity of numbers 90 and 1 in this study. However, we have not been able to fully explain the popularity of numbers 90, 19, 89 and 9 among players in the two datasets. The popularity of 9 and 19 might be attributed to personally significant numbers and the belief in the principle of give more to receive more that 9 symbolizes among the Yorubas of South-West, Nigeria. The popularity of numbers 89 and 90 might be explained by the serial position effect. In the second pair of the datasets, more than 50% of the players preferred selecting well spread out number combinations than expected by chance.
Aguocha, C. M., & George, S. (2021). An overview of gambling in Nigeria. BJPSYCH International, 18(2), 30–32. http://dx.doi.org/10.1192/bji.2020.28.
Akinadewo, I. S., Akinkoye, E. Y., Oyedokun, G. E. & Asaolu, T. O. (2019). Tax audit and direct tax revenue in lottery industry in Nigeria: Can forensic accounting bridge the gap? Fountain University Osogbo Journal of Management, 4(2), 73–92.
Alawode, O. A. (2011). Construction of balanced incomplete block designs using lotto designs Ph.D. thesis, Department of Statistics, University of Ibadan, Nigeria. https://scholar.google.com/citations?user=M62cldsAAAAJ&hl=en
Bankole, E. T. (2019). Patterns and prevalence of gambling behaviour among youths in South-West Nigeria: A case study of youths in Oyo and Ekiti States. British Journal of Psychology Research, 7(2), 22–46.
Bankole, E. T., Adebunmi, O. & Bankole, A. M. (2019). Personality traits and financial strain as determinants of gambling behaviour among youth in Nigeria: A case study of youths in Oyo State and Ekiti State. American International Journal of Social Science Research, 4(1), 1–8.
Bar-Hillel, M., & Zultan, R. (2012). We sing the praise of good displays: How gamblers bet in casino roulette. Chance, 25(2), 27–30.
Bellhouse, D. R. (1991). The Genoese Lottery. Statistical Science, 6(2), 141–148.
Binde, P. (2005). Gambling Across Cultures: Mapping worldwide occurrence and learning from ethnographic comparison. International Gambling Studies, 5(1), 1–27. https://doi.org/10.1080/14459790500097913.
Bradley, R. E. (2001). Euler’s analysis of the Genoese Lottery. Convergence, August. https://www.maa.org/book/export/html/116034.
Clotfelter, C. T., & Cook, P. J. (1993). The “gambler’s fallacy” in lottery play. Management Science, 39(12), 1521–1525.
Gauvrit, N. & Delahaye, J. (2011). A short note on number preference. hal-00572752. https://hal.archives-ouvertes.fr/hal-00572752
Griffiths, T. L., & Tenenbaum, J. B. (2001). Randomness and coincidences: Reconciling intuition and probability theory. Proceedings of the Annual Meeting of the Cognitive Science Society, 23. Retrieved from https://escholarship.org/uc/item/2cw487hh.
Grundlingh, W. R. (2004). Two new combinatorial problems involving dominating sets for lottery schemes. Ph.D. dissertation, Department of Applied Mathematics. University of Stellenbosch, South Africa. https://scholar.sun.ac.za/handle/10019.1/1388.
Halpern, A. R. and Devereaux, S. D. (1989). Lucky numbers: Choice strategies in the Pennsylvania daily number game. Bulletin of the Psychonomic Society, 27(2), 167–170.
Holtgraves, T. & Skeel, J. (1992), Cognitive Biases in Playing the Lottery: Estimating the Odds and Choosing the Numbers. Journal of Applied Social Psychology, 22(12), 934–952. https://psycnet.apa.org/doi/10.1111/j.1559-1816.1992.tb00935.x.
Krawczyk, M. W. & Rachubik, J. (2019). The representativeness heuristic and the choice of lottery tickets: A field experiment. Judgment and Decision Making, 14(1), 51–57.
Kubovy, M. & Psotka, J. (1976). The predominance of seven and the apparent spontaneity of numerical choices. Journal of Experimental Psychology: Human Perception and Performance, 2, 291–294.
Li, P. C. (1999). Some results on lotto designs. Ph.D. dissertation, Dept. of Computer Science, University of Manitoba, Canada.
Lien, J. W. & Yuan, J. (2015). The cross-sectional “gambler’s fallacy”: Set representativeness in lottery number choices. Journal of Economic Behavior & Organization, 109, 163–172.
Louw, S. (2018). African numbers games and gambler motivation: ‘Fahfee’ in contemporary South Africa. African Affairs, 117(466), 109–129. https://doi.org/10.1093/afraf/adx043
Mustapha, S. A. & Enilolobo, O. S. (2019). Effects of gambling on the welfare of Nigerian youths: A case study of Lagos State. Journal of Gambling Issues, 43, 29-44. http://dx.doi.org/10.4309/jgi.2019.43.3.
Origunwa, O. (2016). Yoruba numerology: The secret power of nine (9). https://www.obafemio.com/blog/yoruba-numerology-the-secret-power-of-nine-9.
Oyeleke, O. B. & Otekunrin, O. A. (2014). On the performance of lottery winning strategies: A case study of Oyo state lottery, Nigeria. British Journal of Mathematics & Computer Science,4(17), 2557–2569.
Panitz, B. (2000). Reading between the lines: The psychology of menu design. Restaurants USA, 8, 81–87.
Polin, B. A., Ben Isaac, E., & Aharon, I. (2021). Patterns in manually selected numbers in the Israeli lottery. Judgment & Decision Making, 16(4), 1039–1059.
Salerno, A. (2009). Numbers, culture and superstition. https://www.voanews.com/archive/numbers-culture-and-superstition. Accessed January 21, 2021.
Shepard, R. & Arabie, P. (1979). Additive cluttering: representation of similarities as combinations of discrete overlapping properties. Psychological Review, 86, 87–123.
Simon, J. (1999). An Analysis of the distribution of combinations chosen by UK national lottery players. Journal of Risk and Uncertainty, 17(3), 243–276.
Slotegrator (2021). Bet on the future: Africa’s online gambling industry. South Africa is the largest,$2.3 billion mark by 2023. Accessed May 5, 2021. https://slotegrator.pro/analytical_articles/online-gambling-in-africa.html.
Stern, H., & Cover, T. M. (1989). Maximum entropy and the lottery. Journal of the American Statistical Association, Applications & Case Studies, 84(408), 980–985.
Suetens, S., Galbo-Jorgensen, C.B., & Tyran, J. R. (2016). Predicting lotto numbers: A natural experiment on the gambler’s fallacy and the hot-hand fallacy. Journal of the European Economic Association, 14(3), 584–607.
Sundali, J., & Croson, R. (2006). Biases in casino betting: The hot hand and the gambler’s fallacy. Judgment & Decision Making, 1(1), 1–12.
Turner, N. E. (2010). Lottery ticket preferences as indicated by the variation in the number of winners. Journal of Gambling Studies, 26(3), 421–439.
Vandewiele, M., D’Hondt, W. & Didillon, H. (1986). Number and color preferences in four countries. Perceptual and Motor Skills, 63, 945–946.
Wang, T.V., van Loon, R.J., van den Assem, M. J. & van Dolder, D. (2016). Number preferences in lotteries. Judgment & Decision Making, 11(3), 243–259.
Willmann, G. (1999). The history of lotteries. http://willmann.com/~gerald/history.pdf.
Zaslavsky, C. (1970). Mathematics of the Yoruba people and of their neighbors in southern Nigeria. The Two-Year College Mathematics Journal 1(2), 76–99.
Ziemba, W.T., Brumelle, S.L., Gautier, A. & Schwartz, S.L. (1986). Dr. Z’s 6/49 Lotto Guidebook. Vancouver and Los Angeles.
The Authors thank Winners Golden Chance Lotto Company for releasing the first pair of datasets used in this study. The Authors also appreciate the Editor and the Reviewers for their invaluable comments which have led to significant improvements in the paper.
Copyright: © 2021. The authors license this article under the terms of the Creative Commons Attribution 3.0 License.
This document was translated from LATEX by HEVEA.