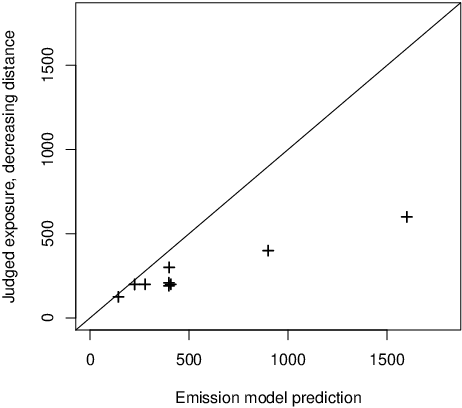
| Figure 1: Median judged exposure in percent after having moved closer to a person plotted against model predictions. The straight line describes REM predictions. |
Judgment and Decision Making, Vol. 15, No. 6, November 2020, pp. 881-888
Without a mask: Judgments of Corona virus exposure as a function of inter personal distanceOla Svenson* Sophia Appelbom# Marcus Mayorga$ Torun Lindholm Öjmyr! |
In order to minimize the risk of infection during the Covid-19 pandemic, people are recommended to keep interpersonal distance (e.g., 1 m, 2 m, 6 feet), wash their hands frequently, limit social contacts and sometimes to wear a face mask. We investigated how people judge the protective effect of interpersonal distance against the Corona virus. The REM model, based on earlier empirical studies, describes how a person’s virus exposure decreases with the square of the distance to another person emitting a virus in a face to face situation. In a comparison with model predictions, most participants underestimated the protective effect of moving further away from another person. Correspondingly, most participants were not aware of how much their exposure would increase if they moved closer to the other person. Spectral analysis of judgments showed that a linear ratio model with the independent variable = (initial distance)/(distance to which a person moves) was the most frequently used judgment rule. It leads to insensitivity to change in exposure compared with the REM model. The present study indicated a need for information about the effects of keeping interpersonal distance and about the importance of virus carrying aerosols in environments with insufficient air ventilation. Longer conversations emitting aerosols in a closed environment may lead to ambient concentrations of aerosols in the air that no distance can compensate for. The results of the study are important for risk communications in countries where people do not wear a mask and when authorities consider removal of a recommendation or a requirement to wear a face mask.
Keywords: Corona virus, Covid-19, perceived virus exposure, face to face distance, social distancing, spectral analysis
Keeping interpersonal distance is one of the most efficient ways to prevent the spread of the Corona virus or any virus, along with frequent washing of hands, limiting social contacts and the use of a face mask. During the Covid-19 pandemic, authorities all over the world communicate this fact to the public and recommend face to face distances of at least, for example, 6 feet, 1.0 m or 2.0 m. But, how efficient are these distances in reducing exposure to the airborne transmission of the virus and a virus infection? Does the public know how exposure to the virus varies with change of face to face distance? There are several studies of virus exposure and probability of an infection from different distances (Balachander et al., 2020; Chu et al., 2020). But, we are not aware of any studies of how perceived exposure varies with inter personal distance. This is the reason for conducting the present study.
A Corona virus can travel on droplets that are greater or smaller than 5 µ m. Droplets exhaled from a person that are greater than 5 µ m follow the laws of gravity and fall to the ground within some distance from the exhaling person (Morawska & Cao, 2020). Droplets smaller than 5 µ m may originate directly from an exhalation or from evaporated greater droplets and are called aerosols and their movements follow the streams of air and can stay in the air for a long time (Crema, 2020). The aerosols provide ambient virus exposure. Balachander and co-authors (Balachander et al., 2020) give an extensive overview and possible solutions for how to solve the multiphase flow problems created by these two kinds of virus carrying particles. Early after an exhalation, the ambient dispersion effects can be ignored because droplet-laden effects seem to dominate, but after longer time aerosols cumulate and the ambient effect takes over and determines the exposure. Bourouiba (2020) specifies how far the larger droplets but also smaller aerosols can travel after a sneeze or cough (7–8 m). A person’s exposure to droplets and aerosols depend not only on distance but also on, e.g., time, temperature, humidity and ambient air turbulence. In the present study, we did not vary these conditions and simply asked our participants to imagine a face to face conversation assuming no coughing or sneezing and to judge relative virus exposure at different distances in the same environmental context.
Bischoff and colleagues (Bischoff et al., 2013) measured patient exhalation of influenza virus particles greater and smaller than 4.7 µ m. The number of greater particles per unit of air were less at 1.83 m than the smaller ones, while they were about equal in number at 0.91m. The authors measured virus exhalation at only 3 different distances (0.30, 0.91, 1.83 m) from a patient and the function for all sizes of particles combined was Exposure = 155.03 × Distance−0.8. These patients were all laying in bed when the air samples were collected during 20 min. The exponent close to –1.0 may reflect the fact that the air in the room had been partly saturated by ambient aerosols making the distance to the source less prominent than if the time had been shorter in fresh air.
Bjørn and Nielsen (2002, p. 155, Fig. 15) reported exposure to a person’s normal breathing in a calm laboratory face to face setting with different distances (0.4 to 1.2 m). The power function Exposure = 1.90 × Emission × Distance−2.2 describes their results. In another empirical study by Nielsen et al. (2012, p. 557, Fig. 8) the power function was Exposure = 4.3 × Emission × Distance−2.3 (0.35 to 1.10 m) with a different constant depending on different measures of relative exposure used in the different studies. The laboratory results presented by Nielsen and collaborators are most similar to the situation presented to our participants, a face to face conversation with no coughing or sneezing, but a change of inter person distance. Therefore, we used these results when we formulated a model for objective exposure and approximated the exponent to −2.0 in Equation (1). Exp is exposure to virus, a a constant, E emitted virus during time t, and D distance to source:
| Exp = a × E × D−2 × t D > 0, t > 0 (1) |
The exposure to a virus exhalation may also be seen as an analogue to radiation emission reaching a surface at different distances, which also decreases in magnitude with the square of the distance. Therefore, we called the model in Equation (1) the Radiation Emission Model, REM. An alternative model is a linear model between inverse distance and exposure and an exponent = -1.0 in Equation (1).
To illustrate the REM model, a person may judge the change of exposure after having moved closer to another person face to face from 6 to 2 feet to increase 6/2 = 3 times after the move according to a linear model of the ratio of distances. The quadratic function predicts a judgment of (6/2)2 = 9 times. At present, we do not know if people’s judgments of change of virus exposure after change of distance follow the linear, quadratic or any other function.
It is interesting to note that we do not know with complete certainty the relationship between exposure and risk of infection, which is not the main focus of the presents study. The effects on virus exposure and risk of infection at different interpersonal distances have been investigated from different perspectives. Setti and co-workers (2020) describe how airborne aerosol viruses indoors have infected people in hospitals and argue that this kind of airborne route could be a contributing cause for the anomalous Covid-19 “outbreak” in northern Italy. Therefore, they argue that the risk of infection even at 2 meters (about 6 feet) inter personal distance is too high unless everyone present wears a face mask. Contrary to this conclusion, Lonergarn (2020) argues that even one meter interpersonal distance gives a sufficient reduction of risk of being infected and an increase of this distance contributes, with great uncertainty, only marginally to increased protection against the virus. In their meta-study Chu and colleagues (Chu et al., 2020) used mostly data from health care settings and risk of infection as a function of distance, but the confidence intervals around the reported means are huge and do not differentiate between particle sizes. They report a monotonously decreasing curved function of risk of infection with distance. Their use of health care studies means that cumulated ambient aerosols may have dominated the virus distributions and infection rates in some of the studies they cite and played down the effect of distance there compared with the effect of distance in a regular short conversation.
In summary, there are different perspectives on both facts (the dispersion of particles and the effect on risk of infection), and values (acceptable risk of infection). In parallel with the development of medical science, lay people will develop their own subjective models about the Corona virus and Covid-19 to a great extent based on information given by different media. In the present study, we will focus on lay people’s judgments of virus exposure at different distances and ignore risk of infection and acceptable risk.
For a long time it has been known that it is difficult for people to judge curvilinear functions like power and exponential functions. This speaks against the quadratic REM function as a descriptor of judgments in the present context. Most intuitive judgments of power functions are biased towards a less curved linear function (Ebersbach, Lehner, Resing & Wilkening, 2007; Mullet & Cheminat, 1995; Svenson, 1977; Wagenaar & Sagaria, 1975). When judging virus exposure, a linear function means insufficient sensitivity to changes of exposure depending on distance compared with a quadratic function.
To conclude, we want to investigate subjective judgments of changes in virus exposure as a function of changes of distance. We will do so because for effective risk communication we need to “..identify the knowledge critical to decisions; assess the decision makers’ current knowledge; develop messages closing important gaps..” (Fischhoff, 2020, p. E2). And we have identified the relation between inter personal face to face distance and virus exposure as knowledge that is critical when designing communications about risk and interpersonal distances in face to face interactions.
A total of 101 participants were selected by Prolific from a US general adult population sample. One participant was eliminated because of judgments of zeros across problems. There seemed to be a difficulty for some participants to judge in percent the total exposure (and not just the increase) after a decrease in distance because 10 participants gave more than 4 judgment that were smaller than 100 in the decrease condition and were excluded from further analysis. Two participants gave more than 4 judgments greater than 100 in the increase distance condition and were eliminated. This left us with 88 participants for further analysis. The mean age was 30 (SD=12) years with a range from 18 to 78 years. In the sample of participants12 had high school education, 26 vocational or some college education, 37 were college graduates and 13 had higher than college education.
A Qualtrics questionnaire was distributed to Prolific participants who completed the task in 13.3 (SD=9.8) min on average. The instruction included the following.
As you probably know, the Coronavirus spreads on small droplets in the air when a person infected with Covid-19 breaths, coughs, sneezes or talks without wearing a mask. By breathing in these droplets, other people can catch the virus and get infected. Therefore, keeping a physical social distance reduces the risk of the virus to spread from person to person. We will ask you to judge the degree to which different distances in face to face situations can prevent a person from virus exposure.
The instruction continued with the first item exemplified next.
Assume that two persons are in a face to face conversation standing 2 feet away from each other. If they moved away from each other, their Coronavirus exposures would decrease. If they increased the distance from 2 feet to 4 feet, what percentage of the airborne viruses reaching a person at 2 feet will reach a person at 4 feet? Please, answer with a percentage.Same = 100%, Three quarters = 75%, Half = 50%, One quarter = 25 %, One tenth = 10% etc.…
The instruction for a person approaching another person was the following.
Assume that two persons are in a face to face conversation standing 4 feet away from each other. If they moved closer to each other, their Coronavirus exposures would increaseIf they decreased the distance from 4 feet to 2 feet, what percentage of the airborne viruses reaching a person at 4 feet will reach a person at 2 feet? Please, answer with a percentage.
Same= 100%, twice = 200%, 5 times = 500%, 10 times = 1 000%, 100 times = 10 000% etc.…
The decrease and increase distance problems were presented in random order in a block for each kind of problem. The order of presentation of the blocks was balanced across participants. The decrease items were the following: problem (1) first distance 4 feet, second distance 2 feet, (2) 6,4; (3) 6,2; (4) 4,2; (5) 8,4; (6) 8,2; (7) 5,3; (8) 6,5; (9) 6,3. The increase items were the following: problem (10) 2,4; (11) 4,6; (12) 2,6; (13) 2,4; (14) 4,8; (15) 2,8; (16) 3,5; (17) 5,6; (18) 3,6.
The Corona virus questions were followed by a few other problems not analyzed here and some demographic data items.
Table 1: Distances in feet and exposures in percentages of exposure at second distance in percentage of exposure at first distance.
Problem number First distance Second distance Judged exposure (%)
Median (25–75 percentiles)REM (%) 1 4 2 200 : (200 – 500) 400 2 6 4 200 : (150 – 200) 225 3 6 2 400 : (300 – 975) 900 4 4 2 200 : (200 – 500) 400 5 8 4 200 : (200 – 500) 400 6 8 2 600 : (400 –1000) 1600 7 5 3 200 : (162 – 300) 278 8 6 5 125 : (100 – 150) 144 9 6 3 300 : (200 – 500) 400 10 2 4 50 : (50 – 75) 25 11 4 6 50 : (25 – 75) 44 12 2 6 25 : (10 – 33) 11 13 2 4 50 : (50 – 75) 25 14 4 8 25 : (5 – 50) 25 15 2 8 10 : (5 – 25) 6 16 3 5 50 : (25 – 75) 36 17 5 6 63 : (14 – 80) 69 18 3 6 50 : (25 – 50) 25
The results section will start with group data, proceed to analyses of individual problems and end with analyses at the individual level.
The distributions of the judgments were non-normal and therefore medians were used instead of arithmetic means. Shapiro Wilk tests of the distributions of the judgments for each problem gave values smaller than W = 0.001 indicating deviations from normality. Skewness1 values for the decreasing distance problems ranged from 5.01 to 9.34 indicating that the tail of the distributions included the higher values. Skewness for the increasing distance problems were on average smaller (M= 2.8) than those for the decreasing distance problems (M=7.8) but they were all positive except for one problem. Table 1 shows the medians with quarter percentiles.
The results show that when a person moves closer to another person the median judged increase of exposure is underestimated in relation to REM (Figure 1).
Figure 1: Median judged exposure in percent after having moved closer to a person plotted against model predictions. The straight line describes REM predictions.
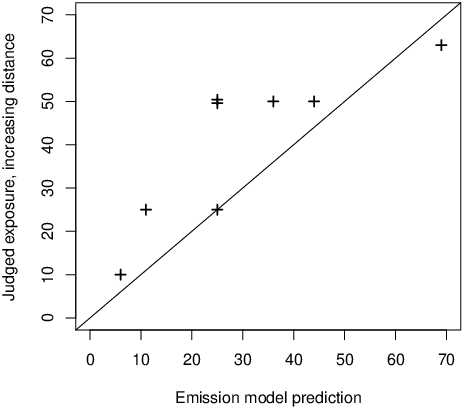
Figure 2: Median judged exposure in percent after having moved away from a person plotted against model predictions. The straight line describes REM predictions.
When a person moves away from another person, the decrease of exposure is generally underestimated (Figure 2). In other words, the participants were insufficiently sensitive to the effects of a change of face to face distance to another person on change of virus exposure as predicted by REM.
The results indicate that people are not aware of the magnitude of the exposure difference when they move closer to or move away from another person in comparison with REM. Instead it seems to indicate the use of an approximately a linear rule. However, it is possible to argue that the results depend on a judgment regression bias, anchoring, that attracts judgments towards the reference value (Poulton, 1989). This would mean that the participants have a correct understanding of the facts as described by REM but are victims of an anchoring bias towards 100% when they make their judgments (Tversky & Kahneman, 1974). To eliminate this hypothetical interpretation of the results we need to know more about the participants’ judgment processes.
Table 2: Spectral analysis of judgments with the 2 most frequent modes of responses and predictions using n=1.0 and 2.0 in Equation (1). Number of judgments in each mode cluster.
Problem First distance Second distance First mode :
cluster size N (%)Second mode :
cluster size N (%)Prediction n=1.0 Prediction=2.0 1 4 2 200 400 2 6 4 150 225 3 6 2 300 900 4 4 2 200 400 5 8 4 200 400 6 8 2 400 1600 7 5 3
100 : 10 (11%)167 278 8 6 5 83 144 9 6 3 200 400 10 2 4 50 25 11 4 6 67 44 12 2 6 33 11 13 2 4 50 25 14 4 8 50 25 15 2 8 25 6 16 3 5 60 36 17 5 6 83 69 18 3 6 50 25 Note, * indicates that mode in judgment category equals the ratio of distances. There were 88 valid judgments for each problem with the exception for problems 11, 14 and 15 that had 87 valid judgments.
Spectral analysis (Svenson, Gonzalez & Eriksson, 2018; Svenson & Borg, 2020) was introduced and used to identify groups of individuals who use the same cognitive rule when they make their judgments. In a spectral analysis, distributions of response frequencies are used to identify different judgment rules. In the present study a participant makes only one judgment of each problem, and therefore the distribution of judgments of a problem is also a distribution of participants.
In practical terms, a spectral analysis starts with a search for the mode of the response distribution for a problem. Then, we define a cluster of judgments around the mode that are within an uncertainty interval. This first tentative interval is chosen so that the response frequencies outside the cluster decrease above and below the mode cluster. We then infer a rule that could produce a judgment in the cluster. The judgment predicted by a rule can be the mode or close to the mode but within the cluster. After this, we remove all judgments in the cluster around the first mode and localize a new mode in the remaining set of judgments. We then define a new cluster of responses and search for a second process rule that generates a value in this second cluster of judgments. This can be done also a third and a fourth time if the data indicate several clusters.
The first tentative interval for inclusion of judgments in a cluster around a mode can be adjusted up or down so that it gives the best resolution and descriptions across problems and rules in terms of differentiation between rules across problems. For example, two rules may predict values close to each other and the corresponding distributions must be separated into two clusters with the second cluster in mind. This defines the final range of judgments that belong to each of the clusters. It should be noted that the method is fundamentally exploratory and descriptive even if it can be used to check hypothetical judgment rules.
In the following, we will identify the first and second mode in each judgment distribution. First, in the increase distance condition we will classify all judgments within ±5% of a mode as belonging to a cluster. In the decrease distance condition with greater values we will classify all judgments within ±10% as belonging to a cluster. These uncertainty intervals allow some approximation errors made by the judges. It is important to note that because we allow an interval of judgments around a node, the second node cluster can include more judgments than the first node’s cluster. If we can find a rule that predicts the node or another value in a cluster of judgments, we may assume that the participants who have made judgments in the cluster have used the same rule.
In Equation (2), J is judgment of exposure after change of distance from, D1 the first longer to the second shorter distance, D2 when a person approaches another person. The exposure time, t is assumed constant. Then, the relationship between the judgments and distances may be described by a power function.
| J = | ⎛ ⎜ ⎜ ⎝ |
| ⎞ ⎟ ⎟ ⎠ |
| D1 > 0, D2 > 0, t > 0 (2) |
When n=2.0, this equation is the same as REM in Equation (1). When n= 1, Equation (2) describes a linear relationship between exposure and the ratio of the distances. When the distance decreases, exposure increases and a participant believes that the change of exposure is linear with the ratio of the distances. Equation (2) applies also when a person moves away from another person and D1 < D2. Table 2 shows the modes and Equation (2) predictions with exponents 1.0 and 2.0.
The results show that ratios used in a linear way explain a cluster for 12 of the 18 problems. This rule produces systematic underestimations of the effects of a change of interpersonal distance in relation to REM. Compared with this model, many participants were not aware of the great difference in exposure after a move towards or away from another person during a conversation according to REM. Hence, an explanation of the results as just an effect of a judgment regression bias towards 100% cannot explain the results. To conclude, REM was a poor predictor of the judgments of exposure changes for most judgments.
However, in the decrease distance (exposure increase) condition the 75 percentiles indicated that for 7 of the 9 problems a fourth of the participants made judgments that were equal or greater than the emission model predictions. In the increase distance (exposure decrease) condition a fourth of the participants made judgments that were the same or smaller than REM predictions for 7 of the 9 problems. Hence, there was a minority of judgments that indicated quite high sensitivity to changes in virus exposure when a person approaches or moves away from another person. If this is reflected in behavior and the same risk acceptance criterion applies, participants who are more sensitive to distance may take less risks than the majority of the participants.
We selected all problems with the distance doubled or halved as diagnostic because they are easy to judge by rules following Equation (1) with the exponent both 1.0, the linear rule and 2.0, the quadratic rule. The diagnostic problems are 1, 4, 5, 9, 10, 13, 14 and 18 (Table 2). The results showed that the linear ratio rule with n=1 was used systematically in at least 7 of these 8 problems by 19 (22%) of the participants. The quadratic rule was not used systematically and only one person had as many as 5 of 8 judgments predicted by the quadratic rule.
The earlier analyses of group data showed that most judgments were less sensitive to change of distance than the quadratic rule. Therefore, we searched for individuals who systematically underestimated the change in virus exposure following a change of interpersonal distance. We analyzed separately judgments for decreasing and increasing distance. If 8 or 9 out of the 9 judgments in each condition underestimated the change of virus exposure after change of distance compared with the quadratic function, we characterized this person as less sensitive than the quadratic function. In the decrease condition, there were 35 participants who underestimated systematically the effect of a change of distance on exposure. In the increase distance condition, 40 participants underestimated systematically this effect. Among these participants there were 25 who underestimated the effect of distance for both decreasing and increasing distances. Note that the 19 participants who used a linear ratio rule and therefore underestimated the effect of changing distance were also included in this analysis. In summary, 50 (57%) of the participants underestimated systematically the effect of an increase or decrease of interpersonal distance on change of virus exposure.
The results show that, in relation to the REM model, most participants underestimated the change in virus exposure following a change of inter personal distance. The range of judgments revealed quite different cognitive relationships between distance and virus exposure. One may criticize the normative model used here on factual or evaluative grounds. The REM model predicts square functions of distance for exposure. This model may underestimate the exposure increase when a person moves closer than 0.4 m to another person and overestimate the exposure decrease for distances over 1.5 to 2 m. Considering the risk of infection and distance, Setti and colleagues (2020), basing their conclusions on hospital data found that even 2 meters without a mask is not enough for protection against infection, while Lonergan (2020) considers the increase in risk of infection from 1 to 2 m without a mask as marginal and not worthy of considering. However, at the population level, small and uncertain contributions should not be neglected and Chu and colleagues (2020) concluded that the small additional infection risk at 2 m compared with 1 m is also important.
From a psychological perspective, a way of thinking that leads to greater interpersonal distance and greater protective behavior is to be preferred over thinking that distance is unimportant and that a move to closer interpersonal distance does not matter. In other words, a function with a greater exponent in Equation (2) is preferable to a function with a smaller exponent because the former indicates greater sensitivity to distance and can be coupled with an incentive to keep a longer distance and thereby less risk in interpersonal face to face interactions. However, although less likely, a person whose judgments are described by n=1 in Equation (2) may want to move further away from another person to be sufficiently safe compared with a person described by n=2 provided they both apply the same safety criterion. Only empirical studies of behavior can tell us if a person who follows the REM model will prefer to be further away from another person than a person with judgments following a linear function. The effect of aerosols should not be neglected, since they reach far and stay in the air for a long time. Hence, people also need to know that longer conversations emitting aerosols in a closed environment can lead to ambient concentrations of aerosols in the air that no distance can compensate for. The present study indicates that many people may underestimate the increase in virus exposure and risk if moving closer than 6 feet from each other in a conversation. This is important to know for authorities who inform, recommend and regulate behavior in a pandemic. People need to know the size of the protective effect of keeping face to face distance in their interactions with others.
The present study can be followed up along different routes of research. One leads to explorations of factors that affect judgments of exposure like time, time pattern of exposure and probability that a facing person is contagious. Another route involves risk communication: how to design information so that those who are less sensitive to the effect of interpersonal distance on exposure understand the importance of keeping interpersonal distance and avoiding environments with insufficient or no fresh air ventilation. The present study concerns cognitive judgments of Corona virus exposure and a third route of future investigations leads to studies of cognition, perception and behavior. Normal face to face distances vary with, e.g., culture and age, and it would be interesting to see how communications about Corona exposure and risks of infection affect behavior in different ethnic or social groups. To illustrate a behavioral study, one person facing another person could be told that the other person may be sick with Covid-19. The first person is then told to move in relation to the other person so that the virus exposure will be half or double the exposure compared with the first position. A further step along this route would be to include studies of interactions in different social settings and relationships between cognitive judgments and behavior in situations with risk for a Covid-19 infection.
Balachandar, S., Zaleski, S., Soldati, A., Ahmadi, G., & Bourouiba, L. (2020). Host-to-host airborne transmission as a multiphase flow problem for science-based social distance guidelines. International Journal of Multiphase Flow, 132, https://doi.org/10.1016/j.ijmultiphaseflow.2020.103439.
Bischoff, W. E., Swett, K., Leng, I., & Peters, T. R. (2013). Exposure to influenza virus aerosols during routine patient care. The Journal of infectious diseases, 207(7), 1037–1046.
Bjørn, E., & Nielsen, P. V. (2002). Dispersal of exhaled air and personal exposure in displacement ventilated rooms. Indoor air, 12(3), 147–164.
Bourouiba, L. (2020). Turbulent gas clouds and respiratory pathogen emissions: potential implications for reducing transmission of COVID-19. Jama, 323(18), 1837–1838.
Chu, D. K., Akl, E. A., Duda, S., Solo, K., Yaacoub, S., Schünemann, H. J., ... & Hajizadeh, A. (2020). Physical distancing, face masks, and eye protection to prevent person-to-person transmission of SARS-CoV-2 and COVID-19: a systematic review and meta-analysis. The Lancet. 395(10242), 1973–1987. https://www.thelancet.com/journals/lancet/article/PIIS0140-6736(20)31142-9/fulltext.
Crema, E. (2020). Not even the air of empty spaces is coronavirus free (Two meters is not a safe distance). https://arxiv.org/pdf/2006.08823.pdf.
Ebersbach, M., Lehner, M., Resing, W. C., & Wilkening, F. (2008). Forecasting exponential growth and exponential decline: Similarities and differences. Acta psychologica, 127(2), 247–257.
Fischhoff, B. (2020). Making Decisions in a COVID-19 World. JAMA, 324(2) 139–140. https://jamanetwork.com/journals/jama/fullarticle/2767028.
Lonergan, M. (2020). Even one metre seems generous. A reanalysis of data in: Chu et al.(2020) Physical distancing, face masks, and eye protection to prevent person-to-person transmission of SARS-CoV-2 and COVID-19. medRxiv. https://www.medrxiv.org/content/10.1101/2020.06.11.20127415v1
Morawska, L., & Cao, J. (2020). Airborne transmission of SARS-CoV-2: The world should face the reality. Environment International, 139, 1–3 . https://doi.org/1016/jenvint.2020.105730.
Mullet, E., & Cheminat, Y. (1995). Estimation of exponential expressions by high school students. Contemporary Educational Psychology, 20(4), 451–456.
Nielsen, P. V., Olmedo, I., de Adana, M. R., Grzelecki, P., & Jensen, R. L. (2012). Airborne cross-infection risk between two people standing in surroundings with a vertical temperature gradient. HVAC&R Research, 18(4), 552–561.
Poulton, E. C. (1989). Bias in quantifying judgements. New York, NY: Taylor & Francis.
Setti, L., Passarini, F., De Gennnaro, G., Barbieri, P., Perrone, M.G., Borelli, M.,Palmisani, J., Di Gilio, A., Piscitelli, P. & Miani, A. (2020) Airborne transmission route of Covid-19: Why 2 meters/6 feet of inter-personal distance could not be enough. International Journal of Environmental Research and Public Health, 17(8), 2932. https://doi.org/10.3390/ijerph17082932
Svenson, O. (1977). Intuitive extrapolation of a growth function. Scandinavian Journal of Psychology, 18(1), 339–344.
Svenson, O., & Borg, A. (2020). On the human inability to process inverse variables in intuitive judgments: different cognitive processes leading to the time loss bias. Journal of Cognitive Psychology, 32(3), 344–355.
Svenson, O., Gonzalez, N., & Eriksson, G. (2018). Different heuristics and same bias: A spectral analysis of biased judgments and individual decision rules. Judgment and Decision Making, 13, 401–412.
Tversky, A., & Kahneman, D. (1974). Judgment under uncertainty: Heuristics and biases. Science, 185(4157), 1124–1131.
Wagenaar, W. A., & Sagaria, S. D. (1975). Misperception of exponential growth. Perception & Psychophysics, 18(6), 416–422.
This study was supported by funds from the project Knowledge Resistance: Causes, Consequences and Cures at the Swedish Riksbankens Jubileumsfond (M18-0310:1) to Torun Lindholm Öjmyr and by Ola Svenson’s project Swedish Judgments at Decision Research.
Copyright: © 2020. The authors license this article under the terms of the Creative Commons Attribution 3.0 License.
This document was translated from LATEX by HEVEA.