Judgment and Decision Making, Vol. 16, No. 3, May 2021, pp. 743-765
Does a second offer that becomes irrelevant affect fairness perceptions and willingness to accept in the ultimatum game?Alisa Voslinsky*
Yaron Lahav#
Ofer H. Azar$
|
Abstract:
We develop a modified ultimatum game, in which the proposer gives two
offers, and the responder selects one offer out of the two without seeing
them. Then, the selected offer becomes the relevant offer, and the
unselected offer becomes the irrelevant one. Finally, the responder
evaluates the fairness of the pair of offers and makes a hypothetical
decision whether to accept or reject the relevant offer.
For most of our subjects, the level of the irrelevant offer positively
affects fairness perceptions and willingness to accept, even though the
irrelevant offer cannot be accepted. The reason is that the irrelevant offer does signal the proposer’s
intentions. Most responders give more weight to the relevant
offer than to the irrelevant offer in evaluating fairness and in the
willingness to accept. We call this effect the relevance effect.
This effect is expected when considering the willingness to accept. However, it
is unclear why the relevant offer should carry more weight when evaluating
fairness, because the proposer makes the two offers together without
knowing which one will become the relevant one. Therefore, this behavior
can be considered a bias in fairness evaluations.
Keywords: ultimatum game, fairness perceptions, irrelevant offer, intentions
1 Introduction
Choosing between alternatives is part of our daily routine. In many cases,
we see the consequences of both our chosen and unchosen options after
the decision has been made. In finance, for example, choosing a certain
portfolio implies giving up on some alternative investments. Time will
tell if our chosen investment turned out to be better than our alternative
or not. In some cases, information on the value of each alternative is
available only after one alternative becomes irrelevant.
In this paper, we modify the ultimatum game (Güth, Schmittberger & Schwarze, 1982) to study
how our willingness to accept offers is affected by offers we rejected and
are no longer available to us. In the original game, a proposer offers a
responder how to split a given amount of money and the responder is asked
to choose whether to accept or reject the offer. If the offer is accepted,
it is executed. If not, both the proposer and responder receive nothing.
The subgame-perfect Nash equilibrium of the game is that the proposer
demands the entire amount or the next highest possible amount, and the
responder accepts the offer. However, prior results show that responders
who receive offers lower than approximately 20% of the entire amount
often reject them (Zeelenberg & Beattie, 1997), thus rejecting an
opportunity to make a profit while punishing the proposer. Results from
experiments on standard ultimatum games (e.g., Güth et al., 1982; Roth et
al., 1991; Forsythe et al., 1994; Azar, Lahav & Voslinsky, 2015) show that on average,
proposers offer to responders roughly 30–40% of the given amount.
Branas-Garza et al. (2014) show that punishers can be either prosocial or
antisocial — unfair and spiteful.
As research on the ultimatum game evolved, evidence pointed mainly to
social preferences and emotions as reasons for the difference between
behavior and theory. Most of the studies on the ultimatum game propose (or
at least insinuate) that fairness plays an important role in this game.
Subjects expect to be treated fairly, and punish unfair behavior by
rejecting offers that they perceive as unfair, leaving the proposer to
receive nothing, at a cost to themselves. For example, Güth (1988), Straub
and Murnighan (1995), Brandts and Solà (2001), Falk, Fehr and Fischbacher (2003) and
Bereby-Meyer and Grosskopf (2004) found connections between fairness
levels of offers and willingness to accept. Moreover, responders are not
the only ones to expect fairness. Proposers also realize that unfair
proposals might be rejected, and allow themselves to be unfair when their
proposals cannot be fully observed. Bolton and Zwick (1995), Straub and
Murnighan (1995) and Dana, Weber, and Kuang, (2007) found that proposers are more
generous when they know their decisions can be observed by others.
Pillutla and Murnighan (1995), Straub and Murnighan (1995), Croson (1996),
Kagel, Kim and Moser (1996) and Rapoport, Sundali and Seale (1996) showed that proposers offer
lower amounts when the size of the divided amount is unknown. Finally,
fairness is relative. Novak, Page and Sigmund (2000), for example, show that
information on offers that were rejected in the past generate fair offers.
With regards to emotions that motivate behavior in the ultimatum game,
results point to anger (Pillutla & Murnighan, 1996), fear of rejection
(Kravitz & Gunto, 1992), sense of superiority (Hoffman et al., 1994) and
regret (Zeelenberg & Beattie, 1997; Martinez, Zeelenberg & Rijsman
2011). See Güth and Kocher (2013), Zeelenberg et al. (2000) and Martinez,
Zeelenberg and Rijsman (2008) for reviews.
In our modified game, the responder received two sealed offers from the
proposer and chose one of the offers as a relevant one before knowing
their content. The proposer had no control on which offer was selected by
the responder. Then, after both offers were revealed, the responder could
accept or reject only the relevant offer. The other offer became
irrelevant, but it could still reveal the intentions of the proposer, who
did not know it would become the irrelevant offer. The main objectives of
this study are to understand the effect of the irrelevant offer on
fairness perceptions and on the willingness to accept offers.
Some earlier studies modified the ultimatum game to have more than one
offer, one proposer or one responder, in different ways from ours.
Fischbacher, Fong and Fehr (2009) and Coats et al. (2013) introduced two
games with multiple proposers, showing that responders then demand higher
amounts, taking advantage of the increased competition on the responders’
willingness to accept. Bazerman, White and Loewenstein (1995) argued that
when evaluating multiparty transactions, people seem to compare their own
outcomes with those of others, which is also consistent with a competitive
environment. On the other hand, when the competition is among responders
(as in Knez & Camerer, 1995), and proposers make simultaneous offers to
two responders, perceived unfairness of the lower offer is increased.
As we explain below, our subjects were not paid based on their answers. A
large part of our study is about fairness perceptions, which are subjective
and known only to the subject and thus cannot be rewarded for
accuracy. Another part of our study is about decisions to accept or reject
offers. These could in principle be done with real incentives, but we
followed the survey methodology for consistency. (We discuss this issue
further in the conclusion section.) Accordingly, we evaluate intentions to
accept or reject offers rather than actual decisions about real money. The
literature, however, shows consistency between intentions and decisions.
Falk et al. (2013) measured social preferences using a lab experiment and
a survey taken one week later. They found a positive correlation between
the minimum acceptable offer in an ultimatum game as reported in the survey
and revealed from the lab experiment. Rustichini and Villeval (2014)
presented subjects with a hypothetical ultimatum game and elicit
participants’ fairness perceptions and hypothetical choices. One week
later, participants were invited to play the ultimatum game. Hypothetical
and real choices in the ultimatum game did not differ. These findings are
consistent with the general rule that the practical implications of actions
affect fairness judgments.1
2 Experimental
design and research questions
2.1 Participants
We conducted an Internet survey with 203 participants, using the Qualtrics
software. All participants were students at Ben-Gurion University of the
Negev from various disciplines, recruited by posting announcements on an
electronic university-wide message board. No individual filled out more
than one questionnaire. Among those completing the survey, prizes of 90 NIS
(approximately 26 US dollars at the time) were given by a lottery; the
chance to win was 1 to 10. All participants knew the size of the prize and
the chance of winning in advance. 54% of the participants were female, and
the age ranged between 18 and 52 (M = 25.40, SD = 3.40).
2.2 The questionnaire
The questionnaire contained three sections. One section consisted of the
standard ultimatum game (Güth et al., 1982), another section consisted of
the modified game we developed with two offers, and the last section
consisted of demographic questions and the lottery. Two versions of the
survey were circulated randomly to participants, differing by the order of
the two games. In each of the first two sections, after the instructions of
the game, we presented several questions to test the participants’
understanding of the instructions (included in the Appendix). Participants
had to answer all questions correctly to continue.
In the standard ultimatum game presented to the participants, the proposer
was given 100 coins and could choose to offer the responder 20, 30, 40, 50
or 60 coins. If the proposal was accepted, it was executed, and if the
proposal was rejected, both players got nothing. In the modified game, the
proposer was also endowed with 100 coins, and made two different offers,
also among the options of 20, 30, 40, 50 and 60 coins. Then, before the
offers were revealed, the responder selected one of them. The chosen offer
became the relevant offer, and the other one became the irrelevant offer.
Then, both offers were presented to the responder, who then decided
whether to accept or reject the relevant offer.
After the rules of the games were explained, participants were asked
several hypothetical questions about their behavior if they were to
participate in such games. In particular, they had to decide for each
possible offer, or, in the modified game, for each possible pair of offers
(one of which became the relevant offer), whether to accept the offer or
not, and to evaluate how fair the proposer was. Fairness was rated on a
scale of 1 = “very unfair” to 7 = “very fair”.
In the second section, participants who started with the standard game
continued with the modified game and vice versa. In the standard game,
participants were asked to evaluate the five possible offers, and in the
modified game, they were asked to evaluate the 20 possible pairs of
offers. In total, 25 offers and pairs of offers were presented to each
participant. Finally, the third section presented several general
demographic questions (e.g., gender and age) and subjects were invited to
participate in a lottery, where they could win a prize of 90 NIS.
2.3 Research questions
As we explained above, our questionnaire elicited two types of information:
fairness perceptions and willingness to accept. Our first two questions
concern the effect of the irrelevant offer on fairness perceptions and the
willingness to accept offers. Although an irrelevant offer cannot be
accepted, it does signal intentions. For example, the fairness perception
of a relevant offer to give 40% should be evaluated higher when the
irrelevant offer is to give 50%, compared to an irrelevant offer to give
20% because on average, the proposer is more generous. Similarly,
responders may be more willing to accept an offer to receive 30% when the
irrelevant offer is to receive 40%, compared to the case where the
irrelevant offer is to receive 20%.
Both the relevant and the irrelevant offers should reflect the proposer’s
intentions evenly, as there is an equal chance for each proposal to be
selected and become relevant and the proposer had no influence on that
choice. Therefore, both fairness perception and the willingness to accept
offers should not depend on the choice of the relevant offer. Our first
research question deals with the fairness perceptions:
Do responders attribute an equal weight to both the relevant and
irrelevant offers when forming fairness perceptions?
The second research question similarly examines the difference between the
two offers but it deals with the willingness to accept the offer:
Do responders attribute an equal weight to both the relevant and
irrelevant offers when choosing whether to accept or reject the relevant
offer?
Previous studies on the ultimatum game suggest that choices are consistent
with fairness perceptions (Straub & Murnighan, 1995; Pillutla &
Murnighan, 1996; Zeelenberg & Beattie, 1997; Güth, 1988). Therefore, we
should observe a positive relationship between the fairness perception of
offers and the willingness to accept them in both versions of the game.
Examining if this is indeed the case leads to our third research question:
Is the willingness to accept offers positively correlated with
fairness perceptions?
3 Results and discussion
With a total of 203 participants in the survey, our data include 203 sets
of fairness perceptions (each set with judgments of 20 offers of the modified
game and 5 offers of the standard game) and 203 sets of hypothetical
choices of willingness to accept an offer (each set with 20 choices of the
modified game and 5 choices of the standard game). We define the games
where proposers propose one offer as “standard games”. Offers in the
standard games are “standard offers”. Games where proposers propose two
alternative offers are “modified games”, and each pair of offers is a
“modified offer”, which includes a relevant offer that the responder chose,
and an irrelevant offer.
Table 1 presents descriptive statistics of some relevant variables, divided
by the game type (modified or standard). Willingness to accept is
calculated as the percentage of offers that were hypothetically accepted
across all responders, and fairness perceptions are calculated as the
average of fairness perceptions on a 1–7 scale.
| Table 1: Fairness perceptions and hypothetical choices. “Willingness to accept rate”
is the percentage of hypothetically accepted offers among all
subjects. “Fairness perceptions” is the average evaluation of fairness on a
1–7 scale among all subjects. |
| Variable | Observations | Mean | Std. Dev. |
| Willingness to accept rate in the modified game | 4,060 | 84% | 0.37 |
| Willingness to accept rate in the standard game | 1,015 | 82% | 0.39 |
| Fairness perceptions in the modified game | 4,060 | 4.32 | 1.89 |
| Fairness perceptions in the standard game | 1,015 | 4.33 | 2.18 |
According to Table 1, the summary values of both willingness to accept and
fairness perceptions are similar between the standard and modified games.
As mentioned earlier, some participants started the survey with the
standard game and continued with the modified game, while others answered
the survey in the reverse order. We tested the game order effect and the
effect of demographic variables (e.g., gender, age, education, place of
residence) on hypothetical choices and on fairness perceptions, and found
no order or demographic effects on both.
3.1 Fairness perceptions

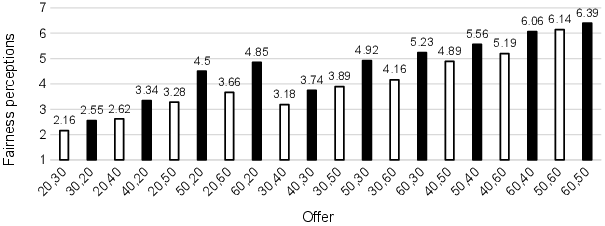
| Figure 1: Average fairness perceptions conditional on relevant and
irrelevant offers. The white bars are the data of the modified game and the black bars are
the data of the standard game. The modified game offers are structured as
follows: The first (i.e., left or bottom) number is the relevant offer
amount to the responder and the second number is the irrelevant offer
amount to the responder. For example, 20,30 is 20 to the responder as a
relevant offer and 30 to the responder as an irrelevant offer. The
standard game offer structure is: The number is an offer amount to the
responder. |
Figure 1 presents the average fairness perceptions for each pair of
modified offers, except for the black bars, which presents average
fairness perceptions of standard offers. The white bars are the data of
the modified game and the black bars are the data of the standard game. In
the data from the modified game, the left number is the relevant offer
amount. For example, 20,30 is 20 to the responder as a relevant offer and
30 to the responder as an irrelevant offer. Figure 1 shows that the
relevant offer is positively correlated with fairness perception. However,
they also show that fairness perception in the modified game is affected
by irrelevant offers as well. A higher irrelevant offer increases fairness
perception of the relevant offer. In the standard game, as expected,
fairness perception is increasing with the offer amount.
Symmetric offers in the modified game are pairs of the same two offers, but
in which the relevant offer in one pair is the irrelevant offer in the
other. Figure 1 shows that there are differences in average fairness
perceptions of symmetric offers. For example, the average fairness
perception of the offer (20,40) is 2.62, whereas the average perception of
the offer (40,20) is 3.34. The data suggest that while both relevant and
irrelevant offers affect fairness perceptions, the effect of the relevant
offer is higher.
To test the effect of irrelevant offers on fairness perception, we first
counted the cases where responders’ fairness perception of a standard offer
equals their fairness perception when that offer is relevant in a modified
offer. In roughly two-thirds (64%) of the standard offers, fairness
perception is different compared to the same amount offered as relevant in
a modified offer. A binomial test for the effect of irrelevant
offers on fairness perceptions rejected the possibility
that the alternative offer does not affect fairness perception (p
< .001).
We also counted the number of cases where fairness perceptions to all
modified offers with the same relevant offer were the same (i.e., cases
where irrelevant offers do not affect fairness perception in modified
offers). Here, 71% of related pairs are evaluated unequally. Again, a
binomial test rejected the possibility that fairness perception is
determined based solely on relevant offers (p < .001).
Further, only 36 participants (18%) evaluate fairness equally among all
related pairs and for all relevant offers. These participants do not
consider irrelevant offers when forming fairness perceptions. Eight of
these subjects, however, evaluated the fairness of all offers identically,
which may indicate that they consider neither the relevant nor the
irrelevant offer amounts.
In sum, our findings thus far suggest that fairness perceptions depend also
on irrelevant offers among the majority of our subjects. Our next step is
to test if both relevant and irrelevant offers affect fairness perceptions
equally. To analyze the attribution of both relevant and irrelevant offers
to fairness perception, we regressed fairness perception on both relevant
and irrelevant offers (with individual random effects). The coefficients
for the relevant offer and the irrelevant offer are 0.084 and 0.047
respectively, both significant at the 1% level and significantly different
(a Wald test shows significant inequality at the 1% level). These figures
suggest that individuals give the relevant offer almost double the weight
of the irrelevant offer: an increase of 10 coins in the relevant offer
increases fairness perception by more than 0.8, while the same increase in
the irrelevant offer increases fairness perception by less than 0.5. This
finding suggests that subjects value relevant offers much more than
irrelevant offers when evaluating fairness, in spite of their knowledge
that the proposer had no control over what offer would be relevant. We
refer to this type of behavior as the relevance effect: the
tendency to pay more attention to relevant offers, although their relevance
is coincidental. As a robustness test, we also conducted the same
estimation for each relevant and irrelevant offer separately, and the
results are preserved. We conclude that the effect of both the relevant and
irrelevant offers on fairness perception is independent of the value of the
relevant or irrelevant offer.
We also regressed fairness perception on offers in the standard game. The
coefficient is 0.122, significant at the 1% level. Interestingly, in the
standard game, an increase of 10 coins in the offer increases fairness
perception by 1.2, the sum of both coefficients in the modified game. This
means that an increase of 10 coins to an offer in the standard game and an
increase of 10 coins to both relevant and irrelevant offers in the
modified game have the same effect on fairness perceptions.
Figure 2 shows the fairness perceptions of symmetric offers. Figure 3 shows
the average differences in fairness perceptions between symmetric pairs
with the same difference between relevant and irrelevant offers. Figure 3
shows an expected increasing trend. Considering that responders attribute
more weight to relevant offers, then higher differences between the
relevant and irrelevant offer generate higher differences in fairness
perceptions. The concavity of the curve in Figure 3 implies that there is
a diminishing effect of the difference between relevant and irrelevant
offers on fairness perception.
| Figure 2: Fairness perceptions of symmetric offers.
The black bars represent the average fairness perceptions of a modified
offer with the higher offer being the relevant offer. The white bars
represent the average fairness perceptions of a symmetric offer (with the
lower offer being the relevant offer). |
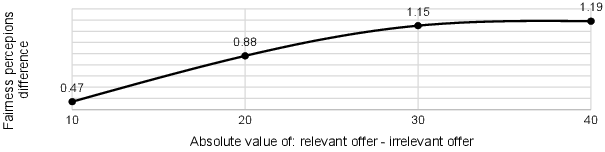
| Figure 3: Differences in fairness perceptions between symmetric offers.
“Fairness perceptions difference” is the average fairness perceptions of a
modified offer minus the average fairness perceptions of a symmetric
offer. |
Figure 4 provides more detailed information compared to Figure 3, with
differences of fairness perception for each symmetric offer. The figure
shows a parabolic relationship between differences in fairness perception
and offers level. For a given difference between a modified offer and its
symmetric offer, difference in fairness perception is low when either both
offers are low (e.g. 20, 30) or both offers are high (e.g. 50, 60). The
reason for this exception is that responders perceive both offers 20 and
30 as unfair, while both 50 and 60 as fair. 10 paired t-tests
for the difference between fairness perceptions of symmetric offers for
each pair of modified and symmetric offers show significant difference for
every pair (p < .001).
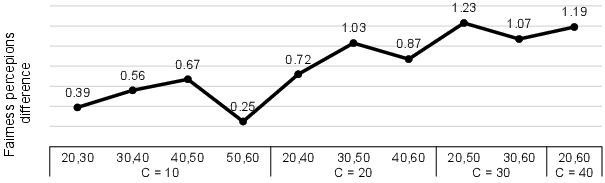
| Figure 4: Difference in fairness perceptions between symmetric pairs, per
offer. “Fairness perceptions difference” is the average fairness perception of a
“modified offer” minus the average fairness perceptions of a “symmetric
offer”, for every symmetric pair, visually delimited by C, where C = 10,
20, 30, 40. |
3.2 The willingness to accept
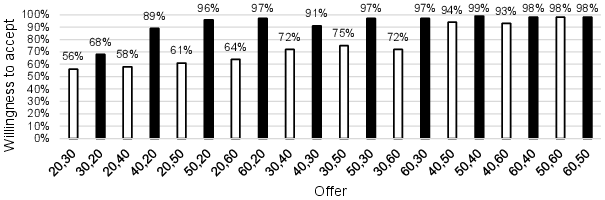
We now turn to analyze responders’ willingness to accept offers. We
calculate the acceptance rate (or “willingness to accept”) of each offer
as the number of responders who accepted that offer, divided by the total
number of responders. Figure 5 presents these acceptance rates. The black
bars of Figure 5 show acceptance rates of standard offers. The white bars
of Figure 5 show acceptance rates of modified offers. Figure 5 shows
similar trends to the ones we observed in fairness perceptions: the
willingness to accept is increasing with both relevant and irrelevant
offers. In the standard game, the willingness to accept is positively
correlated with offers, with an exception of the offer (60), which is
slightly lower than (50). Figure 5 also shows differences between the
acceptance rates of symmetric offers. For example, the acceptance rate of
(20,30) is 56%, and 68% for (30,20). The willingness to accept standard
offers of 40, 50 and 60 or modified offers with the same relevant offers
is relatively high and ranges between 89%-99%. These findings are in
line with previous studies on ultimatum games showing high acceptance
rates for offers of more than 30% (Zeelenberg & Beattie, 1997).
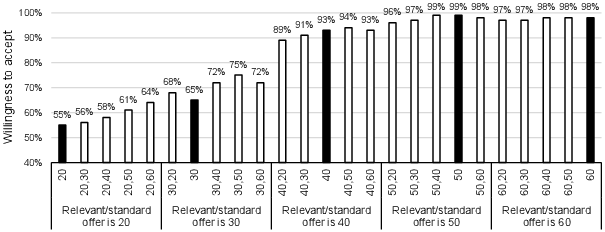
| Figure 5: Average rates of willingness to accept. The white bars represent
the modified game and the black bars represent the standard game. |
We first tested the effect of an irrelevant offer on the willingness to
accept by comparing responders’ decisions to accept standard offers with
their decisions to accept modified offers with the same relevant offers.
We find that in 8.5% of the decisions, responders decided differently when
presented with a standard offer and when presented with that same offer as
the relevant one in the modified game. We denote such cases as
“inconsistent decisions” and refer to them in more details
below. Inconsistent decisions are not irrational for a decision-maker whose
utility function includes fairness concerns, because the irrelevant offer
that exists in the modified game can affect the perceived fairness of the
proposer and therefore can result in a different decision about the
relevant offer compared to the same offer in the standard game. The rate of
inconsistent decisions for each standard offer is 13.0%, 16.4%, 7.6%,
3.6%, 2.1% for standard/relevant offers 20, 30, 40, 50 and 60
respectively (all significantly higher than zero using a one-sided binomial
test, with p <.001). According to our results, while
irrelevant offers affect the willingness to accept in general, most of the
decisions to accept a standard offer are the same as the decisions to
accept the same relevant offer in the modified game. While most of our
subjects considered standard offers to be fairer than modified offers with
the same relevant offer and a lower irrelevant offer, they were inclined to
accept both. This tendency to accept is diminishing with lower offers.
Figure 5 shows different values of willingness to accept for a given value
of relevant offer. We define a “decision set” as a group of all offers with
the same relevant offer. Note that there are five decision sets for each
responder. There are inconsistent decisions in 10% of the decision
sets. Further, 52 participants (25% of total) made identical
decisions in all their decision sets. These responders chose whether to
accept a relevant offer regardless of the irrelevant offers.
To analyze the effect of both relevant and irrelevant offers on the
willingness to accept, we regressed the willingness to accept on both
relevant and irrelevant offers (with individual random effects). The
coefficients for the relevant offer and the irrelevant offer are 0.010 and
0.001 respectively, both significant at the 1% level, and significantly
different (A Wald test shows significant inequality at the 1%). While both
relevant and irrelevant offers affect the willingness to accept, the
relevant offer predicts willingness to accept about ten times as much as
the irrelevant offer, which confirms the relevance
effect. Similarly to fairness perception, when forming willingness to
accept subjects pay more attention to the relevant offer, although the pair
of offers were made by the same proposer without knowledge about what offer
will become relevant.
The higher importance of the relevant offer is much more pronounced in
forming willingness to accept compared to the fairness perception. This
difference can be justified by the fact that willingness to accept is
affected by economic considerations (either receiving or not the proposed
offer), while fairness perception is not. Therefore, the relevant offer is
the only thing that matters when making a purely economic decision. The
irrelevant offer can signal intentions and therefore affect fairness
perception, but does not affect the forgone earnings in case of rejecting
the offer. In fact, the differences between Figure 1 and Figure 5 may
serve as evidence that, when deciding to accept an offer, proposer’s
intentions are irrelevant, while they become relevant in non-economic (or
social) decisions such as evaluating fairness.
As a robustness test, we also conducted the same estimation for each
relevant and irrelevant offer separately, and the results are preserved.
However, these additional regressions show that the effect of the
irrelevant offer on the willingness to accept is decreasing with the size
of the relevant offer. This suggests that when the relevant offer is
generous enough, responders care less about intentions as they are
reflected in the irrelevant offer. In contrast, the effect of the relevant
offer is relatively stable and is not affected by the level of the
irrelevant offer.
We also regressed the willingness to accept on standard offers in the
standard game. The coefficient is 0.012, significant at the 1% level.
Similarly to the regression results for fairness perception, it seems that
an increase of 10 coins in the standard game and an increase of 10 coins
in both relevant and irrelevant offers in the modified game have the same
effect on the willingness to accept the offer.
Figure 6 presents the willingness to accept symmetric offers. Black bars
represent modified offers with the relevant offer being the higher offer,
and white bars represent their symmetric offers. Comparing each white bar
to the black bar on its right, we can see that when both offers are 40 or
higher, acceptance rates are very high and therefore the difference in
acceptance rates between symmetric offers is small. When one of the offers
is 30 or 20, however, the difference between the symmetric offers becomes
much more pronounced.
| Figure 6: Willingness to accept of symmetric offers. The black bars are the
average willingness to accept when the higher offer is the relevant offer
(“modified offer”). The white bars represent the average willingness to
accept when the lower offer is the relevant offer (“symmetric offer”). |
Figure 7 provides differences in willingness to accept between symmetric
offers, this time divided by the difference between the relevant and
irrelevant offer. Similar to Figure 3, the graph shows a positive and
diminishing effect of the difference between relevant and irrelevant
offers on the willingness to accept. Figure 8 provides more detailed
information compared to Figure 7, with differences of willingness to
accept for each symmetric offer. Unlike the parabolic relationship between
fairness perception and differences between modified offers, Figure 8
shows mostly a decreasing trend. This observation is consistent with our
previous finding that subjects are willing to accept offers that they
perceive as unfair.
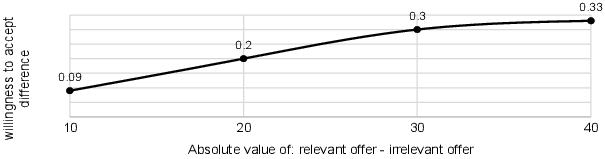
| Figure 7: Differences in willingness to accept between symmetric
offers. “Willingness to Accept difference” is the average willingness to
accept of a “modified offer” minus the average willingness to accept of a
“symmetric offer”. |
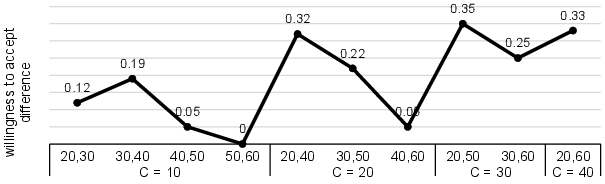
| Figure 8: Difference in willingness to accept between symmetric pairs, per
offer. “Willingness to Accept difference” is the average willingness to
accept a “modified offer” minus the average willingness to accept a
“symmetric offer”, for every symmetric pair, visually delimited by C, where
C = 10, 20, 30, 40. |
3.3 The effects of fairness perceptions on the
willingness to accept
In this subsection, we test the effect of fairness perceptions on the
willingness to accept, using a linear probability model (LPM) regression,
where the dependent variable is the willingness to accept and the
independent variable is the fairness perception. Because the relationship
between these two variables is likely to be different for different
offers, we ran these regressions also for subset. We conducted several
regressions, presented in Table 2: pooled over the entire data of the
modified game (row 1); for each relevant offer (rows 2–6) and for each
irrelevant offer (rows 7–11) of the modified game; pooled over the entire
data of the standard game (row 12); and for each offer in the standard
game (rows 13–17).
| Table 2: Results of regressions for each set and subset — the effect of
fairness perceptions on willingness to accept. |
| Row | Game | Offers considered | β |
| 1 | Modified | All | 0.0827*** |
| 2 | Modified | Relevant = 20 | 0.0668*** |
| 3 | Modified | Relevant = 30 | 0.0648*** |
| 4 | Modified | Relevant = 40 | 0.0268*** |
| 5 | Modified | Relevant = 50 | 0.0132** |
| 6 | Modified | Relevant = 60 | 0.0050* |
| 7 | Modified | Irrelevant = 20 | 0.0676*** |
| 8 | Modified | Irrelevant = 30 | 0.0912*** |
| 9 | Modified | Irrelevant = 40 | 0.0964*** |
| 10 | Modified | Irrelevant = 50 | 0.0976*** |
| 11 | Modified | Irrelevant = 60 | 0.1010*** |
| 12 | Standard | All | 0.0912*** |
| 13 | Standard | 20 | 0.1124*** |
| 14 | Standard | 30 | 0.1105*** |
| 15 | Standard | 40 | 0.0641*** |
| 16 | Standard | 50 | -0.0064 |
| 17 | Standard | 60 | 0.0188** |
| The table reports the coefficient of the fairness rating
in a regression with “willingness to accept” as the dependent variable.
The regressions include subject random effects, except for the offers 50
and 60, because when the willingness to accept rates are 98% and 99%,
the variance is not sufficient. ***, **, and ***, represent
10%, 5% and 1% levels of significance, respectively. |
The results of the modified game show clearly that the willingness to
accept is an increasing function of the fairness perception. Overall, an
increase of 1 unit in fairness perception, increases the willingness to
accept an offer by 8.3%. The results in rows 2–6 show that the effect of
fairness perception decreases with the relevant offer. This finding is
consistent with our previous finding that high relevant offers are
accepted by most subjects, regardless of irrelevant offer values (i.e.
fairness perception). When regressions are conducted for each level of
irrelevant offer, the effect of fairness perception on the willingness to
accept is fairly stable (with one exception when the irrelevant offer is
20).
In the standard game, on average (row 12), the effect of fairness
perception on willingness to accept an offer is slightly higher than that
of the modified game (difference is significant at the 5% level using a
Wald test): an increase of 1 unit in fairness perception, increases the
willingness to accept an offer by 9.1%. However, it is more pronounced in
low offers (rows 13–14) than in higher offers (rows 15–17). This finding
also demonstrates the tendency of subjects to think more economically and
less emotionally when higher offers are on the table and give up on social
preferences such as fairness.
4 Conclusion
We explored the effect of an irrelevant alternative on fairness perceptions
and acceptance decisions in an ultimatum game, using an online survey. The
survey presented two game types, the standard ultimatum game and the
modified ultimatum game we invented. During the survey, participants
stated their fairness perceptions and hypothetical acceptance decisions
for each game type. In the modified game, the proposer gave two offers and
the responder selected one of them as relevant (without seeing the offers
before selecting), and the other offer became irrelevant. Then, after
observing both offers, the responder was asked to evaluate the fairness of
the proposer and to make a hypothetical decision whether to accept or
reject the relevant offer.
We found that in the modified game, the irrelevant offer positively
affected fairness perceptions and willingness to accept, even though this
offer could not be received. We argue that this happens because the
irrelevant offer still signaled the intentions of the proposer, who did
not know that this offer would become irrelevant. However, responders gave
more weight to the relevant offer than to the irrelevant offer in
evaluating fairness and in choosing whether to accept the offer. We call
this effect the relevance effect. We found that this
relevance effect is different between economic choices (whether
to accept the relevant offer) and social preferences (rating the
proposer’s fairness). Our findings show that the
irrelevant offer affects fairness evaluations more strongly than it
affects the willingness to accept offers.
The stronger effect of the relevant offer compared to the irrelevant offer
is expected when considering the willingness to accept, but it is less
natural in evaluating the offers’ fairness and can be considered a bias in
fairness evaluation. The reason is that the proposer makes the two offers
simultaneously without knowing which one will become the relevant one; the
division to relevant and irrelevant offers is arbitrarily made as a blind
choice of the responder. Therefore, it is not clear why the relevant offer
should affect fairness perceptions almost twice as much as the irrelevant
offer. It seems that responders consider the economic consequences of
the offer and thus discount the offer that is no longer relevant compared
to the offer that is relevant, even when judging the fairness of the
proposer, who made the two offers when their role was the same and both
could become relevant. In other words, a person’s fairness is judged not
only by his intentions but also by the resulting state of the world, on
which this person did not have full control. This is similar to rating a
person who shot another person and killed him as more evil than someone who
shot another person and missed. Although the intentions of both were the
same, the outcome of whether the shot killed or missed affects the judgment
about this person.
Regarding the decision whether to accept the offer, it is reasonable to
give more weight to the relevant offer than to the irrelevant offer, as we
found. Rejecting the offer punishes the proposer, who gets nothing. The
cost of this punishment, however, is that the responder gives away what he
was offered in the split. The relevant offer affects both the fairness of
the offer and the cost of punishment — a higher relevant offer means the
responder gives away more if he decides to punish. The irrelevant offer,
however, affects the offer’s fairness but not the cost of punishment. It
therefore makes sense that the relevant offer will have more effect than
the irrelevant offer on the decision whether to accept the offer. For
example, an offer of (20, 40) (where the order does not indicate anything)
may be perceived as relatively unfair. If the responder is willing to bear
a cost between 20 and 40 to punish the unfairness of this offer, he will
reject it if the relevant offer turns out to be 20, but not if the relevant
offer becomes 40. That is, an asymmetry between the relevant and irrelevant
offers can be justified when we consider the willingness to
accept. Finally, our data also show that fairness perceptions are
positively correlated with willingness to accept offers.
There are several limitations to this current study and directions for
future research. One issue is the financial incentives that the
participants have.2 The part that measures
fairness perceptions is problematic to do with incentives that are based
on performance, because it elicits subjective perceptions, that the
experimenter does not know and therefore cannot pay the participant based
on how accurate his responses are. The part that elicits decisions about
willingness to accept can be done with incentives, but we wanted to keep
the experimental design reasonable and not too complex, and keep the data
we gather for the fairness perceptions and the acceptance decisions
comparable. However, conducting a separate experiment, without fairness
evaluations, that uses our modified game as an incentivized experiment,
does seem like a worthwhile idea for future research, and comparing
between the results in such experiment to our findings about willingness
to pay may also provide interesting insights. On the other hand, the
results discussed in the last paragraph suggest that the average subject
did think about the (hypothetical) economic effects as if they were real.
We do not say explicitly whether the proposer knows which of the two offers
becomes the relevant one. This should not affect the fairness evaluations,
but it may affect the willingness to accept, since rejection would be more
informative to the proposer about what sort of offer is
acceptable. Consequently, an idea for future research is to conduct an
experiment that will manipulate the information provided to the responder
about whether the proposer gets to know the relevant offer, and examine how
this information affects the results.
Another idea for future research is to ask subjects for their opinion about
how fairness evaluations of the proposer should be formed, and then let
them make decisions similar to our experiment. This can tell us whether
explicit thinking about what should matter helps subjects to overcome the
tendency to give the relevant offer more weight in judging the
proposer’s fairness.
Finally, another interesting direction for future research is to examine to
what extent the behavior we documented occurs in other experimental games.
That is, modifying other games in such a way that one player makes a
decision that can result in different outcomes according to chance, and
examining whether perceptions of this decision or this player (not only
about fairness but also about trustworthiness, altruism, intelligence,
morality, etc.) are evaluated differently by others depending on the
outcome. That is, do raters who are given different information about the
resulting state of the world evaluate the initial decision or the decision
maker differently (even though the decision maker could not anticipate
which state will be chosen by chance), and do they evaluate the decision
or decision maker differently from raters who are not told what the
eventual state of the world is.
References
Azar, O. H., Lahav, Y., & Voslinsky, A. (2015). Beliefs and social
behavior in a multi-period ultimatum game. Frontiers in Behavioral
Neuroscience, 9, article 29, 1–11.
Bazerman, M. H., White, S. B., & Loewenstein, G. F. (1995). Perceptions of
fairness in interpersonal and individual choice situations.
Current Directions in Psychological Science, 4(2), 39–43.
Bereby-Meyer, Y., & Grosskopf, B. (2004). How manipulable are fairness
perceptions? The effect of additional alternatives. In Inequality,
welfare and income distribution: Experimental approaches (pp. 43-53).
Emerald Group Publishing Limited.
Bolton, G. E., & Zwick, R. (1995). Anonymity versus punishment in
ultimatum bargaining. Games and Economic Behavior, 10, 95–121.
Brañas-Garza, P., Espín, A., Exadaktylos, F., & Herrmann, B. (2014). Fair
and unfair punishers coexist in the Ultimatum Game. Scientific
Reports, 4, article 6025, 1–4.
Brandts, J., & Solà, C. (2001). Reference points and negative reciprocity
in simple sequential games. Games and Economic Behavior, 36,
138–157.
Coats, J. C., Hannan, R. L., Rankin, F. W., & Towry, K. L. (2013). Does
reciprocity have a dark side? Behavior in ultimatum games with multiple
proposers. Working paper.
Croson, R. T. A. (1996). Information in ultimatum games: An experimental
study. Journal of Economic Behavior and Organization, 30,
197–212.
Dana, J., Weber, R. A., & Kuang, J. X., (2007). Exploiting moral wiggle
room: experiments demonstrating an illusory preference for fairness.
Economic Theory, 33(1), 67–80.
Falk, A., Becker, A., Dohmen, T., Huffman, D., & Sunde, U. (2013). An
Experimentally validated preference survey module. University of
Bonn, Germany.
Falk, A., Fehr, E., & Fischbacher, U. (2003). On the nature of fair
behavior. Economic Inquiry, 41(1), 20–26.
Fischbacher, U., Fong, C. M., & Fehr, E. (2009). Fairness, errors and the
power of competition. Journal of Economic Behavior &
Organization, 72(1), 527–545.
Forsythe, R., Horowitz, J., Savin, N. E., & Sefton, M. (1994).
Replicability, fairness and pay in experiments with simple bargaining
games. Games and Economic Behavior, 6(3), 347–369.
Güth, W. (1988). On the behavioral approach to distributive justice: A
theoretical and experimental investigation. In S. Maital (Ed.),
Applied Behavioral Economics (pp. 703–717). New York,
NY: New York University Press.
Güth, W., & Kocher, M. G. (2013). More than thirty years of
ultimatum bargaining experiments: Motives, variations, and a survey of the
recent literature. Jena Economic Research Papers (No. 2013-035).
Güth, W., Schmittberger, R., & Schwarze, B. (1982). An experimental
analysis of ultimatum bargaining. Journal of Economic Behavior and
Organization, 3, 367–388.
Hoffman, E., McCabe, K., Shachat, K., & Smith, V. (1994). Preference,
property rights, and anonymity in bargaining games. Games and
Economic Behavior, 7, 346–380.
Kagel, J. H., Kim, C., & Moser, D. (1996). Fairness in ultimatum games
with asymmetric information and asymmetric payoffs. Games and
Economic Behavior, 13, 100–110.
Knez, M. J., & Camerer, C. F. (1995). Outside options and social
comparison in three-player ultimatum game experiments. Games and
Economic Behavior, 10(1), 65–94.
Kravitz, D. A., & Gunto, S. (1992). Decisions and perceptions of
recipients in ultimatum bargaining games. The Journal of
Socio-Economics, 21 (1), 65–84.
Martinez, L. F., Zeelenberg, M., & Rijsman, J. B. (2008). Why valence is
not enough in the study of emotions: Behavioral differences between regret
and disappointment. Psicologia, 22(2), 109–121.
Martinez, L. M., Zeelenberg, M., & Rijsman, J. B. (2011). Behavioural
consequences of regret and disappointment in social bargaining games.
Cognition and Emotion, 25(2), 351–359.
Novak, M. A., Page, K. M., & Sigmund, K. (2000). Fairness versus reason in
the ultimatum game. Science, 289, 1773–1775.
Pillutla, M. M., & Murnighan, J. K. (1995). Being fair or appearing fair:
Strategic behavior in ultimatum bargaining. Academy of Management
Journal, 38, 1406–1428.
Pillutla, M. M., & Murnighan, J. K. (1996). Unfairness, anger, and spite:
emotional rejections of ultimatum offers. Organizational Behavior
and Human Decision Processes, 68(3), 208–224.
Rapoport, A., Sundali, J. A., & Seale, D. A. (1996). Ultimatums in
two-person bargaining with one-sided uncertainty: Demand games.
Journal of Economic Behavior & Organization, 30(2), 173–196.
Roth, A. E., Prasnikar, V., Okuno-Fujiwara, M., & Zamir, S. (1991).
Bargaining and market behavior in Jerusalem, Ljubljana, Pittsburgh, and
Tokyo: An experimental study. The American Economic Review,
81(5), 1068–1095.
Rustichini, A., & Villeval, M. C. (2014). Moral hypocrisy, power and
social preferences. Journal of Economic Behavior &
Organization, 107, 10–24.
Slonim, R., & Roth, A. (1998). Learning in high stakes ultimatum games: An
experiment in the Slovak Republic. Econometrica, 66(3),
569-596.
Straub, P. G., & Murnighan, J. K. (1995). An experimental investigation of
ultimatum games: Information, fairness, expectations, and lowest
acceptable offers. Journal of Economic Behavior and Organization,
27, 345–364.
Voslinsky, A., & Azar, O. H. (2021). Incentives in experimental economics.
Journal of Behavioral and Experimental Economics, 93,
article 101706, 1–6.
Zeelenberg, M., & Beattie, J. (1997). Consequences of regret aversion 2:
Additional evidence for effects of feedback on decision making.
Organizational Behavior and Human Decision Processes, 72(1),
63-78.
Zeelenberg, M., van Dijk, W. W., Manstead, A. S. R., & van der Pligt, J.
(2000). On bad decisions and disconfirmed expectancies: The psychology of
regret and disappointment. Cognition & Emotion, 14(4), 521–541.
Appendix: Text of the survey (translated from Hebrew)
Preface
Hello,
My name is Alisa, I am a Ph.D. student at Ben-Gurion University of the
Negev. This survey is part of a research in decision making, which I
perform as part of my degree.
I would appreciate it if you take a few minutes for answering this
questionnaire. After answering the questionnaire, you will be asked to
participate in a lottery, where the prize is 90 NIS and the chance of
winning is 1 to 10.
At the end of the survey (in a few weeks) the number will be drawn, and the
winning number will be presented on the site alisabgu.simplesite.com. If
you win the prize, please contact me by email (alisavo@post.bgu.ac.il) to
receive the award.
The questionnaire is formulated in masculine form for convenience but is
intended for both men and women. There is no correct or incorrect answer.
The data you fill do not include identifying information and will not be
used beyond general statistical analysis. I would ask you, however, to
fill in a number of general demographic details such as gender and age.
Thank you for cooperation!
Background for the one-split game
Please imagine a game where player 1 gets a sum of 100 coins and must split
that amount between him and player 2.
Every 6 coins are worth 1 shekel.
There are 5 possible splits:
20 coins to player 2 and 80 to player 1
30 coins to player 2 and 70 to player 1
40 coins to player 2 and 60 to player 1
50 coins to player 2 and 50 to player 1
60 coins to player 2 and 40 to player 1
Player 1 must choose one split out of the five possible splits. This is his
offer to player 2.
Then player 2 must make a decision - whether to accept or reject the
proposed split. If he accepts, both players will receive the amount
promised in the split, but if he rejects, both players will receive 0
coins.
You are asked to evaluate whether you would accept the offer and to what
extent player 1 was fair.
Here are some questions regarding the description of the game. Their
purpose is to check that the instructions were clearly given. Once you
have answered the questions correctly, please proceed to the
questionnaire.
Please remember that the remaining amount for player 1 is 100 minus the
offer for player 2.
If player 1 chose to offer player 2: 40 coins
And player 2 accepted the split.
How many coins will player 1 receive?
How many coins will player 2 receive?
If player 1 chose to offer player 2: 30 coins
And player 2 rejected the split.
How many coins will player 1 receive?
How many coins will player 2 receive?
Please mark for each offer whether you would accept the offer and to what
extent player 1 was fair. Remember that the remaining amount for player 1
is 100 minus the offer for player 2.
| | Would you accept the actual offer? | To what extent was player 1 fair? |
| Offer to player 2 | accept | reject | Very unfair | 1 | 2 | 3 | 4 | 5 | 6 | 7 | Very fair |
| 20 | O | O | | O | O | O | O | O | O | O | |
| 30 | O | O | | O | O | O | O | O | O | O | |
| 40 | O | O | | O | O | O | O | O | O | O | |
| 50 | O | O | | O | O | O | O | O | O | O | |
| 60 | O | O | | O | O | O | O | O | O | O | |
Background for the two-split game
Please imagine a game where player 1 gets a sum of 100 coins and must split
that amount between him and player 2.
Every 6 coins are worth 1 shekel.
There are 5 possible splits:
20 coins to player 2 and 80 to player 1
30 coins to player 2 and 70 to player 1
40 coins to player 2 and 60 to player 1
50 coins to player 2 and 50 to player 1
60 coins to player 2 and 40 to player 1
Player 1 must choose two different splits out of the five possible splits.
Player 2 chooses one split out of the two, without seeing both splits. The
split selected by player 2 becomes the actual offer and the second split
exists but player 2 cannot accept it (background offer).
Then player 2 must make a decision - whether to accept or reject the actual
offer. If he accepts, both players will receive the amount promised in the
actual offer, but if he rejects, both players will receive 0 coins.
You are asked to evaluate whether you would accept the offer and to what
extent player 1 was fair.
Here are some questions regarding the description of the game. Their
purpose is to check that the instructions were clearly given. Once you
have answered the questions correctly, please proceed to the
questionnaire.
Please remember that the remaining amount for player 1 is 100 minus the
offer for player 2.
If player 1 chose to offer to player 2:
Offer A is 20 coins, offer B is 40 coins
Player 2 selected “blindly” offer A and after he saw it he
accepted the split.
How many coins will player 1 receive?
How many coins will player 2 receive?
If player 1 chose to offer to player 2:
Offer A is 50 coins, offer B is 30 coins
Player 2 selected “blindly” offer B and after he saw it he
rejected the split.
How many coins will player 1 receive?
How many coins will player 2 receive?
Please mark for each case whether you would accept the offer and to what
extent player 1 was fair. Remember that the remaining amount for player 1
is 100 coins minus the offer for player 2.
Reminder: The split selected by player 2 becomes the actual offer and the
second split exists but player 2 cannot accept it (it will be a background
offer).
| actual = actual offer to player 2 | background = background offer to player 2 |
| | | Would you accept the actual offer? | To what extent was player 1 fair? |
| actual | background | accept | reject | Very unfair | 1 | 2 | 3 | 4 | 5 | 6 | 7 | Very fair |
| 20 | 30 | O | O | | O | O | O | O | O | O | O | |
| 20 | 40 | O | O | | O | O | O | O | O | O | O | |
| 20 | 50 | O | O | | O | O | O | O | O | O | O | |
| 20 | 60 | O | O | | O | O | O | O | O | O | O | |
| 30 | 20 | O | O | | O | O | O | O | O | O | O | |
| 30 | 40 | O | O | | O | O | O | O | O | O | O | |
| 30 | 50 | O | O | | O | O | O | O | O | O | O | |
| 30 | 60 | O | O | | O | O | O | O | O | O | O | |
| 40 | 20 | O | O | | O | O | O | O | O | O | O | |
| 40 | 30 | O | O | | O | O | O | O | O | O | O | |
| 40 | 50 | O | O | | O | O | O | O | O | O | O | |
| 40 | 60 | O | O | | O | O | O | O | O | O | O | |
| 50 | 20 | O | O | | O | O | O | O | O | O | O | |
| 50 | 30 | O | O | | O | O | O | O | O | O | O | |
| 50 | 40 | O | O | | O | O | O | O | O | O | O | |
| 50 | 60 | O | O | | O | O | O | O | O | O | O | |
| 60 | 20 | O | O | | O | O | O | O | O | O | O | |
| 60 | 30 | O | O | | O | O | O | O | O | O | O | |
| 60 | 40 | O | O | | O | O | O | O | O | O | O | |
| 60 | 50 | O | O | | O | O | O | O | O | O | O | |
Please answer the following demographic questions
Gender: Male Female
Your age (in years) ____
Number of children ____
Years of education ____
Dwelling place: City Community settlement Moshav Kibbutz Else
The lottery
You will now be asked to participate in a lottery where a number between 1
and 10 will be drawn. If you guess the winning number, you will receive a
90 NIS reward.
Please enter any 8-digit number. ________
You must keep this number for verification in case you win the lottery.
Note - you are not allowed to return to a previous page.
Please enter a number between 1 and 10. __
You must keep this number.
If you are interested, you can fill in your email address and after the
lottery, in case you win, I will contact you via this email address.
Alternatively, you can check the winning number of the lottery on a
website whose address will be given on the next page and contact me by
email listed on the next page if you find that you won the lottery.
________________
The end
I am very grateful to you for filling out the questionnaire.
To check the winning number at the end of the survey (in a few weeks)
please enter the webpage
alisabgu.simplesite.com
If you won the lottery, please contact me at the email address
alisavo@post.bgu.ac.il
Along with the 8-digit number you entered on the previous page, to
coordinate receiving the award.
If you entered an email address on the previous page, I will contact you if
you win the lottery.
Thank you very much for your participation!
This document was translated from LATEX by
HEVEA.