Judgment and Decision Making, Vol. 16, No. 2, March 2021, pp. 238-266
Selection effects on dishonest behavior
Petr Houdek*
Štěpán Bahník#
Marek Hudík$
Marek Vrankaa
|
Abstract:
In many situations people behave ethically, while elsewhere dishonesty
reigns. Studies of the determinants
of unethical behavior often use random assignment of
participants in various conditions to identify contextual or psychological
factors influencing dishonesty. However, in many real-world contexts,
people deliberately choose or avoid specific environments. In three
experiments (total N = 2,124) enabling self-selection of participants in
two similar tasks, one of which allowed for cheating, we found that
participants who chose the task where they could lie for financial gain
reported a higher number of correct predictions than those who were
assigned it at random. Introduction of financial costs for entering the
cheating-allowing task led to a decrease in interest in the task; however,
it also led to more intense cheating. An intervention aimed to discourage
participants from choosing the cheating-enabling environment based on
social norm information did not have the expected effect; on the contrary, it
backfired. In summary, the results suggest that people low in moral
character are likely to eventually dominate cheating-enabling
environments, where they then cheat extensively. Interventions trying to
limit the preference of this environment may not have the expected effect
as they could lead to the selection of the worst fraudsters.
Keywords: cheating, self-selection, behavioral ethics, honesty-humility
1 Introduction
Given the prevalence and high societal costs of dishonesty, a large number
of experimental studies have attempted to identify the factors associated
with fraudulent and dishonest behavior, such as self-serving justifications
(Gino & Ariely, 2012); self-control (Mead et al., 2009; Shalvi, Eldar &
Bereby-Meyer, 2012); collaboration with a dishonest partner (Ścigała et
al., 2019); feelings of entitlement (Poon et al., 2013) or anonymity
(Zhong et al., 2010). Typically, these studies randomly assign
participants into experimental and control groups and measure the causal
effect of the manipulated factor. However, in various real-world contexts,
people are not randomly assigned to their circumstances; they
often actively create, choose, and influence them. Dishonest individuals
choose opportunities, organizations, and industries where cheating is
easier or even tolerated (Cohn et al., 2014; Hanna & Wang, 2017). For
example, dishonest people are more likely to stay in groups led by
unethical leaders, while more honest people tend to leave them (Cialdini
et al., 2019); those who are willing to cheat tend to prefer
performance-based compensation schemes, where cheating can lead to
additional reward (Cadsby, Song & Tapon, 2010); advisers with a record
of misconduct are more likely to choose deceptive financial advisory firms
for employment (Egan, Matvos & Seru, 2019); psychopathic and
Machiavellian individuals aim for and eventually occupy high-ranking
positions at companies (Babiak, Neumann & Hare, 2010); and business and
economic students’ lack of generosity is mostly due to self-selection of
selfish people to study in these fields, not antisocial indoctrination by
their discipline (Bauman & Rose, 2011; Frey & Meier, 2003).
Our paper has several aims. First, we examine the relationship between the
selection of a cheating-enabling environment and cheating. Second, we
examine the characteristics of individuals who selected-themselves into a
cheating-enabling environment. Third, we study the effects of
interventions intended to influence the rate of selection of a
cheating-enabling environment.
Although the importance of the selection and sorting effects in various
contexts is recognized and addressed in the large body of non-experimental
literature (e.g., Heckman, 1990; Bayer & Ross, 2006; Bless & Burger,
2016), they are seldom explored in experimental studies (Gaines &
Kuklinski, 2011, is a rare example). The first of a few experimental
studies of selection effects concerning dishonesty found that cheating
increased when participants could choose whether they would be able to
cheat on a subsequent task compared to a condition in which everyone was
enabled to cheat (Gino, Krupka & Weber, 2013). In another study,
competition and winner-takes-all compensation schemes seemed to attract
more dishonest participants (Faravelli, Friesen & Gangadharan, 2015). Yet
another study found that those more willing to cheat were also more likely
to opt for information that facilitated justification of dishonest behavior
(Akin, 2019). Most recently, Brassiolo, Estrada, Fajardo & Vargas (2020)
demonstrated that in comparison with conditions using artificial tokens,
conditions enabling embezzlement of real money drove away honest
individuals while attracting those more willing to cheat. Given the
relative lack of attention to selection effects in the research on
dishonesty, the primary aim of this paper is to analyze these effects and
their relationship to cheating.
Our second aim was to examine how people who prefer the cheating-enabling
version of the game differ from others. Personality traits may shape how
people understand the situations they experience, and people may select and
manipulate their circumstances to fit their personality traits (de Vries, Tybur, Pollet & Van Vugt, 2016). Therefore, people with personality traits associated with
cheating and dishonesty may more readily realize that an environment offers
an opportunity to cheat. For example, Sherman and colleagues (Sherman,
Rauthmann, Brown, Serfass & Jones, 2015) reported that low
honesty-humility traits were associated with a higher tendency to
experience situations in which someone is deceived. People with
dishonesty-related traits may also be able to quickly evaluate whether
cheating would be profitable and if so, take advantage of this opportunity
(Hilbig, Zettler & Heydasch, 2012; Zettler & Hilbig, 2010). On the other
hand, it may not occur to those with opposite characteristics that they
could look for an opportunity to cheat.
There is a growing literature documenting associations between individual
and personality characteristics and dishonest behavior. For example, some
basic human values (Schwartz et al., 2012) predict unethical behavior
among athletes (Ring et al., 2020) and accounting students (Mubako et al.,
2020), moral disengagement was found to be positively related to unethical
decision making (Detert, Treviño & Sweitzer, 2008), and HEXACO’s
honesty-humility personality trait was shown to be related to cheating
(Heck et al., 2018; Hilbig & Zettler, 2015; Pfattheicher, Schindler &
Nockur, 2019; Vranka & Bahník, 2018). However, comparatively little is
known about predictors of preferences for cheating-enabling environments.
Only one previous study found that honesty-humility was strongly
associated with the selection of an experimental condition that enabled
participants to cheat (Hilbig & Zettler, 2015).
While predictors of selection may be similar to predictors of actual
cheating, it is possible that people who are willing to cheat when
randomly allowed to do so differ from those who seek such opportunities
themselves. In the first study, we included a wide range of personality
scales that have been found to be associated with moral behavior in
earlier literature. Although the relation between the honesty-humility
scale and cheating can be expected based on the previous findings, we also
explore various other conceptualizations of moral traits in an exploratory
fashion. In addition to moral traits, we were interested whether
selection of the cheating-enabling environment will be associated with
risk aversion, impression management tendencies or a tendency to act
prosocially and to contribute to a charity from one’s reward from the
experiment. It can be argued that the cheating-enabling condition is less
risky, as one can misreport some outcomes in case of bad luck (Hilbig &
Zettler, 2015); however, risk aversion may also lead to the avoidance of
ethically controversial situations (Hennig-Schmidt, Jürges & Wiesen, 2019).
Alternatively, people who are more likely to manage impressions may be
less willing to self-select into the cheating-enabling environment,
because such selection could be perceived as a signal of one’s
preparedness to cheat (Sassenrath, 2020). Finally, we wanted to explore
the relations between the selection of the cheating-enabling environment
and prosocial traits and charitable donations, as it was possible that
behaving charitably could compensate for the previous dishonesty
(Wiltermuth, Newman & Raj, 2015); or contrary, social preferences may be
contradictory to dishonesty (Hanna & Wang, 2017). In two subsequent
studies, we focused mainly on the HEXACO questionnaire and the association
between honesty-humility and the preference of a cheating-enabling
environment.
The third aim of the paper is related to the fact that the choice of a
cheating-enabling environment is often associated with costs. For example,
in some countries civil servants, politicians, and police officers could be
willing to work for lower salaries because they know they can get
additional money by corruption, and, similarly, lobbyists, and
representatives of corrupt companies could be willing to bear financial and
reputation costs to maintain a corrupt environment. In addition, we tested
the effect of information about the proportion of participants choosing the
cheating-enabling and cheating-prohibiting environments on the
selection. The design of this intervention was motivated by the literature
showing that information about social norms has been effective in
changing behavior in multiple domains (Benartzi et al., 2017; Hallsworth et
al., 2017; Halpern, 2015; Thaler & Sunstein, 2008; Walton & Wilson,
2018).
To address the aims of the paper, we conducted three experiments, which
allowed participants to choose either an environment where they were able
to cheat or where cheating was impossible. All experiments used a modified
mind game in which participants were rewarded for correct predictions of
die rolls or coin flips (Jiang, 2013; Moshagen & Hilbig, 2017). There
were two versions of the game. In one version, the reward was determined
by chance, and participants could not influence it. In the other version
of the game, the reward was determined by self-reported results, and
therefore, participants had an opportunity to cheat. In Studies 1 and 3,
the choice of the cheating-enabling environment was costless, and the
participants were not informed about the choices of others. These two
studies differed in particular in the number of rounds, and therefore, in
the potential detectability of cheating. Study 2 included two
interventions: financial costs for entering the cheating-allowing task and
an intervention based on social norm information.
In all three studies, we found that individuals with a higher propensity to
cheat selected themselves into the environment, which allowed them to
cheat. We also demonstrated higher generalizability of the effect of
selection by using samples from different countries as China, Czechia, and
English speaking countries (USA, UK, Canada, etc.) (Cheek, 2017; Henrich,
Heine & Norenzayan, 2010; Novakova et al. 2018). Moreover, participants
who chose the version where they could cheat to obtain a financial gain in
Study 1 and 2 cheated more than those who were assigned to it at random.
In Study 2, we found that the fee discouraged some individuals from
choosing the cheating-enabling environment. However, the fee also resulted
in more cheating by those who selected this environment. Surprisingly,
participants were more likely to choose the cheating-enabling environment
after receiving the information that only a low fraction of participants
chose this environment in the past. Finally, Study 3 confirmed the
existence of the selection effect in an environment where cheating was
more anonymous than in Studies 1 and 2.
2 Study 1
2.1 Methods
The materials used in the study, data, analysis scripts, as well as
preregistration of all the studies are available at
https://osf.io/cj28d/.
2.1.1 Participants
Six hundred and twenty-two subjects (315 Czech and 307 Chinese, 67%
female, Mdnage = 21) participated in the study.
Both the Czech and the Chinese samples were recruited from laboratories’
subject pools. According to a pre-registered exclusion criterion, 27
participants who did not answer all attention checks correctly were
excluded from analyses using individual differences measures.1 The final sample size had a sufficient power 1-β
= .80 for an effect size d = 0.23 or r = .16.
2.1.2 Design and procedure
The study was conducted in a laboratory setting in groups of up to 17 or 38
participants in Czechia and China, respectively, who worked individually
on workstations separated by dividers. The experiment was administered in
English (a non-native language for both groups) using a custom-written
Python program. All rewards were paid in the local currency; CZK in
Czechia (100 CZK = approx. 4.40 USD) and CNY in China (100 CNY = approx. 14.40
USD).
The experiment used a modified mind game (Jiang, 2013; Moshagen & Hilbig,
2017). Participants earned 35 CZK or 10 CNY for each correct prediction of
whether the outcome of a fair die roll would be odd or even. Participants
played three rounds of the game, with ten rolls in each round. They were
informed beforehand that they would receive a financial reward according
to their result in one randomly selected round. Participants’
understanding of the rules was checked with a short quiz.
There were two different versions of the game: in the BEFORE version,
participants had stated their predictions before the die was rolled, and
then they saw the outcome. Therefore, no cheating was possible. In the
AFTER version, participants were asked to make a prediction in their mind
and remember it. Then a roll was made, and participants were shown the
outcome and asked to state whether they had predicted it correctly or not.
As the actual prediction was only in participants’ minds, they could cheat
and misreport even their incorrect predictions as correct.
In the first two rounds, participants played one round of the game in the
AFTER and one in the BEFORE version, in random order. The first two rounds
introduced participants to both versions of the task, and the number of
reported predictions in the AFTER version of the task served as a
baseline measure of cheating. For the third round, participants
were randomly assigned to a control or experimental group, and they read
short descriptions of both versions of the game. The participants in the
control group were randomly assigned either the AFTER or BEFORE version.
The participants in the experimental group were offered a choice whether
they wanted to play the third round in the BEFORE or AFTER version, or
whether they wanted to be assigned to one of the versions at random. See
Figure 1 for a schema of the study.
After finishing the main part of the experiment, we measured participants’
risk preferences using a simplified Holt and Laury (HL) task (Teubner, Adam
& Niemeyer, 2015) and their social preferences by giving them an option to
give a part of their reward to a charity of their choice.2 Finally, participants answered
socio-demographic questions and filled several questionnaires; namely,
60-items HEXACO scale (Ashton & Lee, 2009), work deception scale (Gunia &
Levine, 2016), prosocialness scale (Caprara, Steca, Zelli & Capanna,
2005), desirable responding scale (BIDR-16; Hart, Ritchie, Hepper &
Gebauer, 2015), moral agency scale (Black, 2016), measure of moral
disengagement (Shu, Gino & Bazerman, 2011), and values questionnaire
(PVQ-RR; Schwartz et al., 2012).3 Participants were
informed before the questionnaires that there would be attention check
items in the questionnaires and that they could earn an additional reward
of 50 CZK or 15 CNY if they would manage to answer all of them correctly.
At the end of the session, participants answered questions about their
perception of the two versions of the dice-rolling task and completed a
short debriefing in which they answered open-ended questions about the
aims of the different parts of the experiment.
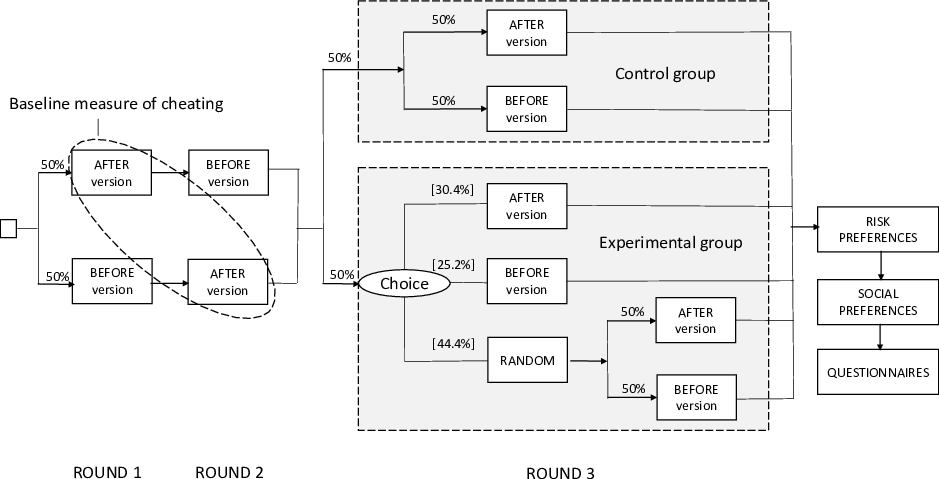
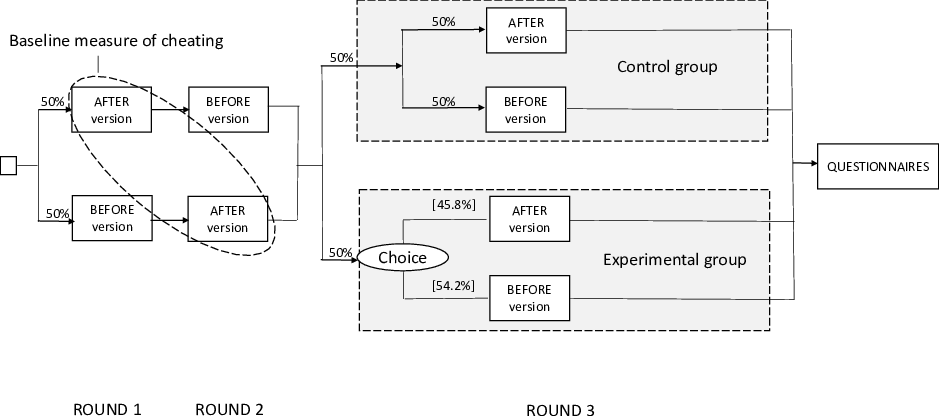
| Figure 1: Schema of the design of Study 1. In rounds 1 and 2, participants
played AFTER and BEFORE versions of the game in a randomized order. The
number of reported predictions in the AFTER version of the task served as
a baseline measure of cheating. In round 3, participants were randomly
selected to a control and experimental group. Participants in the
control group were randomly assigned BEFORE or AFTER version of the game.
Participants in the experimental group chose whether they wanted to play
BEFORE or AFTER version, or whether they wanted to be assigned to one of
the versions at random. Then we measured, for all participants, risk and
social preferences. Finally, participants answered socio-demographic
questions and filled several questionnaires. |
2.2 Results
The average number of reported correct predictions in the baseline measure
of the AFTER version of the task exceeded five expected by chance
(t(621) = 11.25, p < .001, d = 0.45,
95% CI [0.37, 0.53], M = 5.84), showing that participants cheated
in the task. Czech participants on average cheated less than Chinese
(t(611) = −7.73, p < .001, d = −0.62,
CI [−0.79, −0.46], MCzech = 5.30,
MChinese = 6.42). The distribution of correct
predictions per condition is shown in Figure 2.4
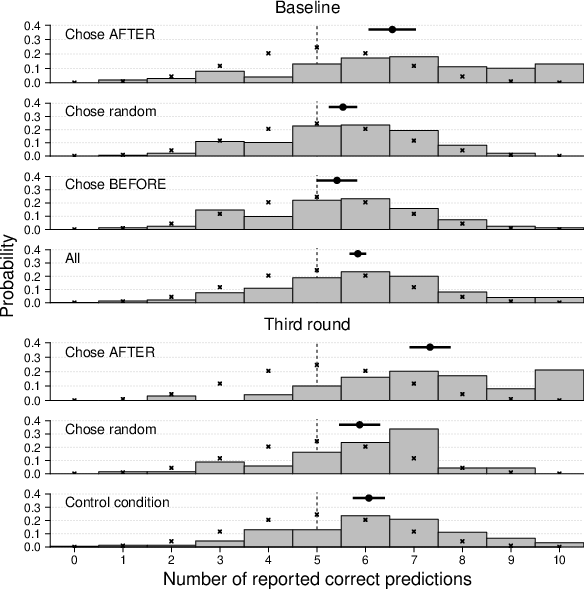
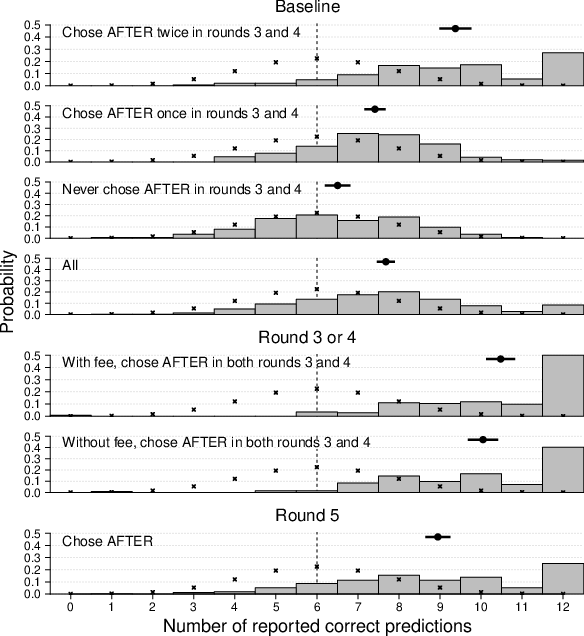
| Figure 2: The distribution of correct predictions per condition.
The figure shows the distribution of correct predictions in the baseline
measure of cheating and in the 3rd round in comparison to the expected
distribution. Observed means and their 95% confidence intervals are also
displayed. Observations are grouped according to participants’ decisions
in the 3rd round. For example, “Chose AFTER” shows the distribution of
correct predictions of the participants who chose the AFTER version of the
task in the 3rd round. |
The AFTER version of the task was chosen by 30.4% of the participants who
were given the opportunity to choose a version of the task for the third
round and the BEFORE version was chosen by 25.2% of participants. The
remaining participants decided to be assigned the task at random.
Participants who chose the AFTER version cheated more than participants in
the control group who were assigned the AFTER version randomly
(t(249) = 5.01, p < .001, d = 0.65,
CI [0.39, 0.91], Mafter = 7.33,
Mcontrol = 6.07), as well as more than
participants from the experimental group who were assigned the AFTER
version randomly (t(165) = 4.93, p < .001,
d = 0.78, CI [0.45, 1.09], Mrandom
= 5.88). Participants in the experimental group who chose the AFTER version
also cheated more in the baseline measure of the AFTER version than those
who chose to be assigned randomly (t(242) = 4.02, p
< .001, d = 0.52, CI [0.26, 0.78],
Mafter = 6.56, Mrandom =
5.54), as well as those who chose the BEFORE version of the task
(t(179) = 3.65, p < .001, d = 0.54,
CI [0.25, 0.84], Mbefore = 5.41). The latter
two groups did not differ significantly from each other (t(225) =
0.53, p = .597, d = 0.07, CI [−0.20, 0.34]. The
results therefore showed that cheaters also tended to choose the
opportunity to cheat when given a choice.
Participants who chose the AFTER version of the task also cheated more in
the third round than in the baseline (t(98) = 4.18, p
< .001, d = 0.42, CI [0.21, 0.63],
Mafter third = 7.33,
Mafter baseline = 6.56). This shows that
participants in the experimental condition who chose the AFTER version did
not do so only because they had a high number of correct predictions in
the baseline by chance. On the other hand, there was no significant
difference in cheating between the baseline and the third round for those
in the experimental group who were assigned to the AFTER version randomly
(t(67) = 0.35, p = .724, d = 0.04, CI
[-0.20, 0.28], Mrandom third = 5.88,
Mrandom baseline = 5.81), as well as for those in
the control group who were assigned to the AFTER version (t(151)
= 1.06, p = .291, d = 0.09, CI [−0.07, 0.25],
Mcontrol third = 6.07,
Mcontrol baseline = 5.89). The possibility of
choosing a version of the task, therefore, increased the rate of cheating
for those who wanted to cheat. The experimental group also had somewhat
higher earnings in the third round overall than the control group
(t(620) = 2.37, p = .018, d = 0.19, CI
[0.03, 0.35], Mexperimental = 5.89,
Mcontrol = 5.53). This result suggests that the
possibility of choosing an environment might increase the rate of
cheating, at least under certain circumstances.
Out of the included individual differences measures, only honesty-humility
predicted both cheating and selection of a version of the task (see Figure
3). Participants higher in honesty-humility cheated more in the baseline
measure (rS (Spearman’s ρ ) = −.09,
CI [−.16, −.01], p = .033), and were also less likely to
choose to have an option to cheat in the third round of the task
(rS = −.13, CI [−.24, −.02], p =
.019, for choices ordered using levels BEFORE, random, and AFTER).
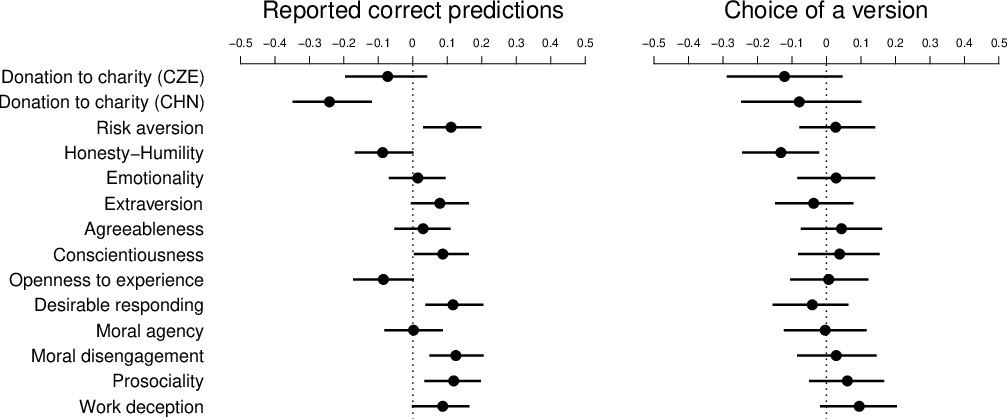
| Figure 3: Correlations between individual differences measures with
baseline cheating and selection of a version of the task in Study 1. The
figure shows Spearman correlation coefficients and 95% confidence
intervals for their estimates. The choice of a version had three ordered
levels — BEFORE, random, and AFTER — and only participants in the experimental
group were included. Donations to charity are analyzed separately for the
two samples because the charities, as well as exact monetary rewards
differed between them. The results from the PVQ are at
https://osf.io/xpbdq/. |
2.3 Discussion
Study 1 enabled self-selection of participants in two versions of the task,
one of which allowed them to behave dishonestly. The results show that the
participants who chose the version where they could cheat to obtain a
financial gain reported a higher number of correct predictions than those
who were assigned to it at random. Furthermore, those who selected the
cheating enabling version reported a higher number of correct predictions
than other participants even in the initial rounds before the selection,
and they further increased the rate of reporting correct predictions after
the selection. In line with similar previous studies, we interpret the
higher number of correct predictions as “more cheating” on the aggregate
(however, see Moshagen & Hilbig, 2017 for the discussion of potential
problems with this interpretation). Therefore, our findings support the
view that dishonest individuals seek cheating enabling environments. While
some theories suggest that dishonest people may choose
cheating-prohibiting environments either to overcome the temptation to
cheat (Elster, 2000; Schelling, 2006) or to maintain a moral self-image
(Barkan, Ayal & Ariely, 2015), our results show that even if this were
true for some dishonest people, the selection of the cheating-enabling
environment to gain an additional reward outweighs such an effect.
Because we used the number of correct guesses as a proxy for cheating,
which was not possible to observe directly, there are alternative
explanations of some of our findings. In particular, the positive
correlation between the baseline cheating and selection of the AFTER
version might have been caused by participants who chose the AFTER version
of the game simply because they were luckier when they first played the
AFTER version than when they played the BEFORE version. Therefore, they
might have believed that the AFTER version is associated with a higher
chance of winning than the BEFORE version (Rabin & Vayanos, 2010).
However, this explanation is contradicted by two other results. First,
participants who chose the AFTER version for the third round then cheated
even more than in the baseline. Second, low honesty-humility, previously
shown to predict cheating (Hilbig & Zettler, 2015; Kleinlogel, Dietz &
Antonakis, 2018), was associated both with the high number of correct
guesses and with the selection of the cheating-enabling environment. Both
of these results suggest that cheaters, rather than individuals who were
lucky when they first played the AFTER version, selected the
cheating-enabling environment.
Despite the large number of measured personality characteristics, no other
was associated with the selection of the cheating-enabling environment.
Although some measures such as moral disengagement, desirable responding,
risk-aversion, and prosociality were positively related to the number of
the reported correct predictions, these correlations were quite low. The
association between desirable responding and overreporting of correct
predictions was in the opposite direction than in previous research
(Zettler et al., 2015). A thorough analysis of
these conflicting findings may be an interesting area for future research.
Finally, while the Chinese cheated more than the Czechs in the experiment,
we did not find differences in other effects between the two groups. Even
though the two samples differed in various individual differences
measures, none of them explained the difference in cheating. It is
possible that the difference in cheating was caused by cultural
differences (Cohn et al., 2019; but see Pascual-Ezama et al., 2015).
In Study 1, we assumed zero costs associated with the choice of an
environment. However, entering a cheating-allowing environment often
requires effort and is associated with time and financial or reputational
costs. The existence of entry costs could have contradictory effects on
the prevalence of dishonesty. On the one hand, entry costs may deter
people who are not highly motivated to cheat. On the other hand, entry
costs could lead to more cheating by fraudsters who are prepared to cheat
despite the costs, because they might want to recoup these costs or even view
them as a kind of a fee that justifies their subsequent cheating (Shalvi
et al., 2015). In Study 2, we tested how entry costs affect the rate of
selection and the magnitude of cheating.
We also tested a non-financial measure that should limit the preference of
the cheating-enabling environment. A social norm, that is, information
about the behavior of others in a given situation, is a powerful signal of
how one should behave. A reminder of a social norm usually leads to more
congruent behavior. Nevertheless, the evidence about its effectiveness is
not universal (Bicchieri & Dimant, 2019; McDonald & Crandall, 2015;
Schultz et al., 2007). Because a minority of participants chose both the
cheating-enabling (30%) and the cheating-prohibiting environment (25%)
in Study 1, we were able to manipulate perceived norms by informing
participants about either of the proportions in Study 2, where there was
no possibility to choose the random assignment.
The large number of personality measures used in Study 1 also means that
there was a higher probability of a false-positive result. Therefore, in
Study 2, we used only the HEXACO personality questionnaire containing
honesty-humility, the only significant predictor of cheating and
environment selection. We also added a measure of the dark triad, which
has been shown to be closely associated with honesty-humility (Hodson et
al., 2018).
3 Study 2
3.1 Methods
3.1.1 Participants
The experiment was conducted with 501 participants (61% female,
Mdnage = 22) from our Czech laboratory subject
pool consisting mostly of university students (n = 352). The most
represented fields were humanities and social sciences (n = 125)
and economics and management (n = 101). According to a
pre-registered exclusion criterion, nine participants who did not answer
all the attention checks correctly were excluded for analyses using
questionnaire data. The final sample size had a sufficient power
1−β = .80 for an effect size d = 0.25 or
r = .18.
3.1.2 Design and procedure
The study was conducted in a laboratory setting in groups of up to 17
participants, who worked individually on workstations separated by
dividers. The present study was the first in a batch of three unrelated
studies. The whole experiment was administered in Czech using a
custom-written Python program.
Participants played five rounds of the same modified mind game as in Study
1 with twelve rolls in each round. The reward for correctly predicting
whether the outcome will be odd or even increased by 5 CZK with each
correct prediction from 5 CZK for the first correct prediction to 60 CZK
for the twelfth. Participants were informed that they would receive the
money earned in one randomly selected round. In order to prevent
participants’ concerns that a higher reward would be an indicator of
dishonest conduct, they were also informed that after the main dice
rolling task, there would be a lottery task in which they could earn an
additional reward of up to 1280 CZK and that experimenters would know only
the total amount of reward at the end of the session.
As in Study 1, in the first two rounds, every participant played one round
of the game in the AFTER and one in the BEFORE version, in random order.
Before the third round began, participants had read short descriptions of
both versions of the game, and then they chose whether they wanted to play
the next round in the BEFORE or AFTER version. One half of the participants
had to pay a fee of 25 CZK for the selection of the AFTER version. The
other half of the participants could select the AFTER version without any
fee. The BEFORE version was not associated with any fee for any of the
participants. The fourth round was the same as the third, but participants
were given the condition (fee or no-fee) that they had not received in the
third round. In the fifth round, participants again chose between the
BEFORE and AFTER version, this time without any fees. However, before
making their decision, one half of participants learned that “only 30%”
of participants wanted to participate in the AFTER version in a similar
previous experiment and the other half learned that “only 25%” of
participants wanted to participate in the BEFORE version of the task.
Although these proportions reflect that in Study 1 participants had an
additional option, and therefore, their choice problem differed from Study
2, we did not lie to the participants about the proportions, even though we
did not disclose full information.5 See Figure 3 for a schema of the study.
At the end of the session, participants provided socio-demographic
information, filled several questionnaires — namely, 60-items HEXACO scale
(Ashton & Lee, 2009) and Short Dark Triad scale (Jones & Paulhus,
2014)6 — answered questions about their perception of the
two versions of the dice-rolling task, and completed a short debriefing in
which they answered open-ended questions about the aims of the different
parts of the experiment. Attention check items were again added to the
questionnaires, and participants could earn an additional reward of 50 CZK
if they answered all of them correctly.
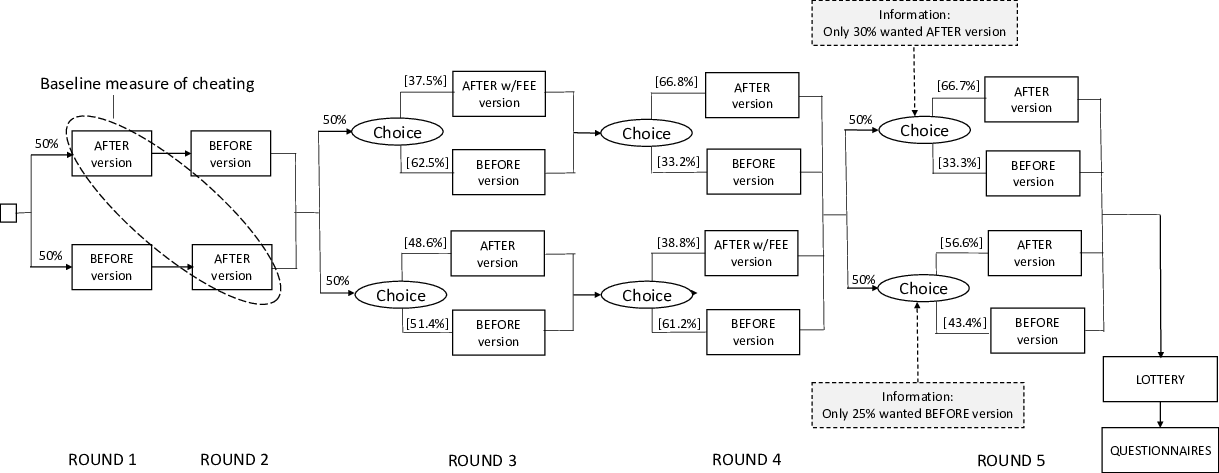
| Figure 4: Schema of the design of Study 2. In rounds 1 and 2,
participants played AFTER and BEFORE versions of the game in a randomized
order. The number of reported predictions in the AFTER version of the task
served as a baseline measure of cheating. In rounds 3 and 4, participants
chose in random order between the BEFORE and AFTER version, and between
the BEFORE and AFTER version with a fee. In round 5, participants chose
between the BEFORE and AFTER version. Before making their decision, a half
of participants learned that “only 30%” of participants participated in
the AFTER version in a previous experiment while the other half learned
that “only 25%” of participants participated in the BEFORE version of
the task. Finally, all participants played a lottery, answered
socio-demographic questions, and filled several questionnaires. |
3.2 Results
The average number of reported correct predictions in the baseline measure
of cheating exceeded the six expected by chance (t(500) = 17.15,
p < .001, d = 0.77, CI [0.67, 0.87],
M = 7.68), showing that participants cheated in the task.
| Figure 5: The distribution of correct predictions per condition.
The figure shows the distributions of correct predictions in comparison to
the expected distribution. Observed means and their 95% confidence
intervals are also displayed. Observations are grouped according to
participants’ choices of the two versions of the task. |
In the third round of the task, the AFTER version was chosen by 37.5% of
participants in the fee condition and 48.6% of participants in the no-fee
condition. In the fourth round, the AFTER version was chosen by 38.8% of
participants in the fee condition and 66.8% of participants in the no-fee
condition. A mixed-effect logistic regression with the choice of the
version as the dependent variable, the presence of a fee, round number (both coded using simple contrast coding),
their interaction, and the reported number of correct predictions in the
baseline measurement7 as predictors, and random
intercepts for participants, showed that participants reporting a higher
number of correct predictions in the baseline measure were more likely to
choose the AFTER version of the task (z = 9.86, p
< .001, OR = 1.69, CI [1.52, 1.88]). Participants
were less likely to select the AFTER version in the presence of a fee
(z = −6.68, p < .001, OR = 0.33, 95%
CI [0.24, 0.46]), and more likely in the fourth round of the task
(z = 3.60, p < .001, OR = 1.76, CI
[1.29, 2.39]). The difference between the fee and no-fee condition was
larger in the fourth round (z = −2.91, p = .004,
OR = 0.37, CI [0.19, 0.72]). When the difference between
rounds was analyzed separately for the two conditions, there was no
difference between the two rounds for the fee condition (t(498) =
0.21, p = .833, OR = 1.05, CI [0.69, 1.58]), but the
AFTER version was more likely to be selected in the fourth round than in
the third round in the no-fee condition (t(498) = 4.45, p
< .001, OR = 2.43, CI [1.65, 3.60]).
Next, to test the effect of the presence of a fee on cheating, we performed
a linear mixed-effect regression with the number of reported correct
predictions as the dependent variable and the presence of a fee, round
number, and their interaction as predictors for the 144 participants who
chose the AFTER version of the task in both third and fourth rounds. The
number of reported correct predictions did not differ significantly between
the two rounds (t(142.0) = 1.53, p = .129, b =
0.15, CI [−0.04, 0.35]). Participants cheated more in the presence of a
fee (t(142.0) = 4.54, p < .001, b =
0.45, CI [0.26, 0.65]), and this effect did not seem to differ based on the
round of the task (t(142.0) = 0.56, p = .579, b
= 0.36, CI [−0.92, 1.65]). Participants reported, on average, 10.48
correct predictions in the presence of a fee and 10.05 correct predictions
in its absence. The average reward in the presence of the fee was 310.5 CZK
and 288.2 CZK in its absence. The increased cheating therefore almost fully
compensated the 25 CZK fee. Participants who chose the AFTER version only
in the round when there was no fee also reported significantly more correct
predictions than the expected six. Such participants who had the no-fee
condition in the third round cheated less than the participants who had no
fee in the fourth round (t(144) = −2.92, p = .004,
d = −0.49, CI [−0.83, −0.16], Mthird
no-fee = 6.83, Mfourth no-fee = 7.80). To test
the possibility of escalation of cheating observed in Study 1, we compared
the number of reported correct predictions in the third round and in the
baseline measure of participants who selected the AFTER version of the task
in the third in the no-fee condition, where they could not be influenced by
the knowledge of the fee. Unlike in Study 1, they did not cheat more in the
third round than in the baseline measure (t(118) = 0.44,
p = .662, d = 0.04, CI [−0.14, 0.22],
Mafter third = 8.49,
Mafter baseline = 8.41).
To test the effect of the information about the share of participants who
chose the AFTER or BEFORE version of the task, we conducted a logistic
regression with the choice of the version in the fifth round as the
dependent variable and the information condition as a predictor. The model
included the number of choices of the AFTER version in third and fourth
rounds as a covariate. Contrary to our prediction, participants who
received the information that a low proportion of participants had chosen
the AFTER version were more likely to choose the AFTER version of
the task (t(498) = 2.41, p = .016, OR = 1.09,
CI [1.02, 1.17]). The AFTER version of the task was chosen by 66.7%
of participants who were informed that a low proportion of participants
had chosen the AFTER version, and 56.6% of participants who were informed
that a low proportion had chosen the BEFORE version. The number of
reported correct predictions did not significantly differ between the
participants who chose the AFTER version in the two conditions
(t(307) = −1.55, p = .121, d = −0.18, CI
[−0.40, 0.05], Mlow after = 8.75,
Mlow before = 9.18).
Out of the included individual differences measures, honesty-humility,
Machiavellianism, and psychopathy predicted both cheating and selection of
a version of the task (see Figure 4). Participants higher in
honesty-humility cheated less in the baseline measure
(rS = −.24, CI [−.33, −.16], p
< .001), and also chose to have an option to cheat in the third
and fourth rounds of the task less frequently (rS
= −.30, CI [−.38, −.22], p < .001). On the other
hand, participants higher in Machiavellianism were more likely to cheat in
the baseline (rS = .18, CI [.09, .27], p
< .001), and chose to have an option to cheat in the third and
fourth rounds of the task more frequently (rS =
.17, CI [.06, .26], p < .001). Similarly, participants
higher in Machiavellianism were more likely to cheat in the baseline
(rS = .12, CI [.04, .21], p = .006), and
chose to have an option to cheat in the third and fourth rounds of the task
more frequently (rS = .11, CI [.02, .20],
p = .018). However, neither Machiavellianism nor psychopathy
improved the models predicting the number of reported correct predictions
or choice of a version using honesty-humility (all ps >
.17). On the other hand, all of the models including either Machiavellianism
or psychopathy were improved by including honesty-humility (all ps
< .001).
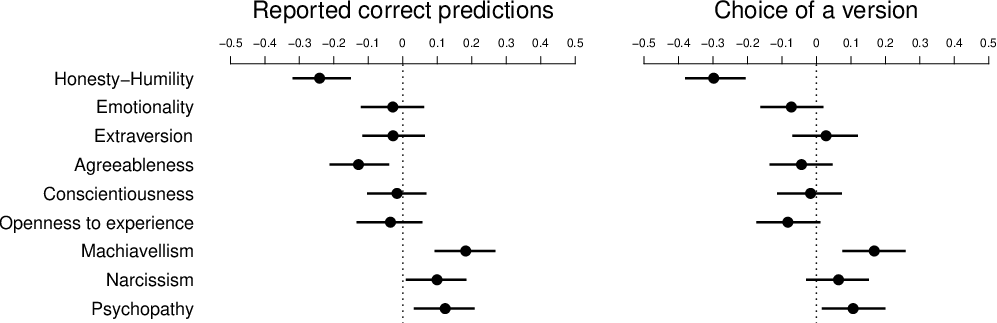
| Figure 6: Correlations between individual differences measures with
baseline cheating and selection of a version of the task in Study 2. The
figure shows Spearman correlation coefficients and 95% confidence
intervals for their estimates. The choice of a version corresponds to the
number of choices of the AFTER version in the third and fourth rounds of
the task. |
3.3 Discussion
The second study replicated the results of Study 1, showing that
participants who selected the cheating-enabling environment also tended to
cheat more. The negative association of honesty-humility with the
selection of the cheating-enabling environment was also replicated.
Moreover, we observed that participants high in Machiavellianism and
psychopathy were more likely to choose the cheating-enabling environment.
However, the association of these two dark traits with honesty-humility
can largely account for the results (Hodson et al., 2018). Our findings thus
again confirm that people who select cheating-enabling environments differ
from those who do not. Nevertheless, unlike in Study 1, we did not find
that participants who chose the cheating-enabling environment cheated more
afterward.
A possible explanation for the lack of escalation of cheating is that, in
Study 2, participants were not given the opportunity to choose to be
assigned the version of the game randomly. Consequently, some of the more
honest participants that would choose the random assignment opted for the
cheating-enabling environment, but their cheating did not escalate. This
explanation is in line with the view that the aggregate level of cheating
is driven by a minority of dishonest individuals who cheat to the maximum,
rather than by many individuals who cheat a little.
Introduction of a fee for entering the cheating-enabling environment
decreased the number of participants who selected this environment;
however, participants who chose it despite the fee then cheated more. The
implication that increasing costs of entering or staying in a
cheating-enabling environment — whether monetary, reputational, or
opportunistic ones (such as lost income) — may lead to more intense
cheating, has important policy implications. Payments in many occupations
with agency problems, such as finance consultant (Mullainathan, Noeth &
Schoar, 2012), real estate agent (Levitt & Syverson, 2008), taxi-driver
(Balafoutas et al., 2013) or automobile technician (Schneider, 2012), at
least partly depend on self-reported performance, which enables dishonest
behavior. In order to perform these occupations, individuals have to
purchase a license or incur other monetary or nonmonetary costs. Our
findings suggest not only that these types of occupations may attract more
dishonest individuals but also that the licensing could result in
increased cheating. Similarly, comparatively low wages of civil servants,
which can be seen as a form of costs, can lead to higher corruption,
because only the dishonest willing to take bribes will be attracted to
such positions (Van Rijckeghem & Weder, 2001).
The intervention based on social norms that we employed with the goal of
reducing the number of participants choosing the cheating-enabling
environment did not work as intended. The participants who were informed
that only a low proportion of participants had selected the
cheating-enabling environment were actually more likely to choose this
environment. On the other hand, participants who were informed about the
low proportions of those selecting the BEFORE version were more likely to
choose it. A possible explanation is that participants thought that with a
small number of cheaters, it is justifiable to cheat because not so many
resources are going to be misused. This explanation is also supported by
the fact that participants themselves estimated a much higher proportion
of cheaters (72%). Nevertheless, our data do not allow us to test these
conjectures.
We found that participants chose the AFTER version of the game with no fee
more often in the fourth round than in the third round. Participants may
have viewed the option of selecting the AFTER version without paying a fee
more positively in comparison to the selection associated with a fee in the
previous round. In other words, participants who were aware that selection
of the AFTER version can be costly perceived the selection in the no-fee
treatment as “free” and, therefore, more tempting (Shampanier, Mazar &
Ariely, 2007). These results are also in line with findings by Khadjavi
(2014), who observed an increase in dishonest behavior when the possibility
of punishment was removed in a laboratory stealing game. This explanation
suggests that if a cheating-enabling environment suddenly becomes easier to
access, people may be more willing to choose it not only because of the
lack of the additional costs but also because of the favourable comparison
to the previous costly state. This effect could have contributed, for
example, to greater demand for illegal downloading of movies after the
price reduction of a broadband connection (Danaher & Smith, 2014), and to
stimulation of prostitution business after a high efficiency of pairing of
sex-workers and their clients on websites like Craigslist became available
(Chan, Mojumder & Ghose, 2019).
Because Studies 2 and 3 involved several rounds with multiple trials, a
possible concern is that potential cheaters might have been reluctant to
report a high number of successes to protect their positive self-image or
avoid being perceived as cheaters based on the size of their final reward.
To address this potential problem, in Study 3, we conducted an experiment
with a single trial. Regarding personality measures, we have included only
the HEXACO questionnaire because the association between dark triad and
preference for the cheating-enabling environment was largely explained by
their association with honesty-humility.
4 Study 3
4.1 Methods
4.1.1 Participants
We ran the experiment with a sample of 1001 English speaking participants
(55% female, 44% male, Mdnage = 31,
IQRage = 17) recruited through Prolific. The
whole experiment was administered in English. The participants were paid
£0.42 ($0.55) for their participation. The sample size had a sufficient
power 1−β = .80 for an effect size d = 0.13 or
r = .09. Twenty nine participants failed an attention check and
were excluded from analyses including the honesty-humility measure which
contained the attention check following a preregistered exclusion
criterion.
4.1.2 Design and procedure
The procedure was similar to Study 1 with a few changes. Unlike in Study 1,
each round had only one trial and participants predicted outcomes of two
coin tosses in the trial rather than a roll of a die. Participants played
three rounds of the game and they had been informed beforehand that one
round would be selected at random and they would get an additional
monetary reward of £1 ($1.3) if they predicted both coin tosses
correctly in the selected round. In the first two rounds, every
participant played one round of the game in the AFTER and one in the
BEFORE version, in a random order. Then they read short descriptions of
both versions of the game. Half of the participants in the control group were
randomly assigned one of the versions for the third round. The remaining
participants in the experimental group chose whether they wanted to play
the last round in the BEFORE or AFTER version.
In the last part of the experiment, participants answered socio-demographic
questions and filled questions related to honesty-humility from the HEXACO
scale (Ashton & Lee, 2009). One attention check item asking participants
to select a specific response was added to the honesty-humility items.
| Figure 7: In rounds 1 and 2,
participants played AFTER and BEFORE versions of the game in a randomized
order. The number of reported predictions in the AFTER version of the task
served as a baseline measure of cheating. In round 3, participants were
randomly selected to a control and experimental group. Participants in the
control group were randomly assigned BEFORE or AFTER version of the game.
Participants in the experimental group chose whether they wanted to play
BEFORE or AFTER version. Finally, participants answered socio-demographic
questions and filled questions related to honesty-humility. |
4.2 Results
In the baseline measure of cheating, 44.5% of participants reported a
correct prediction, which corresponds to the estimate of d =
25.9% of dishonest participants (Moshagen & Hilbig, 2017).
In the third round, 45.8% of participants from the experimental group
chose the AFTER version of the task. Participants in the experimental
group who chose the AFTER version of the task were more likely to report
that they correctly predicted the coin tosses in the baseline measure of
cheating than those who chose the BEFORE version of the task for the third
round (t(540) = 3.07, p = .002, OR = 1.14, 95%
CI [1.05, 1.24], ORd = 2.56,
dchose AFTER = 34.4%,
dchose BEFORE = 17.0%; see Figure 8).8
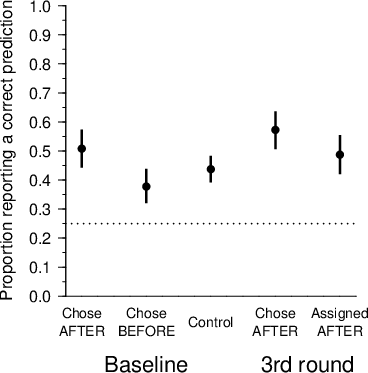
| Figure 8: The proportion of reported correct predictions per
condition, choice, and round in Study 3. The error bars show 95%
confidence intervals around the proportions. The dotted line shows the
expected proportion of correct predictions under chance performance. |
Even though the participants from the experimental group who chose the
AFTER version of the task were more likely to report that they predicted
the coin tosses correctly in the third round than participants from the
control group who were assigned the AFTER version of the task, the effect
was not significant (t(482) = 1.88, p = .060, OR
= 1.09, CI [1.00, 1.19], ORd = 1.63, dexperimental
= 43.0%, dcontrol = 31.6%). The participants who
chose the AFTER version of the task were also not significantly more likely
to report a correct prediction in the third round than in the baseline
measure of cheating (z = 1.54, p = .124, OR =
1.35, CI [0.92, 1.98], dthird round = 43.0%,
dbaseline = 34.4%).
Honesty-humility did not predict selection of the AFTER version of the task
in the experimental group (t(524) = 0.40, p = .686,
OR = 1.06, CI [0.81, 1.37]). However, participants higher in
honesty-humility were less likely to report that they had predicted the
coin tosses correctly in the baseline measure of cheating (t(970)
= −2.84, p = .005, OR = 0.75, CI [0.62, 0.91],
ORd = 0.14), as well as in the AFTER version of
the task in the third round (t(463) = −4.40, p
< .001, OR = 0.53, CI [0.40, 0.70],
ORd = 0.16).
4.3 Discussion
The results of Study 3 confirmed some of the findings of Studies 1 and 2.
In particular, individuals who cheated in the first and second round were
more likely to choose the cheating-enabling environment in the third
round. This finding once again supports our hypothesis that cheaters
self-select themselves into environments that allow cheating. As in the
first two studies, honesty-humility was identified as a predictor of
cheating. However, unlike in Studies 1 and 2, honesty-humility did not
predict the selection of the cheating-enabling environment. It is possible
that dishonest participants had a lower motivation to select the AFTER
version of the task given that the potential additional reward was
smaller. The greater anonymity in Study 3 could have also decreased the
association between honesty-humility and selection of the
cheating-enabling version of the task.
Although individuals who chose the cheating-enabling environment in the
third round cheated more than participants who were assigned this
environment randomly, this result was not significant on the conventional
level. The one-shot prediction used in Study 3 was likely less sensitive
to cheating than the repeated measures used in Studies 1 and 2, which
could have led to the difference in results.
The individuals who chose the cheating-enabling environment also did not
report significantly more predictions than in the first and second rounds.
That is, as in Study 2 and in contrast to Study 1, our results in Study 3
did not show the escalation of cheating. It is again possible that the
effect in Study 3 could have been smaller due to the one-shot nature of
the game. Another possible explanation is that the escalation of cheating
may be driven by the worst fraudsters who substantially increase their
cheating rather than by incremental increases in cheating by those who
were previously honest. Since in Study 3, unlike in Study 1 and 2,
participants had only one trial, there was no room for escalation by
increasing cheating. Future research may explore this issue further.
5 General discussion
People choose different situations based on their personality and
preferences. In the case of cheating, the moral character of individuals
affects the situation selection (Cohen & Morse, 2014). Moral or
guilt-prone people are ready to stop behavior that could harm others and
even sacrifice financial reward to do so. On the other hand, unscrupulous
people seek such situations (Wiltermuth & Cohen, 2014). Accordingly, we
found that participants low in honesty-humility tend to prefer
cheating-enabling environments, where their rate of cheating can further
escalate.
Based on our results, we recommend enriching the experimental methodology
by including the possibility of selection of conditions by participants.
Experimental designs typically involve measurement of behavior in assigned
conditions, and even participants who would not prefer or encounter these
conditions in real life are forced to deal with them in an experiment.
While the ability to choose one’s circumstances may be sometimes limited,
inclusion of the possibility of self-selection of participants in
different conditions would allow for generalization of experimental
findings even in situations where people can select their environment and
it would thus improve external validity of experiments.
From a practical perspective, our results show the importance of
influencing self-selection of people into companies, departments, and
other groups. If individuals motivated only by self-interest perceive
public office as an opportunity to enrich themselves, the people with low
moral character will seek to become civil servants and politicians.
Indeed, studies conducted in India show that people who cheat in a
laboratory task are more likely to prefer public sector jobs (Banerjee,
Baul & Rosenblat, 2015; Hanna & Wang, 2017). Likewise, Ukrainian law
students who cheat and bribe in experimental games are more likely to
aspire to careers such as judges, prosecutors, and government lawyers
(Gans-Morse, 2019). On the other hand, the self-selection of honest people
exists in the Danish public sector (Barfort et al., 2019; for
cross-country analysis, see Olsen et al., 2018). Selection of honest
people in occupations in which dishonesty may have high societal costs
could often be more effective than efforts trying to reduce dishonesty of
people who have already chosen them.
The reported studies tested many effects, especially related to moderation
of the studied effects by personality characteristics. While some of the
tested effects were supported by strong evidence or replicated in a
subsequent study, other effects were supported by weaker evidence, or the
pattern of results between studies was more ambiguous. We did not control
the experiment-wise error rate because we were not primarily interested in
whether there is any significant association. However, the number of tested
effects means that there is a higher chance that some of them are falsely
positive or negative, and the positive results supported by weaker evidence
should be interpreted with caution and subject to future replications.
The design used in this article can be further extended in various ways. In
particular, it is possible that any determinants of cheating that have
been observed in experiments without taking self-selection into account
may not influence people who would be actually present in real-world
cheating-enabling environments (Houdek, 2017, 2019). Such environments may
include only individuals with low levels of honesty-humility personal
traits who are prepared to cheat regardless of any intervention. Moreover,
if an intervention makes cheating more reprehensible or costly to these
individuals, they may simply move to a similar environment without the
intervention. The self-selection may eventually negate any positive
effects of the intervention on the overall level of cheating (e.g.,
Nettle, Nott & Bateson, 2012). Future studies may directly test this
potential implication of our findings.
Another topic for future research are reasons for self-selection into
groups. These reasons might vary and result in a specific composition of a
group, which can further influence behavior of its present or future
members. For example, in certain professions (investment banker,
salesperson, advertiser), dishonesty or deception could be perceived as a
signal of a person’s skills, and honest people may therefore avoid these
professions. Such adverse selection could eventually lead to persistent
dishonesty in these professions (Gunia & Levine, 2016). Yet another
possibility for extension is to examine whether selection affects
enforcement and punishment. With more cheaters, enforcement and punishment
may be more diffused, which may attract additional cheaters in the group
(Conley & Wang, 2006). While we have considered a monetary fee associated
with the choice of the cheating-enabling environment, another possibility
is to include non-monetary costs — such as reputational — of choosing the
cheating-enabling environment. Finally, all the cheating behavior in our
experiments might have been perceived as basically victimless. Future
research may examine self-selection in cases where cheating has
identifiable victims.
References
Akın, Z. (2019). Dishonesty, social information, and sorting.
Journal of Behavioral and Experimental Economics, 80, 199–210.
http://dx.doi.org/10.1016/j.socec.2019.03.009.
Ashton, M. C., & Lee, K. (2009). The HEXACO-60: A short measure of the
major dimensions of personality. Journal of Personality
Assessment, 91(4), 340–345. http://dx.doi.org/10.1080/00223890902935878.
Babiak, P., Neumann, C. S., & Hare, R. D. (2010). Corporate psychopathy:
Talking the walk. Behavioral Sciences & the Law, 28(2), 174–193.
http://dx.doi.org/10.1002/bsl.925.
Balafoutas, L., Beck, A., Kerschbamer, R., & Sutter, M. (2013). What
drives taxi drivers? A field experiment on fraud in a market for credence
goods. The Review of Economic Studies, 80(3), 876–891. http://dx.doi.org/10.1093/restud/rds0.
Banerjee, R., Baul, T., & Rosenblat, T. (2015). On self selection of the
corrupt into the public sector. Economics Letters, 127, 43–46.
http://dx.doi.org/10.1016/j.econlet.2014.12.020.
Barfort, S., Harmon, N. A., Hjorth, F., & Olsen, A. L. (2019). Sustaining
honesty in public service: The role of selection. American
Economic Journal: Economic Policy, 11(4), 96–123. http://dx.doi.org/10.1257/pol.20170688.
Barkan, R., Ayal, S., & Ariely, D. (2015). Ethical dissonance,
justifications, and moral behavior. Current Opinion in
Psychology, 6(DEC), 157–161. http://dx.doi.org/10.1016/j.copsyc.2015.08.001.
Bauman, Y., & Rose, E. (2011). Selection or indoctrination: Why do
economics students donate less than the rest? Journal of Economic
Behavior & Organization, 79(3), 318–327. http://dx.doi.org/10.1016/j.jebo.2011.02.010.
Bayer, P., & Ross, S. L. (2006). Identifying individual and group
effects in the presence of sorting: A neighborhood effects application
(No. w12211). National Bureau of Economic Research. http://dx.doi.org/10.3386/w12211.
Benartzi, S., Beshears, J., Milkman, K. L., Sunstein, C. R., Thaler, R. H.,
Shankar, M., ... & Galing, S. (2017). Should governments invest more in
nudging? Psychological Science, 28(8), 1041–1055. http://dx.doi.org/10.1177/0956797617702501.
Bicchieri, C., & Dimant, E. (2019). Nudging with care: The risks and
benefits of social information. Public Choice. http://dx.doi.org/10.1007/s11127-019-00684-6.
Black, J. E. (2016). An introduction to the Moral Agency Scale.
Social Psychology, 47, 295–310. http://dx.doi.org/10.1027/1864-9335/a000284.
Bless, H., & Burger, A. M. (2016). A closer look at social psychologists’
silver bullet. Perspectives on Psychological Science, 11(2),
296–308. http://dx.doi.org/10.1177/1745691615621278.
Brassiolo, P., Estrada, R., Fajardo, G., & Vargas, J. F. (2020).
Self-Selection into Corruption: Evidence from the Lab (No. 018179).
Universidad del Rosario.
Cadsby, C., Song, F., & Tapon, F. (2010). Are you paying your employees to
cheat? An experimental investigation. The B.E. Journal of Economic
Analysis & Policy, 10(1), http://dx.doi.org/10.2202/1935-1682.2481.
Caprara, G. V., Steca, P., Zelli, A., & Capanna, C. (2005). A new scale
for measuring adults’ prosocialness. European
Journal of Psychological Assessment, 21(2), 77–89. http://dx.doi.org/10.1027/1015-5759.21.2.77.
Chan, J., Mojumder, P., & Ghose, A. (2019). The digital Sin City: An
empirical study of Craigslist’s impact on prostitution trends.
Information Systems Research, 30(1), 219–238. http://dx.doi.org/10.1287/isre.2018.0799.
Cheek, N. N. (2017). Scholarly merit in a global context: The nation gap in
psychological science. Perspectives on Psychological Science, 12,
1133–1137. http://dx.doi.org/10.1177/1745691617708233.
Cialdini, R., Li, Y. J., Samper, A., & Wellman, N. (2019). How bad apples
promote bad barrels: Unethical leader behavior and the selective attrition
effect. Journal of Business Ethics, 1–20. http://dx.doi.org/10.1007/s10551-019-04252-2.
Cohen, T. R., & Morse, L. (2014). Moral character: What it is and what it
does. Research in Organizational Behavior, 34, 43–61.
http://dx.doi.org/10.1016/j.riob.2014.08.003.
Cohn, A., Fehr, E., & Maréchal, M. A. (2014). Business culture and
dishonesty in the banking industry. Nature, 516(7529), 86–89.
http://dx.doi.org/10.1038/nature13977.
Cohn, A., Maréchal, M. A., Tannenbaum, D., & Zünd, C. L. (2019). Civic
honesty around the globe. Science, 365(6448), 70–73. http://dx.doi.org/10.1126/science.aau8712.
Conley, J. P., & Wang, P. (2006). Crime and ethics. Journal of
Urban Economics, 60(1), 107–123. http://dx.doi.org/10.1016/j.jue.2006.02.006.
Danaher, B., & Smith, M. D. (2014). Gone in 60 Seconds: The impact of the
Megaupload shutdown on movie sales. International Journal of
Industrial Organization, 33, 1–8. http://dx.doi.org/10.1016/j.ijindorg.2013.12.001.
De Vries, R. E., Tybur, J. M., Pollet, T. V., & Van Vugt, M. (2016). Evolution, situational affordances, and the HEXACO model of personality. Evolution and Human Behavior, 37(5), 407–421. https://dx.doi.org/10.1016/j.evolhumbehav.2016.04.001.
Detert, J. R., Treviño, L. K., & Sweitzer, V. L. (2008). Moral
disengagement in ethical decision making: a study of antecedents and
outcomes. Journal of Applied Psychology, 93(2), 374–391. http://dx.doi.org/10.1037/0021-9010.93.2.374.
Egan, M., Matvos, G., & Seru, A. (2019). The market for financial adviser
misconduct. Journal of Political Economy, 127(1),
233–295. http://dx.doi.org/10.1086/700735.
Elster, J. (2000). Ulysses unbound: Studies in rationality,
precommitment, and constraints. Cambridge: Cambridge University Press.
Faravelli, M., Friesen, L., & Gangadharan, L. (2015). Selection,
tournaments, and dishonesty. Journal of Economic Behavior &
Organization, 110, 160–175. http://dx.doi.org/10.1016/j.jebo.2014.10.019.
Frey, B. S., & Meier, S. (2003). Are political economists selfish and
indoctrinated? Evidence from a natural experiment. Economic
Inquiry, 41(3), 448–462. http://dx.doi.org/10.1093/ei/cbg020.
Gaines, B. J., & Kuklinski, J. H. (2011). Experimental estimation of
heterogeneous treatment effects related to self-selection.
American Journal of Political Science, 55(3), 724–736. http://dx.doi.org/10.1111/j.1540-5907.2011.00518.x.
Gans-Morse, J. (2019). Self-selection into corrupt judiciaries.
Northwestern Institute for Policy Research, Working Paper Series,
WP-19-15
Gino, F., & Ariely, D. (2012). The dark side of creativity: Original
thinkers can be more dishonest. Journal of Personality and Social
Psychology, 102(3), 445–459. http://dx.doi.org/10.1037/a0026406.
Gino, F., Krupka, E. L., & Weber, R. A. (2013). License to cheat:
Voluntary regulation and ethical behavior. Management Science,
59(10), 2187–2203. http://dx.doi.org/10.1287/mnsc.1120.1699.
Gunia, B. C., & Levine, E. E. (2016). Deception as competence: The effect
of occupation on ethical judgment and behavior. Academy of
Management Proceedings, 2016, 10780. http://dx.doi.org/10.5465/AMBPP.2016.10780abstract.
Hallsworth, M., List, J. A., Metcalfe, R. D., & Vlaev, I. (2017). The
behavioralist as tax collector: Using natural field experiments to enhance
tax compliance. Journal of Public Economics, 148, 14–31.
http://dx.doi.org/10.1016/j.jpubeco.2017.02.003.
Halpern, D. (2015). The rise of psychology in policy: The UK’s de facto
council of psychological science advisers. Perspectives on
Psychological Science, 10, 768–771. http://dx.doi.org/10.1177/1745691615609917.
Hanna, R., & Wang, S. Y. (2017). Dishonesty and selection into public
service: Evidence from India. American Economic Journal: Economic
Policy, 9(3), 262–90. http://dx.doi.org/10.1257/pol.20150029.
Hart, C. M., Ritchie, T. D., Hepper, E. G., & Gebauer, J. E. (2015). The
balanced inventory of desirable responding short form (BIDR-16).
Sage Open, 5(4), http://dx.doi.org/10.1177/2158244015621113.
Heck, D. W., & Moshagen, M. (2018). RRreg: An R package for correlation
and regression analyses of randomized response data. Journal of
Statistical Software, 85(2), 1–29. http://dx.doi.org/10.18637/jss.v085.i02ew/v085i02.
Heck, D. W., Thielmann, I., Moshagen, M., & Hilbig, B. E. (2018). Who
lies? A large-scale reanalysis linking basic personality traits to
unethical decision making. Judgment and Decision Making, 13(4),
356–371.
Heckman, J. J. (1990). Selection bias and self-selection. In J. Eatwell, M.
Milgate & P. Newman (Eds.), Econometrics (pp. 201–224). London:
Palgrave Macmillan UK.
Hennig-Schmidt, H., Jürges, H., & Wiesen, D. (2019). Dishonesty in health
care practice: A behavioral experiment on upcoding in neonatology.
Health Economics, 28(3), 319–338. https://doi.org/10.1002/hec.3842.
Henrich, J., Heine, S. J., & Norenzayan, A. (2010). The weirdest people in
the world? Behavioral and Brain Sciences, 33(2–3), 61–83. http://dx.doi.org/10.1017/S0140525X0999152X.
Hilbig, B. E., & Zettler, I. (2015). When the cat’s away, some mice will
play: A basic trait account of dishonest behavior. Journal of
Research in Personality, 57, 72–88. http://dx.doi.org/10.1016/j.jrp.2015.04.003.
Hilbig, B. E., Zettler, I., & Heydasch, T. (2012). Personality, punishment
and public goods: Strategic shifts towards cooperation as a matter of
dispositional honesty-humility. European Journal of Personality,
26(3), 245–254. http://dx.doi.org/10.1002/per.830.
Hodson, G., Book, A., Visser, B. A., Volk, A. A., Ashton, M. C., & Lee, K.
(2018). Is the dark triad common factor distinct from low
honesty-humility? Journal of Research in Personality, 73,
123–129. http://dx.doi.org/10.1016/j.jrp.2017.11.012.
Houdek, P. (2017). A perspective on research on dishonesty: Limited
external validity due to the lack of possibility of self-selection in
experimental designs. Frontiers in Psychology, 8(1566), 1–6. http://dx.doi.org/10.3389/fpsyg.2017.01566.
Houdek, P. (2019). Is behavioral ethics ready for giving business and
policy advice? Journal of Management Inquiry, 28(1), 48–56. http://dx.doi.org/10.1177/1056492617712894.
Jiang, T. (2013). Cheating in mind games: The subtlety of rules matters.
Journal of Economic Behavior & Organization, 93, 328–336. http://dx.doi.org/10.1016/j.jebo.2013.04.003.
Jones, D. N., & Paulhus, D. L. (2014). Introducing the short dark triad
(SD3) a brief measure of dark personality traits. Assessment,
21(1), 28–41. http://dx.doi.org/10.1177/1073191113514105.
Khadjavi, M. (2014). On the interaction of deterrence and emotions.
The Journal of Law, Economics, & Organization, 31(2),
287–319. http://dx.doi.org/10.1093/jleo/ewu012.
Klein, R. A. (2015). Attention Checking the “Many Labs” Participants: Did
Participant Attention Moderate the Included Effects? (poster). Retrieved
from osf.io/d2tek.
Kleinlogel, E. P., Dietz, J., & Antonakis, J. (2018). Lucky, competent, or
just a cheat? Interactive effects of honesty-humility and moral cues on
cheating behavior. Personality and Social Psychology Bulletin,
44(2), 158–172. http://dx.doi.org/10.1177/0146167217733071.
Levitt, S. D., & Syverson, C. (2008). Market distortions when agents are
better informed: The value of information in real estate transactions.
The Review of Economics and Statistics, 90(4), 599–611.
McDonald, R. I., & Crandall, C. S. (2015). Social norms and social
influence. Current Opinion in Behavioral Sciences, 3, 147–151.
http://dx.doi.org/10.1016/j.cobeha.2015.04.006.
Mead, N. L., Baumeister, R. F., Gino, F., Schweitzer, M. E., & Ariely, D.
(2009). Too tired to tell the truth: Self-control resource depletion and
dishonesty. Journal of Experimental Social Psychology,
45(3), 594–597. http://dx.doi.org/10.1016/j.jesp.2009.02.004.
Moshagen, M., & Hilbig, B. E. (2017). The statistical analysis of cheating
paradigms. Behavior Research Methods, 49(2), 724–732.
http://dx.doi.org/10.3758/s13428-016-0729-x.
Mubako, G., Bagchi, K., Udo, G., & Marinovic, M. (2020). Personal values
and ethical behavior in accounting students. Journal of Business
Ethics, 1–16. http://dx.doi.org/10.1007/s10551-020-04606-1.
Mullainathan, S., Noeth, M., & Schoar, A. (2012). The market for
financial advice: An audit study (No. w17929). National Bureau of
Economic Research. http://dx.doi.org/10.3386/w17929 .
Nettle, D., Nott, K., & Bateson, M. (2012). ‘Cycle thieves, we are
watching you’: Impact of a simple signage intervention against bicycle
theft. PLOS ONE, 7(12), e51738. http://dx.doi.org/10.1371/journal.pone.0051738.
Novakova, J., Houdek, P., Jolič, J., & Flegr, J. (2018). Experimental
assessment of cheating prevalence in the Czech Republic as an example of a
post-communist country. Deviant Behavior, 39(9), 1217–1228. http://dx.doi.org/10.1080/01639625.2017.1410381.
Olsen, A. L., Hjorth, F., Harmon, N., & Barfort, S. (2018). Behavioral
dishonesty in the public sector. Journal of Public Administration
Research and Theory, 29(4), 572–590. http://dx.doi.org/10.1093/jopart/muy058.
Pascual-Ezama, D., Fosgaard, T. R., Cardenas, C., Kujal, P., Veszteg, R.,
Gil-Gómez de Liaño, B., ... Brañas-Garza, P. (2015). Context dependent
cheating: Experimental evidence from 16 countries. Journal of
Economic Behavior & Organization, 116, 379–386. http://dx.doi.org/10.1016/j.jebo.2015.04.020 .
Pfattheicher, S., Schindler, S., & Nockur, L. (2019). On the impact of
honesty-humility and a cue of being watched on cheating behavior.
Journal of Economic Psychology, 71, 159–174. http://dx.doi.org/10.1016/j.joep.2018.06.004.
Poon, K. T., Chen, Z., & DeWall, C. N. (2013). Feeling entitled to more:
Ostracism increases dishonest behavior. Personality and Social
Psychology Bulletin, 39(9), 1227–1239. http://dx.doi.org/10.1177/0146167213493187.
Rabin, M., & Vayanos, D. (2010). The gambler’s and
hot-hand fallacies: Theory and applications. The Review of
Economic Studies, 77(2), 730–778. http://dx.doi.org/10.1111/j.1467-937X.2009.00582.x.
Ring, C., Kavussanu, M., Gürpınar, B., Whitehead, J., & Mortimer, H.
(2020). Basic values predict unethical behavior in sport: The case of
athletes’ doping likelihood. Ethics & Behavior, 1–9. http://dx.doi.org/10.1080/10508422.2020.1837136.
Sassenrath, C. (2020). “Let me show you how nice I am”: Impression
management as bias in empathic responses. Social Psychological and
Personality Science, 11(6), 752–760. http://dx.doi.org/10.1177/1948550619884566.
Schelling, T. C. (2006). Strategies of commitment and other
essays. Cambridge: Harvard University Press.
Schneider, H. S. (2012). Agency problems and reputation in expert services:
Evidence from auto repair. The Journal of Industrial Economics,
60(3), 406–433. http://dx.doi.org/10.1111/j.1467-6451.2012.00485.x.
Schultz, P. W., Nolan, J. M., Cialdini, R. B., Goldstein, N. J., &
Griskevicius, V. (2007). The constructive, destructive, and reconstructive
power of social norms. Psychological Science, 18(5), 429–434.
http://dx.doi.org/10.1111/j.1467-9280.2007.01917.x.
Schwartz, S. H., Cieciuch, J., Vecchione, M., Davidov, E., Fischer, R.,
Beierlein, C., ... & Konty, M. (2012). Refining the theory of basic
individual values. Journal of Personality and Social Psychology,
103(4), 663–688. http://dx.doi.org/10.1037/a0029393.
Ścigała, K. A., Schild, C., Heck, D. W., & Zettler, I. (2019). Who deals
with the devil? Interdependence, personality, and corrupted collaboration.
Social Psychological and Personality Science, 10(8), 1019–1027.
http://dx.doi.org/10.1177/1948550618813419.
Shalvi, S., Eldar, O., & Bereby-Meyer, Y. (2012). Honesty requires time
(and lack of justifications). Psychological Science, 23(10),
1264–1270. http://dx.doi.org/10.1177/0956797612443835.
Shalvi, S., Gino, F., Barkan, R., & Ayal, S. (2015). Self-serving
justifications: Doing wrong and feeling moral. Current Directions
in Psychological Science 24(2), 125–130. http://dx.doi.org/10.1177/0963721414553264.
Shampanier, K., Mazar, N., & Ariely, D. (2007). Zero as a special price:
The true value of free products. Marketing Science,
26(6), 742–757. http://dx.doi.org/10.1287/mksc.1060.0254.
Sherman, R. A., Rauthmann, J. F., Brown, N. A., Serfass, D. G., & Jones,
A. B. (2015). The independent effects of personality and situations on
real-time expressions of behavior and emotion. Journal of
Personality and Social Psychology, 109(5), 872–888. http://dx.doi.org/10.1037/pspp0000036.
Shu, L. L., Gino, F., & Bazerman, M. H. (2011). Dishonest deed, clear
conscience: When cheating leads to moral disengagement and motivated
forgetting. Personality and Social Psychology Bulletin,
37(3), 330–349. http://dx.doi.org/10.1177/0146167211398138.
Teubner, T., Adam, M., & Niemeyer, C. (2015). Measuring risk preferences
in field experiments: Proposition of a simplified task. Economics
Bulletin, 35(3), 1510–1517.
Thaler, R. H., & Sunstein, C. R. (2008). Nudge: Improving
decisions about health, wealth, and happiness. New Haven: Yale University
Press.
Van Rijckeghem, C., & Weder, B. (2001). Bureaucratic corruption and the
rate of temptation: do wages in the civil service affect corruption, and
by how much? Journal of Development Economics, 65(2), 307–331.
http://dx.doi.org/10.1016/S0304-3878(01)00139-0.
Vranka, M. A., & Bahník, Š. (2018). Predictors of bribe-taking: The role
of bribe size and personality. Frontiers in Psychology, 9(1511),
1–9. http://dx.doi.org/10.3389/fpsyg.2018.01511.
Walton, G. M., & Wilson, T. D. (2018). Wise interventions: Psychological
remedies for social and personal problems. Psychological Review,
125(5), 617–655. http://dx.doi.org/10.1037/rev0000115.
Wiltermuth, S. S., & Cohen, T. R. (2014). “I’d only let you down”: Guilt
proneness and the avoidance of harmful interdependence. Journal of
Personality and Social Psychology, 107(5), 925–942. http://dx.doi.org/10.1037/a0037523.
Wiltermuth, S. S., Newman, D. T., & Raj, M. (2015). The consequences of
dishonesty. Current Opinion in Psychology, 6, 20–24. http://dx.doi.org/10.1016/j.copsyc.2015.03.016.
Zettler, I., & Hilbig, B. E. (2010). Honesty-humility and a
person-situation interaction at work. European Journal of
Personality, 24(7), 569–582. http://dx.doi.org/10.1002/per.757.
Zettler, I., Hilbig, B. E., Moshagen, M., & de Vries, R. E. (2015).
Dishonest responding or true virtue? A behavioral test of impression
management. Personality and Individual Differences, 81, 107–111.
http://dx.doi.org/10.1016/j.paid.2014.10.007.
Zhong, C. B., Bohns, V. K., & Gino, F. (2010). Good lamps are the best
police: Darkness increases dishonesty and self-interested behavior.
Psychological Science, 21(3), 311–314. http://dx.doi.org/10.1177/0956797609360754.
This document was translated from LATEX by
HEVEA.