Judgment and Decision Making, Vol. 15, No. 6, November 2020, pp. 972-988
Kilo what? Default units increase value sensitivity in joint evaluations of energy efficiency
Mario Herberz* #
Tobias Brosch# $
Ulf J. J. Hahnel$ ! |
The unit in which numerical information is presented can have a strong influence on how decision makers evaluate and choose between available choice options. The present work examines the influence of frequently used default units on judgments and decisions of energy efficiency. Across three experiments (Ntotal = 497), our results provide evidence that value sensitivity increases by about 25% in joint evaluation mode when a product attribute is presented in the default unit versus a non-default unit. As a result, presenting an attribute in the default unit led to more favorable evaluations of superior products and less favorable evaluations of inferior products. This result was robust to changes in the numerical magnitude of the non-default unit. Moreover, when joint evaluation was performed across different units, products described using the default unit were evaluated more favorably than products described using a non-default unit. More favorable evaluations based on the default unit translated into a higher willingness to pay for efficiency advantages. We discuss the theoretical and practical implications of default units to guide informed consumer judgments and effective energy efficiency labeling.
Keywords: default units, unit effect, evaluability, joint vs. separate evaluation mode, consumer behavior
1 Introduction
When considering and comparing products for purchase, consumers are constantly confronted with the challenge to judge and integrate numerical product information. While numerical information is crucial for optimal decision making, it can be presented in more or less comprehensible and evaluable ways. For instance, consumers who want to purchase a new car can be confronted with various units of consumption for different technologies: consumption information for combustion engines is usually presented as liters or gallons of fuel, for electric cars as kWh electricity, and for natural gas cars as m3 gas. From a rational actor perspective, consumption information should guide consumer decision making independently of the specific unit used to describe it, given that these units can be linearly transformed into one another. However, as illustrated by decades of research on bounded rationality, decision makers do not process information in an entirely rational way (Gigerenzer & Todd, 1999; Kahneman, Slovic, Tversky & Press, 1982). Instead, they often apply heuristic decision rules that can result in behavior with detrimental outcomes for individual or collective interests when the decision environment is not adapted to the available cognitive resources and abilities (e.g., Attari, DeKay, Davidson & Bruine de Bruin, 2010; Marghetis, Attari & Landy, 2019). For instance, judgments and decisions based on numerical information have been shown to be driven by aspects such as: numerosity, inferring larger quantities from larger numbers (Pelham, Sumarta & Myaskovsky, 1994); evaluability, weighing numbers differently in function of their ease of evaluation (Hsee, 1996b); and affective content, being more sensitive to numerical differences of numbers illustrated with low affect dots than of numbers illustrated with high affect pictures (e.g., of pandas in the context of environmental donations, Hsee & Rottenstreich, 2004).
The influence of numerical information on judgments and decisions has been subject to a growing field of research (Aribarg, Burson & Larrick, 2017; Burson, Larrick & Lynch Jr, 2009; Hsee, Rottenstreich & Xiao, 2005; Lembregts & Pandelaere, 2013; Pandelaere, Briers & Lembregts, 2011; Ungemach, Camilleri, Johnson, Larrick & Weber, 2018). However, few studies have examined the value sensitivity of decision makers across the entire range of a numerical attribute by including repeated evaluations of the same attribute in their experimental designs. For example, increased sensitivity to more numerous configurations of a unit have traditionally been investigated with one-shot decision or evaluation tasks using between-subjects designs (e.g., Burson et al., 2009; Pandelaere et al., 2011; Schley, Lembregts & Peters, 2017). While it is uncontested that such studies have yielded important insights, repeated and mixed experimental designs provide a more fine-grained perspective on the investigation of value sensitivity. Specifically, repeated evaluations allow contrasting the value sensitivity of different units that may describe the same attribute (e.g., liters/gallons and kWh for fuel consumption) across the entire attribute range, while considering different characteristics of a unit, such as its ease of evaluation and its numerical magnitude.
The present research involves repeated evaluations and so contributes to the understanding of when and how the evaluability of a given unit may dominate over a numerosity or unit effect (e.g., Pandelaere et al., 2011). More specifically, we focus on the symbolic numerosity of arabic numerals (i.e., 1 l = 1000 ml) in contrast to perceptual numerosity which refers to variations in the number of elements representing an identical quantity (e.g., ••••• = ••••••••••, for a review of the distinction see Lembregts & Van Den Bergh, 2018; Pelham et al., 1994). We investigate the influence of default units, the units most frequently used in a given context, on product evaluations. We argue that the status as a default unit has a greater influence on value sensitivity than its numerical magnitude, a boundary condition largely overlooked by previous research illustrating the unit effect (i.e., higher numbers leading to higher value sensitivity; Burson et al., 2009). Drawing on the evaluability hypothesis (Hsee, 1996b), the research presented here contributes to the literature on default units and the unit effect in different evaluation modes. Our results moreover reveal that modifying the units used to provide fuel efficiency information can facilitate the choice of more fuel-efficient cars, an insight readily applicable by practitioners.
In the following, we review the literature on how different presentations of numerical information influence judgments and decisions, which reveals that both more easily evaluable units and units with a higher numerosity increase value sensitivity and preference for a superior option. However, it remains unclear how judgments based on difficult-to-evaluate non-default units polarize between the two targets in a joint evaluation task and thus produce results that make it seem as if higher numerosity increases value sensitivity. We point to the need for more research that jointly investigates how the evaluability associated with a given unit (e.g., its status as a default unit) and its numerosity interact to influence decision makers’ sensitivity to attribute differences. The present work addresses this issue by applying a wide range of stimuli that differ in both evaluability and numerosity.
1.1 The influence of numerical information on JDM
Research on judgment and decision making has illustrated how different ways
of presenting numerical information can systematically influence
perceptions and preferences (Aribarg et al., 2017; Bagchi & Davis, 2016;
Burson et al., 2009; Camilleri & Larrick, 2014; Hsee, Yu, Zhang & Zhang,
2003; Hsee & Zhang, 2010; Lembregts & Pandelaere, 2013; Monga & Bagchi,
2012; Pandelaere et al., 2011). In particular, the impact of the
evaluability of numerical attributes on judgments and decisions has
attracted a great deal of research attention over the past decades (Chin &
Bruine de Bruin, 2019; Hsee, 1996a, 1996b, 1998, 2006; Hsee, Blount,
Loewenstein & Bazerman, 1999; Hsee et al., 2005). Evaluability refers to
the ease with which a target attribute value can be mapped onto a
subjective evaluation. In general, the sensitivity of subjective
evaluations is higher the more reference information about the value
distribution of an attribute is available to the decision maker (Hsee &
Zhang, 2010). One way of ensuring the availability of reference information
is through the use of an attribute unit for which decision makers possess a
high degree of knowledge. For example, the size of a 10-carat jewel is more
easily evaluable for a jewelry expert than for a jewelry novice. As a
consequence, the expert is more sensitive to differences in jewel size than
the novice. Among the broader public, there is typically a high degree of
knowledge concerning widely established default units. A default unit is
the most frequently used unit to describe an attribute in a given
context. For instance, product warranty is usually communicated in years,
phone tariffs in minutes, and digital storage in giga-bytes. Moreover, for
European consumers the default unit for fuel consumption is liters, while
for US consumers the default unit is gallons. Evaluations based on default
units should be more stable and sensitive to attribute differences due to
more available reference information. In contrast, evaluations based on
non-default units should be more malleable and susceptible to influences by
contextual elements due to a lack of knowledge and reference
information. Thus, a superior product should be evaluated more favorably
and an inferior product less favorably when the relevant attribute is
presented in a default unit as compared to a non-default unit. Consistent
with this argument, previous research has found that default units improved
product evaluations (Lembregts & Pandelaere, 2013) and resulted in higher
decision weights in conjoint analyses by increasing discriminability
(Aribarg et al., 2017). The latter study found that numerical expansion of
an attribute (e.g., days — hours — minutes) followed a u-shaped
relationship with respect to the decision weight attached to the
attribute. Participants attached the highest decision weights to the most
discriminable unit of an attribute (e.g., minutes exercise time), which can
also be described as the default unit. However, Aribarg et al.’s (2017)
research focused mainly on the numerical magnitude of units describing the
same attribute and included only a relatively narrow range of values per
attribute unit, a range that did not allow the investigation of value sensitivity
within one unit. To the best of our knowledge, the present research is the
first to investigate how evaluability and default status influence repeated
evaluations across the entire range of different attribute units while
taking into account numerical unit magnitude.
1.1.1 Numerosity and the unit effect
Decision makers have been shown to rely on the numerosity heuristic, that is, they infer larger quantities from larger numbers (Pelham et al., 1994). For instance, participants more strongly preferred a movie plan including a higher number of movies when the number of movies was inflated to the scale of movies per year as compared to movies per week (Burson et al., 2009). Similarly, participants more strongly preferred a superior home cinema system when its quality rating was expressed on a 1000-point scale as compared to a 10-point scale (Pandelaere et al., 2011). Generally speaking, decision makers have been found to more strongly identify the superiority of a product when an attribute is presented on an expanded scale (e.g., costs per year vs. per month) or in a smaller unit (e.g., grams vs. kilograms). This reliance on numerical magnitude for judgment and decision making has been termed the unit effect (Bagchi & Davis, 2016; Burson et al., 2009; Camilleri & Larrick, 2014; Hsee et al., 2003; Monga & Bagchi, 2012; Pandelaere et al., 2011). The unit effect has been explained by decision makers’ tendency to be in a concrete mind-set, focusing more strongly on task features that are concrete (e.g., numbers) rather than abstract (e.g., units; Monga & Bagchi, 2012; Trope, Liberman & Wakslak, 2007).
In the present research, we aim to investigate how the status of a unit as a default unit interacts with its numerical magnitude, and examine the conditions under which default units may affect judgments more strongly than numerical magnitude. We will do this while considering the influence of the evaluation mode, which refers to whether a target option is evaluated in isolation (separate) or in comparison to other options (joint). Previous research has suggested that the evaluation mode plays an important role for the occurrence of a default unit effect and the unit effect (Lembregts & Pandelaere, 2013; Schley et al., 2017).
1.2 Joint vs. separate evaluation
The influence of evaluation modes on judgment and decision making has received considerable attention in the literature (Bazerman, Loewenstein & White, 1992; Bohnet, van Geen & Bazerman, 2016; González-Vallejo & Moran, 2001; Hsee, 1996b, 1998, 2006; Hsee et al., 2005; Hsee & Zhang, 2010; Schley et al., 2017; Tan, Lv, Liu & Gursoy, 2018). Joint evaluation refers to a comparative evaluation of multiple targets, while separate evaluation refers to the evaluation of targets in isolation. Arguably, all judgments and decisions can be placed somewhere on the continuum between separate and joint evaluation, depending on the extent to which they allow for comparative processing in evaluations (Hsee et al., 1999). For instance, sequential evaluations of multiple targets require separate judgments but also allow for joint comparisons based on the memory of previously evaluated targets (Schley et al., 2017).
Of particular relevance to the present research, different evaluation modes may influence the effect of default units on consumer evaluations. Specifically, Lembregts and Pandelaere (2013) found that in a separate evaluation mode, the use of a default unit led to higher product preferences than the use of a non-default unit, which was attributed to a higher processing fluency of the default unit. In a separate evaluation mode, participants evaluated a cell phone more favorably when its warranty was described in the default unit (2 years) as compared to when it was described in a more numerous non-default unit (720 days), indicating a predominant influence of the default unit even when its numerosity was relatively low. However, in a joint evaluation mode, the effect of default units reversed, with evaluations of the same cell phone being more favorable when warranty was described in days instead of years. Lembregts and Pandelaere (2013) ascribed this preference reversal to a unit effect in the joint evaluation mode due to the higher salience of numerical differences (e.g., Burson et al., 2009; Monga & Bagchi, 2012). As we will elaborate in the next section, however, this effect can alternatively be accounted for by the lower evaluability of the non-default unit and the presence of an inferior alternative option in joint evaluation.
1.3 Malleable joint evaluations of non-default units
Judgments in a separate evaluation mode have been shown to be strongly
driven by highly evaluable attributes (e.g., attributes presented with a
default unit), while judgments in a joint evaluation mode are additionally
driven by less evaluable attributes (e.g., attributes presented with a
non-default unit; Bohnet et al., 2016; González-Vallejo & Moran, 2001;
Hsee, 1996b, 1998, 2006; Hsee et al., 1999). For example, a low
evaluability attribute such as warranty expressed in days more strongly
drives evaluations when reference information is provided in a joint
evaluation mode. We want to argue here that the low evaluability of a
non-default unit renders evaluations malleable and context-dependent. In
joint evaluations based on non-default units, presenting a superior or
inferior alternative option in addition to the target option substantially
influences evaluations, because the alternative option provides exactly one
single reference value that decision makers can use to anchor and orient
their evaluations. While separate evaluations of non-default units are
likely to be placed somewhere towards the middle of an evaluative scale, an
inferior alternative polarizes evaluations of the target option towards the
positive end of the scale, and a superior alternative polarizes evaluations
towards the negative end of the scale. Consistent with this, research has
shown that evaluations and choices polarize based on low evaluability
attributes in joint evaluation mode (e.g., Hsee, 1996b). Using a diverse
stimulus selection including a balanced set of inferior and superior
alternative options as well as an aggregation across multiple evaluations
can thus be expected to eliminate the polarizing influence of singular
reference information in joint evaluation mode. This effect can yield a
more robust assessment of the influence of default versus non-default units
on judgments and decisions.
We moreover suggest that some previous findings of a unit effect in the joint evaluation mode may have been the result of a confound of more numerous units with non-default units (Lembregts & Pandelaere, 2013; Schley et al., 2017). For instance, research that found evidence for a unit effect with smaller units (and thus bigger numbers; e.g., TV size in inches) in contrast to larger units (and thus smaller numbers; e.g., TV size in centimeters) confounded small unit sizes with default units and larger unit sizes with non-default units in joint evaluation (Schley et al., 2017). From an evaluability perspective, participants may have simply been more sensitive to differences between default units (e.g., inches), which made their judgments more stable and independent of evaluation mode. In contrast, judgments based on non-default units (e.g., centimeters), may have been more malleable and susceptible to polarization by reference information provided in the joint evaluation mode. We assume that changes in numerosity, no matter in which direction, will be less effective in increasing value sensitivity than switching from a non-default to a default unit. The underlying rationale for this assumption is that people should be best calibrated to the value distribution of a default unit, which should result in the highest level of evaluability and thus value sensitivity, independent of evaluation mode or numerical magnitude. Previous research supports the idea that unit characteristics which increase evaluability independent of numerical magnitude (e.g., expressing units in more discrete quantities: chocolate bars vs. grams of chocolate) increase value sensitivity (Lembregts & Van Den Bergh, 2018).
1.4 Aim of the present research
We address the need for a more systematic consideration of the impact of default units to disentangle effects inherent to changes between a default and a non-default unit and effects inherent to changes in the numerosity of a unit. Moreover, we consider the distinction between the joint evaluation of two alternatives described with the same unit and the joint evaluation of two alternatives described with different units, which we refer to as cross-unit evaluation. This deviation from the classic joint evaluation mode can provide theoretically and practically relevant insights into the influence of different evaluation modes.
Previous research has demonstrated that high knowledge and evaluability associated with default units as well as higher numerosity both increase preferences of superior choice options (Burson et al., 2009; Hsee, 1996b; Hsee et al., 1999, 2005; Lembregts & Pandelaere, 2013; Monga & Bagchi, 2012; Pandelaere et al., 2011). However, there remains ambiguity about the conditions under which one of the two factors dominates the other in affecting judgments and decisions. We suggest that the use of default units is likely to result in high value sensitivity due to their high evaluability, even when their numerical magnitude is smaller. We further want to provide empirical evidence for the argument that previous findings of a unit effect might have been driven by differences in the evaluability of units. Supporting evidence would suggest that the occurrence of a unit effect might be conditional to the absence of a default unit in the evaluation task.
1.5 Overview of the current research and hypotheses
We address the research questions developed above in the context of vehicle
fuel efficiency, which lends itself perfectly to test our hypotheses, since
vehicle consumption information is provided in default and non-default
units (i.e., liters for conventional cars and kWh for electric cars). This
can require consumers to make joint evaluations between options of the same
technology described in the same unit as well as cross-unit evaluations of
technologies described in different units. Experiment 1 investigates
consumers’ sensitivity to differences in fuel consumption that are either
presented in the default unit liters per 100 km or in the non-default,
numerically larger unit kWh per 100 km in joint evaluation. Experiment 2
replicates the findings from Experiment 1 and extends them to a numerically
smaller non-default unit, gallons per 100 km. Experiment 3 investigates the
effect of joint versus cross-unit evaluations of products described with a
default versus non-default unit. We moreover measured willingness to pay to
ask whether differences in evaluations translate to a relevant behavioral
outcome. Finally, we provide an overall estimate of the effect size of the
higher value sensitivity of default units (vs. non-default units) in joint
evaluation mode across all experiments.
Hypothesis 1:
We expect that joint evaluations of product information described using a default unit lead to higher value sensitivity compared to evaluations of products described in non-default units (Hsee, 1996b). To rule out that a higher value sensitivity is due to a confound of default units with small numbers (which have shown to be processed more easily; Harvey, Klein, Petridou & Dumoulin, 2013), we investigate the predicted effect using both a numerically larger and a numerically smaller non-default unit.
Hypothesis 2:
We expect less favorable evaluations of high-efficiency products described with a non-default unit in a cross-unit evaluation mode (i.e., across different units) than in a joint evaluation mode, complementing previous findings of a default unit effect (Lembregts & Pandelaere, 2013).
Hypothesis 3:
We expect differences in evaluations of default and non-default units to translate into lower willingness to pay for the efficiency advantages of high efficiency products (which tend to be described with non-default units; e.g., kWh for electric vehicles on current car energy labels across the world) in cross-unit as compared to joint evaluations.
2 Experiment 1
Experiment 1 was designed to test Hypothesis 1, which states that value sensitivity in joint evaluation is higher when using a default unit as compared to a non-default unit. Participants evaluated the environmental friendliness of cars in a joint evaluation mode. As a basis for their evaluations, participants were provided with information on consumption, which we experimentally manipulated to be presented in the default unit liters or in the non-default unit kWh.
2.0.1 Default unit pretest
Before conducting Experiment 1, we ran a pretest on a separate sample to show that (i) liters per 100 km is the default unit for fuel consumption whereas kWh per 100 km is not, and (ii) subjective evaluability is higher for the default unit liters per 100 km than for the non-default unit kWh per 100 km. As part of a larger survey, Swiss university students (N = 194) answered the following two questions: “How familiar are you with fuel consumption being expressed in liters per 100 km [kWh per 100 km]?” and “How easy is it for you to evaluate fuel consumption expressed in liters per 100 km [kWh per 100 km]?”. Response options ranged from 1 = “not familiar at all” to 7 = “extremely familiar” and from 1 = “not easy at all” to 7 = “extremely easy”. The results of one sample t-tests confirmed that in a car consumption context, liters per 100 km (M = 3.54, SD = 2.19) was more familiar than kWh per 100 km (M = 1.80, SD = 1.16), t(293.81) = 9.76, p < .001. In addition, liters per 100 km (M = 3.83, SD = 2.25) was judged as more evaluable than kWh per 100 km (M = 2.19, SD = 1.54), t(340.56) = 8.4, p < .001.
2.1 Method
2.1.1 Participants
A sample of German car drivers (N = 187, 104 women) was recruited online via a market research institute and provided informed consent to their participation in accordance with the requirements of the local ethics commission. Sample size was determined based on an a priori target of 90 participants per condition, assuming a small effect size of our manipulation. All participants reported that they possessed a driver’s license. The mean age was 50.7 years (SD = 13.9). The completion of the experiment took 10 minutes for which participants were compensated with 2€.
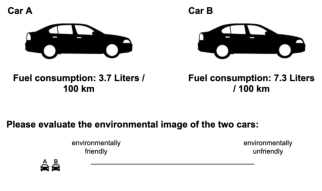
| Figure 1: Example of the evaluation task in the liter condition. Depending on experimental condition, fuel (energy) consumption was displayed in liters or kWh. Participants evaluated environmental friendliness of the cars by placing the respective miniature car icons on the scale from “environmentally friendly” (1) to “environmentally unfriendly“ (100). For copyright reasons neutral stimulus material from Experiment 3 is displayed here instead of the actual car images used in Experiment 1 and 2. |
2.1.2 Design and evaluation task
Participants were assigned to either the liter (n = 90) or the kWh (n = 97) between-subjects condition, which determined whether they had to evaluate cars based on their consumption in liters per 100 km or in kWh per 100 km. Ten evaluation trials constituted the within-participant factor. Participants were asked to jointly evaluate the environmental friendliness of ten pairs of cars from 1 = “environmentally friendly” to 100 = “environmentally unfriendly” (see Figure 1 for an illustration of the task). Cars consumed 3.7, 5.5, 7.3, 9.1 and 10.9 liters (or 31.5, 46.8, 62.1, 77.4 and 92.7 kWh) per 100 km and were presented in every possible pairing. Standardized image material of actual cars was used to illustrate each level of consumption. Trial order was randomized. In order to obtain a reliable measure of the evaluations for every car, ratings were aggregated across the five trials in which the same car appeared. After completing the evaluation trials, participants rated the attractiveness of each car and brand separately on scales ranging from 1 = “very unattractive” to 7 = “very attractive”.
2.2 Results
We computed a linear mixed-effects model with environmental image as the dependent variable, using Satterthwaite’s method to approximate denominator degrees of freedom. Unit (default: liter, non-default: kWh), level of consumption, and the interaction term of unit and level of consumption were included as fixed effects. In a second step, participants’ car and brand attractivity ratings were included as covariates to ensure the robustness of the results in the face of the real car stimuli used. All continuous variables in the present experiments were z-standardized. The best fitting random effect structure was determined by maximizing complexity while minimizing AIC and BIC (Barr, Levy, Scheepers & Tily, 2013; Fitzmaurice, Laird & Ware, 2004). A model with random intercepts for participants and cars as well as random slopes for level of consumption within participants best represented the data (see Appendix A for details).
Participants were more sensitive to consumption differences when presented in liters than in kWh. As illustrated in Figure 2, level of consumption and the interaction of unit (liter vs. kWh) with level of consumption were significant predictors of the environmental image ratings. The main effect of level of consumption on environmental ratings, b = 0.86, se = 0.06 , t(7.62) = 15.39, p < .001, indicated that higher levels of consumption were associated with lower environmental ratings. There was no significant main effect of unit, b = −0.08, se = 0.07, t(185.0) = −1.03, p = .304. However, the interaction of level of consumption and unit was significant, F(1,184.99) = 15.5, p < .001. The interaction indicated a stronger relationship with a steeper slope between level of consumption and environmental ratings in the liter condition than in the kWh condition, bdif = 0.19, se = 0.05, t(185.0) = 3.94, p < .001. The inclusion of car and brand attractivity as covariates did not alter the results. A significant main effect of car attractivity, b = −0.11, se = 0.05, t(183.0) = −2.45, p = .015, indicated that more attractive cars were evaluated more favorably with respect to their environmental image. Brand attractivity was not a significant predictor of environmental image, b = −0.07, se = 0.05, t(183.0) = −1.50, p = .136.
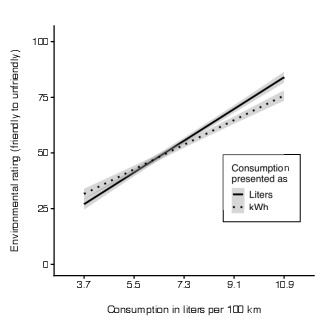
| Figure 2: Environmental image ratings as a function of level of consumption and unit. The steeper slope in the liter condition compared to the kWh condition indicates a higher value sensitivity to consumption differences when consumption is presented in the default unit liters per 100 km. Linear regression lines are depicted with 95% confidence intervals. |
2.3 Discussion
Experiment 1 provided first evidence for Hypothesis 1, which states that in joint evaluation mode consumers are more sensitive to fuel consumption differences when consumption is presented in the default unit liters than in the non-default unit kWh. This finding is in line with evaluability theory (Hsee, 1996b; Hsee & Zhang, 2010): Due to the high familiarity with the default unit, liters per 100 km, the available reference information allowed participants to accurately evaluate levels of consumption. In contrast, fewer reference information for the non-default unit, kWh per 100 km, resulted in less pronounced evaluations of the environmental image of cars. Although the repeated joint evaluation task of our paradigm provided ad-hoc reference information about the distribution of consumption, participants were still less sensitive to differences in the non-default unit (kWh) than in the default unit (liters). This finding supports our suggestion that in joint evaluation mode the status as a default unit dominates unit numerosity in producing more pronounced judgments, contrary to what would be expected based on findings of a unit effect (e.g., Pandelaere et al., 2011).
An alternative explanation for the results from Experiment 1 could, however, be provided by the confound of default units with small numbers (Coupland, 2011; Lembregts & Pandelaere, 2013) and the generally easier processing of small numbers (Harvey et al., 2013). Experiment 2 addresses this possibility by including a numerically smaller non-default unit, gallons per 100 km, in an additional experimental condition.
3 Experiment 2
Experiment 2 was designed to replicate and extend our finding from Experiment 1, aiming to rule out easier processing of smaller numbers (Harvey et al., 2013) as an alternative explanation. To provide additional support for Hypothesis 1, we added the presentation of fuel consumption in gallons per 100 km, a non-default unit in a European context which is less numerous than the default unit liters (1 gallon = 3.8 liters). If the increased sensitivity to consumption differences in the liter condition can be accounted for by easier processing of smaller numbers, participants should be even more sensitive to differences of consumption when presented in the smaller unit gallons per 100 km. In addition to environmental image, participants moreover evaluated the consumption level of the cars, which should make evaluations less susceptible to the influence of individual differences (e.g., environmental values; Ungemach et al., 2018).
Moreover, participants in the kWh and the gallon condition were provided with the linear transformations of the non-default units and the default unit liters per 100 km. By this measure, we provided the necessary information for a rational agent to overcome the default unit effect. However, consistent with boundedly rational information processing (Kahneman et al., 1982), we expected participants to imperfectly integrate this information and hence still be most sensitive to consumption differences in the default unit. We hypothesized comparably low value sensitivity for kWh and gallons, based on their common characteristic of being a non-default unit.
3.1 Method
3.1.1 Participants
We recruited a Swiss University student sample (N = 174). Participants received course credit for their participation. We aimed to recruit a maximum number of students taking a course taught by one of the authors. Three participants had to be dropped due to incomplete data, which left 171 participants for the final analysis (150 women; Mage = 22.3, SDage = 4.47). Participants completed the experiment online, and it took them about ten minutes.

| Figure 3: Consumption ratings as a function of level of consumption and unit. The steeper slope in the liter condition compared to the kWh and the gallon condition indicates a higher value sensitivity to consumption differences for the default unit liters per 100 km. Linear regression lines are depicted with 95% confidence intervals. |
3.1.2 Design and evaluation task
We used the same paradigm and stimuli as in Experiment 1 and added consumption in gallons as an additional experimental condition. Participants were randomly assigned to one of the three experimental conditions: liters (n= 58), kWh (n= 56), and gallons (n= 57). We asked participants to jointly evaluate the consumption of each car on a scale from 1 = “very efficient” to 100 = “very inefficient”. Before starting the evaluation of the ten pairs of cars, participants were provided with information about the linear transformations between non-default units and the default unit (i.e., in the kWh condition: 8.5 kWh = 1 liter fuel; in the gallon condition: 1 gallon = 3.8 liters fuel).
3.2 Results
We computed a linear mixed-effects model with consumption rating as the dependent variable. Unit (liter, kWh, gallon), level of consumption, and the interaction of unit and level of consumption were included as fixed effects into the analysis. The best fitting random effects structure included random intercepts for participants and cars and a random slope for level of consumption within participants (see Appendix B).
Results revealed decreased value sensitivity to consumption differences with both non-default units as compared to the default unit. As in Experiment 1, a main effect of level of consumption on consumption ratings indicated that cars with higher levels of consumption were rated as less efficient, b = 0.82, se = 0.06, t(21.47) = 13.76, p < .001. More importantly, as shown in Figure 3, we replicated the interaction effect of unit and level of consumption, F(2,168.02) = 4.16, p = .017. Specifically, the slope representing the effect of level of consumption on consumption ratings was steeper in the liter condition than in the kWh condition, bdif = 0.18, se = 0.07, t(168.0) = 2.64, p = .009, and the gallon condition, bdif = 0.16, se = 0.07, t(168.0) = 2.31, p = .022. However, there was no difference between the two non-default units in value sensitivity (bdif = 0.024 , se = 0.07, t(168.0) = .034, p = .734).
3.3 Discussion
Experiment 2 provided additional support for Hypothesis 1, which states that default units increase value sensitivity in contrast to a non-default unit, independent of whether the non-default unit is numerically larger (kWh) or smaller (gallons). Thus, we were able to rule out the easier processing of smaller numbers as an alternative explanation for a higher value sensitivity of the default unit (Harvey et al., 2013). By demonstrating a similarly reduced sensitivity to consumption differences in the kWh and the gallon condition, we confirmed that the default unit effect predominates in producing high value sensitivity in the joint evaluation mode. Moreover, the default unit effect was robust to participants being provided with the linear transformations between the non-default and the default unit. From a rational agent perspective, the transformations should have enabled participants to convert the non-default units into the default unit, thereby eliminating differences in value sensitivity. However, in line with boundedly rational information processing (Kahneman et al., 1982), differences in value sensitivity persisted.
4 Experiment 3
In order to investigate how evaluation mode influences judgments based on default and non-default units, we created a cross-unit evaluation condition in which the consumption of a high efficiency car was presented in a non-default unit (i.e., kWh) and the consumption of a low efficiency car was presented in the default unit (i.e., liters). We expected the lack of comparability and the missing reference information in evaluations across different units to impair comparative processing (Kardes, 2013; Schley et al., 2017).
We tested Hypothesis 2, which states that high efficiency cars should be evaluated less favorably when presented in a non-default unit (kWh) in cross-unit evaluation mode and more favorably in joint evaluation mode. That is, because the low evaluability of a non-default unit should result in regressive judgments that limit positive evaluations when no useful reference information is available (Hsee & Zhang, 2010). Conversely, low efficiency cars presented in the default unit (liters) should be evaluated more favorably in cross-unit evaluation mode than in joint evaluation mode, in line with the notion of a better accessibility of meta-cognitive feelings of fluency as a decision-criterion when the salience of the default unit is high (Lembregts & Pandelaere, 2013).
We also tested Hypothesis 3, which states that willingness to pay (WTP) for the efficiency advantages of high efficiency cars should be lower in cross-unit than in joint evaluation mode, as we could expect from differences in evaluations (i.e. Hypothesis 2). Moreover, the experimental design allowed to explore how different levels of the proportional sizes of the efficiency advantage of the high efficiency car interact with the nature of the unit. Previous research has observed that a unit effect is absent for very small relative quality advantages and gradually increases with the size of the proportional advantage (Pandelaere et al., 2011). Since our evaluability account predicted a well-calibrated, linear valuation of the size of an efficiency advantage described in a default unit, we did not expect that proportional advantage size moderates the sensitivity-increasing effect of a default unit in the present experiment.
4.1 Method
4.1.1 Participants
We recruited a sample of 223 German car drivers via a market research institute. Thirty-five participants were excluded because they failed an attention check1, leaving a final sample of 188 participants (95 women; Mage = 47.3, SDage = 15.0). Sample size was determined based on an a priori target of 60 participants per condition, matching the sample size from Experiment 2. All participants reported that they possessed a driver’s license. The completion of the experiment took approximately 10 minutes for which participants were given 2€ compensation.
4.1.2 Design and evaluation task
Participants were randomly assigned to either the liter (n = 65), the kWh (n = 63), or the cross-unit condition (n = 60). In the liter and the kWh conditions, consumption of both cars in each evaluation task were presented uniformly in liters per 100 km or kWh per 100 km, reflecting the joint evaluation mode. In the cross-unit condition, the consumption of the high efficiency car was presented in the non-default unit (i.e., kWh per 100 km) while the consumption of the low efficiency car was presented in the default unit (i.e., liters per 100 km).
We adapted the paradigm from Experiment 1 and 2 so that in each evaluation task the level of consumption of one car was in the range of an electric vehicle (i.e., high efficiency), while the other was in the range of a conventional combustion engine car (i.e., low efficiency). The high efficiency car consumed between 1.2 and 2.8 liters (10.2–22.8 kWh) per 100 km and the low efficiency car consumed between 3.0 and 11.8 liters (25.5–100.3 kWh) per 100 km. In each trial, levels of consumption of the two cars were randomly drawn to create a consumption difference between the two cars that was either very low (1.8 liters), low (3.6 liters), medium (5.4 liters), high (7.2 liters) or very high (9.0 liters), although these qualitative categories were not pre-tested. No level of consumption was presented repeatedly and the position of the high efficiency car on the screen was counterbalanced. Furthermore, in order to rule out that findings from Experiment 1 and 2 were driven by preferences towards the depicted cars, brands, or technologies, we used neutral shape stimuli labelled with “Car A” and “Car B” in Experiment 3 (see Figure 4). We held the number of trials (n = 10) and the range of consumption of the low efficiency cars (3.0–11.8 liters per 100 km) constant to Experiment 1 and 2, thus allowing us to maintain comparability with the results from Experiment 1 and 2 for the evaluations of the low efficiency cars.
4.1.3 Willingness to pay measure
In addition to the consumption ratings, participants reported their WTP for the efficiency advantage of the high efficiency car over the low efficiency car in each trial. Specifically, participants were asked to imagine themselves in the situation of buying a new car and Car A and Car B represented two models of the identical car, only differing in their levels of consumption. In each trial, participants then indicated in an open answer format the maximum price they would be willing to pay for the high efficiency car, provided that the low efficiency car cost € 20.000.
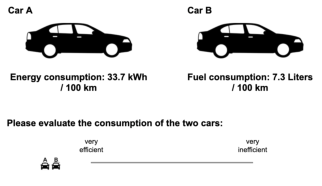
| Figure 4: The evaluation task in the cross-unit condition. In this condition, consumption of the high efficiency car was presented in the non-default unit, kWh, and the consumption of the low efficiency car was presented in the default unit, liters. Participants evaluated the consumption of cars by placing the respective miniature car icons on the scale from “very efficient” (1) to “very inefficient“ (100). |
4.2 Results
4.2.1 Consumption ratings
To maintain the linearity of our data and to compare the effect of units between the joint and the cross-unit evaluation mode, we divided our data into the consumption ratings of the high and the low efficiency cars for the computation of two linear mixed-effects models. For both analyses, we included unit (liter, kWh, cross-unit), level of consumption and the interaction of unit and level of consumption as fixed effects into the analysis. All continuous variables were z-standardized. For both analyses, the random effect structure was best represented by a model with a random intercept for participants and a random slope for level of consumption within participants (for global model fit indices see Appendices C and D).
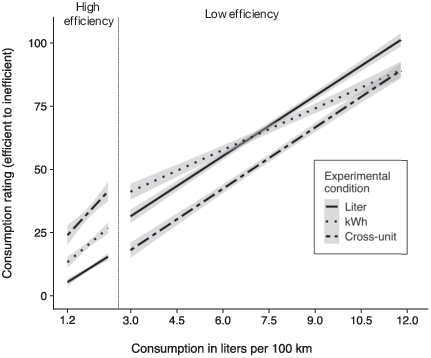
| Figure 5: Consumption ratings as a function of level of consumption and unit. In cross-unit evaluations high efficiency cars (described in kWh) were evaluated worse and low efficiency cars (described in liters) were evaluated better. In evaluations based on only the default unit liters per 100 km this effect reversed. Analyses were computed separately for high and low efficiency cars to maintain linearity. Regression lines are depicted with 95% confidence intervals. |
High efficiency cars:
High efficiency cars described with the non-default unit, kWh, were evaluated less favorably in the cross-unit evaluation mode than in the joint evaluation mode (see left side of Figure 5). This was supported by a main effect of unit, indicating that in the cross-unit condition, high efficiency cars were evaluated less favorably than in the kWh condition, b = −0.58, se = 0.14, t(184.97) = −4.23, p < .001, or the liter condition, b = −1.02, se = 0.14, t(184.97) = −7.50, p < .001. In line with increased value sensitivity due to higher evaluability, in the joint evaluation mode, high efficiency cars were evaluated more favorably in the liter condition (i.e. a fuel-equivalence measure) than in the kWh condition, b = 0.44, se = 0.14, t(184.97) = −3.28, p = .001.
Low efficiency cars:
Low efficiency cars described with the default unit, liters, were evaluated more favorably in the cross-unit evaluation mode than in the joint evaluation mode (see the right side of Figure 5). This was supported by a main effect of unit indicating that in the cross-unit condition low efficiency cars were evaluated more favorably than in the liter condition, b = −0.47, se = 0.09, t(188.0) = −5.30, p < .001 or the kWh condition, b = −0.43, se = 0.09, t(188.0) = −4.84, p < .001. As in Experiments 1 and 2, there was no main effect difference between joint evaluation in the kWh and the liter condition, b = −0.04, se = 0.09, t(188.0) = −0.43, p = .67.
However, replicating results from Experiment 1 and 2, value sensitivity was higher when consumption of the low efficiency car was presented in liters as compared to kWh in the joint evaluation mode (see differences in slopes on the right side of Figure 5). This effect was supported by a significant interaction of unit and level of consumption, F(2, 187.2) = 15.66, p < .001. The slopes representing the effect of level of consumption on consumption ratings in the liter condition (b = 0.75, se = 0.03) and the cross-unit condition (b = 0.77, se = 0.04) were steeper than the slope in the kWh condition, bdif = −0.23, se = 0.05, t(187.8) = −4.7, p < .001, and bdif = −0.25, se = 0.05, t(187.7) = −4.98, p < .001, respectively. The slopes between the liter and the cross-unit condition did not differ, bdif = 0.02, se = 0.05, t(186.1) = 0.37, p = .71. The main effect of level of consumption was significant, b = 0.75, se = 0.03, t(186.2) = 21.74, p < .001.
In summary, while the cross-unit evaluation mode led to more favorable judgments of low efficiency cars described in the default unit, it led to less favorable judgments of high efficiency cars described in a non-default unit when compared to joint evaluations in the liter and kWh condition. Within the joint evaluation mode, in line with the previous results, judgments were more sensitive to the efficiency of cars when described in the default unit as compared to the non-default unit.2
4.2.2 Willingness to pay
We computed a linear mixed-effects model with efficiency advantage, unit and the interaction of both factors as fixed effects and WTP as dependent variable. To avoid the exclusion of and the statistical distortion due to outliers, we transformed WTP data into ranks before the analysis. All continuous variables were z-standardized. A random effects structure with random intercepts for participants and random slopes for efficiency advantage within participants best represented the data (see Appendix F).
Participants reported lower WTP for efficiency advantages of high efficiency cars in the cross-unit evaluation mode than in the joint evaluation mode (i.e., liter and kWh condition; Figure 6). Specifically, WTP for efficiency advantages was lower in the cross-unit condition than in the liter condition, b = 0.36, se = 0.16, t(188.0) = 2.27, p = .024 or the kWh condition, b = 0.31, se = 0.16, t(188.0) = 1.95, p = .053. There was no difference between the liter and the kWh condition, b = 0.05, se = 0.16, t(188.0) = 0.31, p = .75. Moreover, in the cross-unit condition participants were less sensitive to changes in energy efficiency advantages as compared to the liter or the kWh condition. This was supported by a significant interaction between unit and efficiency advantage, F(2,187.7) = 3.71, p = .026. The slope representing the effect of efficiency advantage on WTP was less steep in the cross-unit condition, (b = 0.08, se = 0.03) than in the liter or the kWh condition, bdif = 0.10, se = 0.04, t(188.1) = 2.67, p = .008 and bdif = 0.07, se = 0.04, t(187.7) = 1.81, p = .072, respectively. No difference in sensitivity was observed between the liter and the kWh conditions, bdif = 0.03, se = 0.04, t(187.3) = 0.87, p = .39.
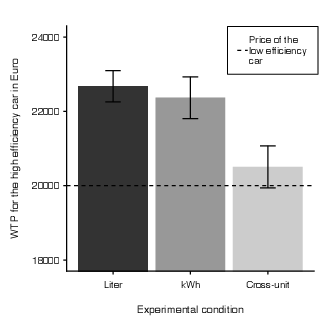
| Figure 6: Participant’s willingness to pay (WTP) for the high efficiency car by unit. WTP was higher when consumption was presented uniformly (liters, kWh) than when only the high efficiency car was presented in the non-default unit kWh (cross-unit condition). Mean WTP with error bars displaying 95% confidence intervals, n = 4 data points with WTP > € 100.000 were omitted for illustrative purposes. The raw WTP data displayed here was transformed into ranks for the statistical analysis. |
4.3 Discussion
Experiment 3 was designed to test Hypothesis 2 and 3 by investigating the influence of default units on consumer judgments in joint vs. cross-unit evaluation modes.
In line with Hypothesis 2, we found high efficiency cars described with a non-default unit to be evaluated less favorably in the cross-unit evaluation mode than in the joint evaluation mode. When neither knowledge nor evaluation mode provided useful reference information to evaluate a given value of a non-default unit, evaluations can be expected to be regressive judgments (Hsee et al., 1999). In the present case, this led to relatively unfavorable evaluations of high efficiency cars.
In line with an account of higher processing fluency of the default unit (Lembregts & Pandelaere, 2013), we found that in the cross-unit evaluation mode, judgments of low efficiency products described with the default unit were more favorable than in the joint evaluation mode. Unlike previous research, these results cannot be explained by higher value sensitivity of the default unit (Hsee & Zhang, 2010). We thereby provide complementary evidence for increased preferences for products described with a default unit due to the higher processing fluency of default units (Lembregts & Pandelaere, 2013).

| Figure 7: Aggregate effect-size of the random-effects meta-analysis of the reduction in value sensitivity due to the use of non-default units vs. the default unit across Experiment 1, 2, and 3. Note that both coefficients from Experiment 2 result from a comparison with the same control group (liter condition). |
Providing support for Hypothesis 3, the differences in evaluations of default and non-default units in the cross-unit vs. joint evaluation modes, moreover, translated into differences in WTP for efficiency advantages. Specifically, more favorable evaluations of cars described with the default unit and less favorable evaluations of cars described with the non-default unit translated into lower WTP for the high efficiency car in the cross-unit evaluation mode as compared to the joint evaluation mode. This has important implications for the design of car energy labels, which in their current form require cross-unit evaluations by presenting consumption of alternative technologies in non-default units. From a practical standpoint, this result is highly relevant since the price premium for energy efficient products is often discussed as a major barrier to their adoption (e.g., electric vehicles; Biresselioglu et al., 2018).
Furthermore, unlike previous research (Study 5 in Pandelaere et al., 2011), we did not find that sensitivity in WTP ratings varied between default and non-default units as a function of the proportional size of the efficiency advantage. Whereas larger proportional differences seem to magnify a unit effect between two non-default units, this does not seem to be the case for the default unit effect found here. Overall, the results from Experiment 3 illustrate that evaluation mode and the use of default units (vs. non-default units) can have important implications for consumer perception of, and preference for, green product efficiency.
5 Experiment 1–3 meta-analysis
In order to obtain an overall estimate of the increase in value sensitivity due to default units in the joint evaluation mode, we computed a meta-analysis across the interaction effects found for unit (default vs. non-default unit) and level of consumption across Experiment 1, 2, and 3, while not omitting any unreported data. We used the Metafor package for R (Viechtbauer, 2010) to compute a random-effects model on the four interaction coefficients reflecting value sensitivity to consumption differences obtained in our experiments (Figure 7). The overall effect size was significant, b = −0.20, se = 0.03, z = −7.01, p < .001, 95% CI [−0.25, −0.14], indicating a reduction in value sensitivity when a non-default unit was used. Considering that the effect of level of consumption on participants’ evaluations based on the default unit, liter, was about b = .80 across all experiments, the aggregated effect size reflects a reduction in value sensitivity of about 25% when a non-default unit is used. Due to the standardization of all continuous variables, the aggregate effect size can also be interpreted as a change of the strength of the relationship between level of consumption and evaluations, from an equivalent of about rPearson = .80 in the default unit condition to about rPearson = .60 in the non-default unit conditions.
6 General discussion
In their product choices, consumers often need to navigate a jungle of numerical product information, which typically requires evaluations of more or less familiar units as well as evaluations across different units. When comparing values presented in the same unit, the use of default units can help consumers to be more sensitive to differences and to make well-informed decisions. In cross-unit evaluations, comparative processing is inhibited (Kardes, 2013), and this can have important consequences for consumer evaluations. Across three experiments, we demonstrated that in joint as well as in cross-unit evaluation mode, the use of a default unit leads to more favorable evaluations of high efficiency cars and to less favorable evaluations of low efficiency cars. In Experiment 1 and 2 we investigated how European consumers evaluate the fuel consumption of cars depending on presentation in the default unit (liters per 100 km) versus two non-default units (kWh and gallons per 100 km) in joint evaluation mode. In line with evaluability theory (Hsee, 1996b; Hsee & Zhang, 2010), we found that consumers were more sensitive to differences in fuel consumption presented in the default unit than in the non-default units. In contrast to predictions based on the unit effect (Bagchi & Davis, 2016; Pelham et al., 1994), higher numerosity of the non-default unit did not lead to increased value sensitivity. Additionally, we ruled out the easier processing of smaller numbers (Harvey et al., 2013) as a potential alternative explanation of the higher value sensitivity observed for default units. Moreover, in accordance with boundedly rational information processing (Kahneman et al., 1982), the provision of the linear transformations between the non-default units and the default unit in Experiment 2 did not change the results.
In Experiment 3 we investigated the effect of a cross-unit evaluation mode, in which joint evaluation was required across different units by simultaneously evaluating a high efficiency car consuming kWh (a non-default unit) and a low efficiency car consuming liters (the default unit). In line with evaluability theory, we found less favorable evaluations of high efficiency cars in the cross-unit evaluation mode than in the joint evaluation mode, which we attribute to the low evaluability of the non-default unit in the former mode. For the default unit, however, cross-unit evaluations were more favorable than joint evaluations, which is in line with an account of increased preferences due to higher processing fluency of the default unit (Lembregts & Pandelaere, 2013). Importantly, differences in evaluations translated into lower WTP for efficiency advantages of the high efficiency car in cross-unit as compared to joint evaluations.
6.1 Theoretical implications
Our results contribute to the understanding of the influence of unit numerosity, default units, and evaluation mode on the perception of numerical information in judgment and decision making (Hsee, 1996b; Hsee & Zhang, 2010; Lembregts & Pandelaere, 2013; Pelham et al., 1994; Schley et al., 2017). To our knowledge, our work is the first to investigate how the evaluability of units (default vs. non-default units) and consumer’s value sensitivity (Hsee & Zhang, 2010) may account for findings of a unit effect in joint evaluation (e.g., Schley et al., 2017) and to some extent for increased preferences for products described with a default unit in joint and separate evaluation modes (Lembregts & Pandelaere, 2013).
Our research addressed the question of when and how the use of default units may dominate the effect of numerosity in increasing the perception of attribute differences. Our results support the idea that the use of a highly evaluable default unit dominates the effect of symbolic numerosity (Lembregts & Van Den Bergh, 2018). In our experiments, the presence of a default unit, but not the numerical magnitude of a unit, determined if value sensitivity was high – numerically larger as well as numerically smaller non-default units both led to lower value sensitivity. This finding is in contrast to research that found a unit effect in joint evaluation (Burson et al., 2009; Pandelaere et al., 2011). We argue that this discrepancy may be due to a disregard of the evaluability of units as a potential confound of numerosity in previous research ( Cadario, R., Parguel, B. & Benoît-Moreau, F., 2016; Schley et al., 2017). Evidence of a unit effect has usually been found in one-shot decisions where judgments based on low evaluability non-default units (independent of numerical size) may be polarized by the inferiority or the superiority of the alternative option. By using a diverse set of stimuli and by computing an aggregated measure of evaluations across multiple trials in the present work, we circumvented effects of one-shot joint evaluations of non-default units. Our findings add to the boundary conditions identified for the unit effect (Bagchi & Davis, 2012, 2016; Monga & Bagchi, 2012).
Moreover, our results provide support for a preference-increasing effect of default units in cross-unit evaluation. Previous research has suggested more favorable evaluations of default units due to higher processing fluency (Lembregts & Pandelaere, 2013). However, in previous work, the effect has only been demonstrated when comparing evaluations of default and non-default units in separate evaluation. Due to lower evaluability, the evaluations of non-default units can generally be expected to be more regressive, and therefore potentially less favorable than those based on default units (Hsee, 1996b; Hsee & Zhang, 2010). Here, we show that products described with the very same default unit receive more favorable evaluations in cross-unit evaluations than in joint evaluations. This is in line with higher processing fluency leading to more favorable judgments based on the default unit when its salience is high (Monga & Bagchi, 2012; Schley et al., 2017; Wyer, 2011).
6.2 Policy implications
Policy makers have introduced product labels in many domains to help consumers make more informed decisions. In the light of ambitious sustainability goals, energy efficiency labels have been developed for consumers to take efficiency more strongly into account in purchases of housing, household appliances, cars, and car equipment. Given the low adoption rates of more sustainable cars such as electric vehicles in most countries (IEA, 2018), it seems that current car energy labels are not sufficiently effective in promoting more sustainable consumer choices.
We argue that this may be due to the fact that the fuel consumption of alternative car technologies is often communicated in non-default units (e.g., kWh), while the consumption of less efficient, conventional cars is communicated in the default unit (i.e., liters). Based on the results of the present research, we strongly recommend the use of a fuel equivalence measure to communicate the consumption of alternative car technologies on energy labels to enhance well-informed consumer decision making. A fuel equivalence measure allows for a direct comparison between conventional fuel cars and alternative technologies such as electric cars and thus bypasses the potentially distorting effects of non-default units and cross-unit evaluations demonstrated in the present research.
The relevance of our findings also expands to other domains and contexts in
which consumers are confronted with default and non-default units (for an
overview of default units in different contexts see Lembregts &
Pandelaere, 2013). For example, scientists and policy makers have been
creative in creating novel units to reveal numerical information to the
consumers, like lifetime running costs (Camilleri & Larrick, 2014), light
bulb hour equivalences (Camilleri, Larrick, Hossain & Patino-Echeverri,
2019), or the time a tree takes to bind a certain amount of emitted
CO2 (DB, 2019). However, the evaluability of these innovative
units should be assessed more frequently. Based on our results, in a
context where a default unit exists, the introduction of a novel unit
should be carefully considered, because it risks obscuring the information
that a policy maker tries to reveal. In a context where no default unit
exists, as for CO2 emissions, policy makers should rely on other means of increasing value sensitivity (Lembregts & Van Den Bergh; Hsee et al., 2010) until a default unit is established.
On a cautionary note, the potential change of default units over time should be kept in mind when designing policy measures such as labels. This is of special relevance in rapidly developing domains like IT, where today’s default unit for measuring storage capacity is still gigabytes, while tomorrow it might already be terabytes (Lembregts & Pandelaere, 2013).
6.3 Limitations and Future Directions
We demonstrated that a default unit led to increased value sensitivity in product evaluations whereas higher numerical magnitude of a unit did not. However, the range of numerical differences between units in our experiments was limited. The largest difference in numerosity between units presented here was 1:32 (gallons vs. kWh, Experiment 2). Therefore, a unit effect may still appear with larger differences in numerosity between two non-default units (Burson et al., 2009). Speaking against this assumption, previous research has shown that numerical expansions that deviate too strongly from the default unit are likely to eliminate or even reverse the unit effect (Aribarg et al., 2017; Camilleri & Larrick, 2014). It is an exciting avenue for future research to more systematically investigate the sweet spot where the numerical expansion of a non-default unit leads to the highest degree of value sensitivity and how this value sensitivity compares to the one obtained with the default unit in a given context.
We acknowledge that Experiment 3 did not apply a complete experimental design. In the cross-unit evaluation mode, cars presented with the non-default unit were always high in efficiency while cars presented in the default unit were always low in efficiency. A complete experimental design would have included a condition where the high efficiency cars were presented with the default unit and the low efficiency cars with a non-default unit. However, this condition would not have been very interesting from an applied perspective, as in practice the more established (and less efficient) technologies are almost by definition described with default units. In line with predictions based on processing fluency (Lembregts & Pandelaere, 2013), we would however expect that cross-unit evaluations of high efficiency cars presented in the default unit would produce even more favorable evaluations than in joint evaluation. Cross-unit evaluation of low efficiency cars presented in a non-default unit should also lead to more favorable evaluations, as the low evaluability of a non-default unit obscures the low efficiency and thereby leads to more regressive judgments (Hsee & Zhang, 2010). More interestingly, the described condition would allow to investigate to what extent accentuation effects between the categories of different units might have contributed to the results in the cross-unit condition (Tajfel & Wilkes, 1963).
Moreover, we did not investigate to what extent the value sensitivity-increasing advantage of default units outweighs other potential biases related to a default unit. For example, some default units inherently bias consumer perception due to the non-linear nature of efficiency or productivity units (vs. consumption units; Herberz, Kacperski & Kutzner, 2019; Larrick & Soll, 2008; De Langhe & Puntoni, 2016). In such cases, it remains an open question if the evaluative disadvantage of introducing a new, less familiar unit (e.g., GPM instead of MPG), might outweigh the disadvantages produced by the use of the bias-inducing default unit. It is conceivable that during an initial period the disadvantages of the new but unbiased unit will dominate, but as consumers will become familiar with the new unit the associated drawbacks might disappear.
Finally, we did not investigate individual differences that could provide insights into how default units and personal relevance of a unit could influence the evaluations of numerical information. Previous research has shown that translations of attributes can act as decision signposts, depending for example on consumer values (Mertens, Hahnel & Brosch, 2019; Ungemach et al., 2018). Consumers with high environmental values were more sensitive to differences when numerical attributes were presented in a unit related to environmental consequences, like a CO2 rating. Future research investigating the role of default units in consumer evaluations should include measures of individual differences, such as values or attitudes, in order to gain deeper insights into how personal relevance and familiarity might interplay in producing high value sensitivity.
References
Aribarg, A., Burson, K. A., & Larrick, R. P. (2017). Tipping the Scale: The Role of Discriminability in Conjoint Analysis.
Journal of Marketing Research, 54(2), 279–292.
https://doi.org/10.1509/jmr.14.0659.
Attari, S. Z., DeKay, M. L., Davidson, C. I., & Bruine de Bruin, W. (2010). Public perceptions of energy consumption and savings. Proceedings of the National Academy of Sciences, 107(37), 16054–16059. https://doi.org/10.1073/pnas.1001509107.
Bagchi, R., & Davis, D. F. (2012). $29 for 70 Items or 70 Items for $29? How Presentation Order Affects Package Perceptions. Journal of Consumer Research, 39(1), 62–73. https://doi.org/10.1086/661893.
Bagchi, R., & Davis, D. F. (2016). The role of numerosity in judgments and decision-making. Current Opinion in Psychology, 10, 89–93. https://doi.org/10.1016/j.copsyc.2015.12.010.
Barr, D. J., Levy, R., Scheepers, C., & Tily, H. J. (2013). Random effects structure for confirmatory hypothesis testing: Keep it maximal. Journal of Memory and Language, 68(3), 255–278. https://doi.org/10.1016/j.jml.2012.11.001.
Bazerman, M. H., Loewenstein, G. F., & White, S. B. (1992). Reversals of Preference in Allocation Decisions: Judging an Alternative Versus Choosing Among Alternatives. Administrative Science Quarterly, 37(2), 220. https://doi.org/10.2307/2393222.
Bohnet, I., van Geen, A., & Bazerman, M. (2016). When performance trumps gender bias: Joint vs. Separate evaluation. Management Science, 62(5), 1225–1234. https://doi.org/10.1287/mnsc.2015.2186.
Burson, K. A., Larrick, R. P., & Lynch Jr, J. G. (2009). Six of one, half dozen of the other: Expanding and contracting numerical dimensions produces preference reversals. Psychological Science, 20(9), 1074–1078. https://doi.org/10.1111/j.1467-9280.2009.02394.x.
Cadario, R., Parguel, B., & Benoît-Moreau, F. (2016). Is bigger always better? The unit effect in carbon emissions information. International Journal of Research in Marketing, 33(1), 204–207. https://doi.org/10.1016/j.ijresmar.2015.10.002.
Camilleri, A. R., & Larrick, R. P. (2014). Metric and scale design as choice architecture tools. Journal of Public Policy & Marketing, 33(1), 108–125. https://doi.org/10.1509/jppm.12.151.
Camilleri, A. R., Larrick, R. P., Hossain, S., & Patino-Echeverri, D. (2019). Consumers underestimate the emissions associated with food but are aided by labels. Nature Climate Change, 9(1), 53–58. https://doi.org/10.1038/s41558-018-0354-z.
Chin, A., & Bruine de Bruin, W. (2019). Helping consumers to evaluate annual percentage rates (APR) on credit cards. Journal of Experimental Psychology: Applied, 25(1), 77–87. https://doi.org/10.1037/xap0000197.
Coupland, N. (2011). How frequent are numbers? Language & Communication, 31(1), 27–37. https://doi.org/10.1016/j.langcom.2010.09.001.
Fitzmaurice, G. M., Laird, N. M., & Ware, J. H. (2004). Applied longitudinal analysis (Vol. 998). John Wiley & Sons.
Gigerenzer, G., & Todd, P. M. (1999). Simple heuristics that make us smart. Oxford University Press.
González-Vallejo, C., & Moran, E. (2001). The Evaluability Hypothesis Revisited: Joint and Separate Evaluation Preference Reversal as a Function of Attribute Importance. Organizational Behavior and Human Decision Processes, 86(2), 216–233. https://doi.org/10.1006/obhd.2001.2953.
Harvey, B. M., Klein, B. P., Petridou, N., & Dumoulin, S. O. (2013). Topographic Representation of Numerosity in the Human Parietal Cortex. Science, 341(6150), 1123–1126. https://doi.org/10.1126/science.1239052.
Herberz, M., Kacperski, C., & Kutzner, F. (2019). Reducing the time loss bias: Two ways to improved driving safety and energy efficiency. Accident Analysis & Prevention, 131, 8–14. https://doi.org/10.1016/j.aap.2019.06.007.
Hsee, C. K. (1996a). Elastic Justification: How Unjustifiable Factors Influence Judgments. Organizational Behavior and Human Decision Processes, 66(1), 122–129. https://doi.org/10.1006/obhd.1996.0043.
Hsee, C. K. (1996b). The Evaluability Hypothesis: An Explanation for Preference Reversals between Joint and Separate Evaluations of Alternatives. Organizational Behavior and Human Decision Processes, 67(3), 247–257. https://doi.org/10.1006/obhd.1996.0077.
Hsee, C. K. (1998). Less is better: When low-value options are valued more highly than high-value options. Journal of Behavioral Decision Making, 11(2), 107–121. https://doi.org/10.1002/(SICI)1099-0771(199806)11:2<107::AID-BDM292>3.0.CO;2-Y.
Hsee, C. K. (2006). Attribute Evaluability and its Implications for Joint-Separate Evaluation Reversals and Beyond. In D. Kahneman & A. Tversky (Eds.), Choices, Values and Frames. Cambridge University Press.
Hsee, C. K., Blount, S., Loewenstein, G. F., & Bazerman, M. H. (1999). Preference Reversals Between Joint and Separate Evaluations of Options: A Review and Theoretical Analysis. Psychological Bulletin, 125(5), 576–590. https://doi.org/10.1037/0033-2909.125.5.576.
Hsee, C. K., & Rottenstreich, Y. (2004). Music, Pandas, and Muggers: On the Affective Psychology of Value. Preference Reversals Between Joint and Separate Evaluations of Options: A Review and Theoretical Analysis. Journal of Experimental Psychology: General, 133(1), 23. https://doi.org/10.1037/0096-3445.133.1.23.
Hsee, C. K., Rottenstreich, Y., & Xiao, Z. (2005). When Is More Better?: On the Relationship Between Magnitude and Subjective Value. Current Directions in Psychological Science, 14(5), 234–237. https://doi.org/10.1111/j.0963-7214.2005.00371.x.
Hsee, C. K., Yu, F., Zhang, J., & Zhang, Y. (2003). Medium Maximization. Journal of Consumer Research, 30(1), 1–14. https://doi.org/10.1086/374702.
Hsee, C. K., & Zhang, J. (2010). General Evaluability Theory. Perspectives on Psychological Science, 5(4), 343–355. https://doi.org/10.1177/1745691610374586.
IEA. (2018). Electric vehicles. International Energy Agency. Retrieved October 9, 2020, from International Energy Agency website: https://www.iea.org/reports/electric-vehicles.
Kahneman, D., Slovic, P., Tversky, A., & Press, C. U. (1982). Judgment under uncertainty: Heuristics and biases. Cambridge University Press.
Kardes, F. R. (2013). Selective versus comparative processing. Journal of Consumer Psychology, 23(1), 150–153. https://doi.org/10.1016/j.jcps.2012.10.003.
Larrick, R. P., & Soll, J. B. (2008). The MPG illusion. Science, 320(5883), 1593–1594. https://doi.org/10.1126/science.1154983.
Lembregts, C., & Pandelaere, M. (2013). Are All Units Created Equal? The Effect of Default Units on Product Evaluations. Journal of Consumer Research, 39(6), 1275–1289. https://doi.org/10.1086/668533.
Lembregts, C., & Van Den Bergh, B. (2018). Making Each Unit Count: The Role of Discretizing Units in Quantity Expressions. Journal of Consumer Research, 45(5), 1051–1067. https://doi.org/10.1093/jcr/ucy036.
Marghetis, T., Attari, S. Z., & Landy, D. (2019). Simple interventions can correct misperceptions of home energy use. Nature Energy, 4(10), 874–881. https://doi.org/10.1038/s41560-019-0467-2.
Mertens, S., Hahnel, U. J. J., & Brosch, T. (2019). This way, please: Uncovering the directional effects of attribute translations on decision making. Judgment and Decision Making, 15(1), 25-46.
Monga, A., & Bagchi, R. (2012). Years, Months, and Days versus 1, 12, and 365: The Influence of Units versus Numbers. Journal of Consumer Research, 39(1), 185–198. https://doi.org/10.1086/662039.
Pandelaere, M., Briers, B., & Lembregts, C. (2011). How to make a 29% increase look bigger: The unit effect in option comparisons. Journal of Consumer Research, 38(2), 308–322. https://doi.org/10.1086/659000.
Pelham, B. W., Sumarta, T. T., & Myaskovsky, L. (1994). The easy path from many to much: The numerosity heuristic. Cognitive Psychology, 26(2), 103–133. https://doi.org/10.1006/cogp.1994.1004.
Schley, D. R., Lembregts, C., & Peters, E. (2017). The role of evaluation mode on the unit effect. Journal of Consumer Psychology, 27(2), 278–286. https://doi.org/10.1016/j.jcps.2016.07.001.
Tajfel, H., & Wilkes, A. L. (1963). Classification and quantitative judgement. British Journal of Psychology, 54(2), 101–114. https://doi.org/10.1111/j.2044-8295.1963.tb00865.x.
Tan, H., Lv, X., Liu, X., & Gursoy, D. (2018). Evaluation nudge: Effect of evaluation mode of online customer reviews on consumers’ preferences. Tourism Management, 65, 29–40. https://doi.org/10.1016/j.tourman.2017.09.011.
Trope, Y., Liberman, N., & Wakslak, C. (2007). Construal Levels and Psychological Distance: Effects on Representation, Prediction, Evaluation, and Behavior. Journal of Consumer Psychology, 17(2), 83–95. https://doi.org/10.1016/S1057-7408(07)70013-X.
Ungemach, C., Camilleri, A. R., Johnson, E. J., Larrick, R. P., & Weber, E. U. (2018). Translated attributes as choice architecture: Aligning objectives and choices through decision signposts. Management Science,64(5), 2445-2459. https://doi.org/10.1287/mnsc.2016.2703.
Viechtbauer, W. (2010). Conducting Meta-Analyses in R with the metafor Package. Journal of Statistical Software, 36(3). https://doi.org/10.18637/jss.v036.i03.
Wyer, R. S. (2011). Procedural influences on judgments and behavioral decisions. Journal of Consumer Psychology, 21(4), 424–438. https://doi.org/10.1016/j.jcps.2010.12.002.
Appendix
Appendix A. Linear mixed model random structure selection in Experiment 1.
Model | AIC | BIC |
Random intercept for id | 1529.75 | 1558.80 |
Random intercept for id + car | 1513.94 | 1547.83 |
Random intercept for id + car +
random slope for level of consumption | 1175.40 | 1218.97 |
| |
Appendix B. Linear mixed model random structure selection in Experiment 2.
Model | AIC | BIC |
Random intercept for id | 1510.81 | 1548.82 |
Random intercept for id + car | 1505.61 | 1548.37 |
Random intercept for id + car +
random slope for level of consumption | 1088.30 | 1140.56 |
| |
Appendix C. Linear mixed model random structure selection for the evaluations of high efficiency cars in Experiment 3.
Model | AIC | BIC |
Random intercept for id | 3228.08 | 3272.39 |
Random intercept for id + random slope for level of consumption | 3183.22 | 3238.61 |
| |
Appendix D. Linear mixed model random structure selection for the evaluations of low efficiency cars in Experiment 3.
Model | AIC | BIC |
Random intercept for id | 3319.25 | 3363.57 |
Random intercept for id + random slope for level of consumption | 3133.34 | 3188.73 |
| |
Appendix E
Participants were sensitive to consumption differences in the narrow range of high efficiency car consumption (1.2 liters / 100 km to 2.7 liters / 100 km), as qualified by a significant main effect of level of consumption, b = 0.16, se = 0.03, t(188.0) = 6.40, p < .001. Additionally, a significant interaction of level of consumption and unit, F(2,188.01) = 5.08, p = .001, indicated that participants were more sensitive to differences in consumption when consumption of the high efficiency car was presented in kWh alongside a low efficiency car consuming liters (cross-unit condition), than if consumption was uniformly presented in liters (liter condition), b = 0.11, se = 0.04, t(188.0) = 3.19, p = .002 (see left side of Figure 5. Differences in slopes between the cross-unit and the kWh condition and between the liter and the kWh condition were not significant, b = 0.06, se = 0.04, t(188.0) = 1.68, p = .10 and b = 0.05, se = 0.04, t(188.0) = 1.52, p = .13, respectively, indicating comparable value sensitivity.
Appendix F. Linear mixed model random structure selection for the willingness to pay for high efficiency car in Experiment 3.
Model | AIC | BIC |
Random intercept for id | 2908.67 | 2952.56 |
Random intercept for id + random slope for level of consumption | 2787.97 | 2842.84 |
This document was translated from LATEX by
HEVEA.