Judgment and Decision Making, Vol. 16, No. 1, January 2021, pp. 201-237
How preference change induced by mere action versus inaction persists over timeZhang Chena
Rob W. Hollandb
Julian Quandtc
Ap Dijksterhuis d
Harm Velinge
|
Abstract: Understanding how sustainable preference change can be achieved is of both scientific and practical importance. Recent work shows that merely responding or not responding to objects during go/no-go training can influence preferences for these objects right after the training, when people choose with a time limit. Here we examined whether and how such immediate preference change in fast choices can affect choices without time limit one week later. In two preregistered experiments, participants responded to go food items and withheld responses toward no-go food items during a go/no-go training. Immediately after the training, they made consumption choices for half of the items (with a time limit in Experiment 1; without time limit in Experiment 2). One week later, participants chose again (without time limit in both experiments). Half of the choices had been presented immediately after the training (repeated choices), while the other half had not (new choices). Participants preferred go over no-go items both immediately after the training and one week later. Furthermore, the effect was observed for both repeated and new choices after one week, revealing a direct effect of mere (non)responses on preferences one week later. Exploratory analyses revealed that the effect after one week is related to the memory of stimulus-response contingencies immediately after the training, and this memory is impaired by making choices. These findings show mere action versus inaction can directly induce preference change that lasts for at least one week, and memory of stimulus-response contingencies may play a crucial role in this effect.
Keywords: go/no-go training, preference, choice, memory, behavior change
1 Introduction
Preferences play an important role in various domains of behavior. We routinely need to express our preferences for objects by making choices, such as choosing which food items to eat. Previous research on reinforcement learning has made important contributions to understanding the formation and modification of preferences (Sutton & Barto, 1998). Studies in this domain have shown that responses that lead to positive outcomes become preferred, whereas ones that lead to negative outcomes are avoided (Thorndike, 1911). Although reinforcement learning plays a prominent role in shaping preferences (Daw & O’Doherty, 2013; Doya, 2008), some recent work suggests that responding or not responding to objects without external reinforcement may also lead to preference change (Chen et al., 2019; Salomon et al., 2018; Schonberg et al., 2014). Human behavior can be divided into two broad categories, namely the execution of behavioral responses and the absence of any response (Guitart-Masip et al., 2014). Understanding the influence of mere action versus inaction on preferences may thus provide important insight into how preferences are created and modified.
In the current research, we investigated the effect of mere action versus inaction on preferences in the context of computerized tasks, as opposed to other more naturalistic settings. Actions and inactions in naturalistic settings are often imbued with meanings and affective connotations (which may be considered as a form of reinforcement), making it unclear whether any observed preference change is due to action versus inaction per se, or these other factors. Computerized tasks allow us to manipulate simple (non)responses that are devoid of such connotations (e.g., pressing or not pressing a key on a keyboard), thereby isolating the influence of mere action versus inaction on preferences.
Different computerized paradigms have been used to manipulate simple (non)responses toward objects, such as the stop-signal training (SST; Lawrence, Verbruggen, Morrison, Adams & Chambers, 2015; Wessel, O’Doherty, Berkebile, Linderman & Aron, 2014), the cue-approach training (CAT; Schonberg et al., 2014) and the go/no-go training (GNG; Veling, Holland & van Knippenberg, 2008). Here, we focus on the GNG, as the go and no-go trials in the GNG are closely matched (e.g., unlike the SST or CAT, in GNG both go and no-go trials are cued by visual or auditory signals), except for whether participants respond or not. In GNG, participants are presented with items on a screen and consistently respond to go items (by pressing a key) and not to no-go items (by not pressing any key) depending on the respective presentation of a go or no-go cue. Any effects of GNG on preferences may therefore be attributed to mere action versus inaction (Veling, Lawrence, et al., 2017).
As a demonstration of the effect of mere action versus inaction on preferences, in a recent series of experiments (Chen et al., 2019), participants were trained to consistently respond to certain food items by pressing a key on a keyboard, and not respond to other food items in GNG. No reward or punishment was provided during the training, thus the (non)responses were not reinforced. After the training, participants made multiple binary choices between go and no-go food items for consumption, while the pre-training values of the go and no-go items were matched. The results consistently showed participants preferred go over no-go items when they made choices quickly, i.e. under a strict time limit of 1500 milliseconds (hereafter fast choices). Furthermore, this effect was still observed one week later, when participants received the same choice task (i.e., under a time limit) again. However, when given unlimited time for making choices immediately after the training, they did not show a preference for go items (hereafter slow choices).
Two theoretical accounts have been proposed to explain how GNG leads to preference change (Veling, Lawrence, et al., 2017). One account proposes that after GNG, the evaluations of no-go items decrease, while the evaluations of go items may increase (Chen et al., 2016). Participants therefore prefer go over no-go items in a choice task after GNG. Another account proposes that people may acquire stimulus-response associations from GNG. Go items may trigger a go response, while no-go items may trigger a no-go response (i.e., stopping) after GNG. When choosing between a go and a no-go item in a binary choice task, participants may more easily respond to the go item, resulting in more choices for go items. The current research does not seek to examine these two accounts in explaining how GNG changes preferences immediately after training. Rather,
one main research question of the current
paper concerns the nature of the delayed effect, namely the preferences for
go over no-go items observed one week after training. A second related
question is whether we could use GNG to change slow choices (which until
now seem impervious to the influence of GNG), by leveraging the reliable
effect of GNG on fast choices (Chen et al., 2019). Answering these two
questions will not only provide more theoretical insight into how GNG leads
to durable preference change in general, but will also provide knowledge on
how GNG can be used in applied settings for achieving sustainable behavior
change. As the interests in using GNG and other computerized paradigms as
behavioral change interventions grow (e.g., as an intervention to encourage
healthy eating, Walker et al., 2019), it is important to know whether
preference change induced by GNG is sustainable and can be generalized to
contexts where people have sufficient time for decision making. Below we
discuss these two research questions in more detail.
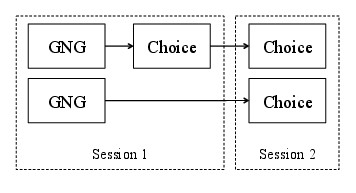
| Figure 1: Schema illustrating the basic design of the experiments. Half of the items from GNG were used in the choice task in both Session 1 and Session 2 (top), while the other half of the items from GNG were used only in the choice task in Session 2 (bottom). |
In the previous experiments that examined the delayed effect (Chen et al., 2019), participants received a choice task with the trained items immediately following training (Session 1); one week later, the same items were again presented in a choice task (Session 2). Since the same items were used in the choice task in both Session 1 and Session 2, the delayed effect observed in Session 2 can be explained by two processes. First, changes induced by GNG (i.e., the change in stimulus evaluation and/or the formation of stimulus-response associations; see above) may be maintained over time, and influence choices in Session 2 (hereafter the direct effect account). Alternatively, changes induced by GNG may have dissipated after one week. However, since participants chose go items in the choice task in Session 1, the value of go items may increase via the act of choosing (e.g., choice-induced preference change, Sharot et al., 2010, 2012) and influence choices in Session 2 (hereafter the indirect effect account, because GNG indirectly affects choices in Session 2 via its influence on choices in Session 1). In other words, the effect in Session 2 may be caused by GNG (the direct effect account) or by the choice task in Session 1 (the indirect effect account).
To disentangle these two accounts, we manipulated whether certain food items were presented in the choice task in Session 1 or not (see Figure 1). Participants received a go/no-go training with multiple food items. Immediately after the training, half of the items were used to create choice pairs in a choice task, while the remaining half were not included in the choice task (Session 1). One week later, participants received a choice task with all items (Session 2). Half of the choice pairs in Session 2 consisted of items that had already been presented in the choice task in Session 1 (i.e., repeated choices), while the other half consisted of items that were not included in the choice task in Session 1 (i.e., new choices). According to the direct effect account, preference change of similar magnitude would emerge for both the repeated and the new choices in Session 2. The indirect effect account, on the other hand, predicts preference change only for the repeated choices, but not for the new choices. It is possible that both processes may simultaneously influence the choices in Session 2. In that case, preference change would occur for both the repeated and the new choices, but will be more pronounced for the repeated choices in Session 2.
The second research question is whether we could use the effect of GNG on immediate fast choices to change subsequent slow choices. The idea for examining this question came from the observation that people preferred go over no-go items in a fast choice task immediately after GNG, but not when they received unlimited time for their decisions (Chen et al., 2019). Moreover, for those who received a fast choice task, their preference for go items decreased on trials with longer reaction times (Chen et al., 2019). These results raised the question of whether GNG can only change preferences when people choose quickly, and accordingly whether and how decisions without a time limit may be influenced by GNG. This is an important question. After all, as GNG is considered a potential intervention to change people’s food choices (Allom et al., 2016; Chen et al., 2019; Walker et al., 2019), it is useful to understand how both fast and slow choices maybe influenced. If the indirect effect account is true, this would suggest that when GNG is used as an intervention, it may be important to include an immediate fast choice task after the training to influence subsequent (slow) choices. The direct effect account, on the other hand, suggests that slow choices after a delay cannot be influenced by GNG, as the effect of GNG seems to be limited to fast choices till now.
Assuming that GNG may influence only fast choices directly, the ideal design to pit the direct and the indirect effect account would be to test the effect of GNG on fast choices, both immediately after GNG and after a delay. However, in Experiment 1 we opted to include a fast choice task immediately following GNG, and a slow choice task after a delay. This design allowed us to explore the possibility of using immediate fast choices to change delayed slow choices, which we deemed an important question, as explained above. However, this design was not a ‘fair’ test between the direct and the indirect effect account, as the direct influence of GNG may not manifest in delayed slow choices (as we originally expected GNG to only influence fast choices). To preview the results, in Experiment 1, participants preferred go items in a fast choice task immediately following GNG (replicating previous findings; Chen et al., 2019). They still preferred go items one week later, when they received a slow choice task. Surprisingly, this delayed effect was observed for both repeated and new choices. GNG thus directly influenced slow choices one week later, without the mediating influence of immediate (fast) choices. The direct effect account survived a ‘severe’ test and the evidence was in its favor. In Experiment 2, we revisited the assumption that GNG could influence only fast choices, by including a slow choice task both immediately after GNG and one week later. Unlike in our earlier work, we observed an effect of the training on immediate slow choices. Furthermore, the results from Experiment 1 were replicated. The training influenced both new and repeated choices one week later, once again providing support for the direct effect account. In light of these new findings, we revised our previous conclusion that GNG could influence only fast choices (Chen et al., 2019), and concluded instead that the effect of GNG may depend on the extent of learning (see below) and vary along a continuum of decision-making speed.
In both experiments, we measured participants’ memory of stimulus-response contingencies in both sessions with a memory recognition task, as an exploratory measure of how well participants had learned the contingencies from the training. Contingency memory has been related to the effect of GNG on stimulus evaluation, where participants with better contingency memory showed a larger effect of GNG on food evaluation (Chen et al., 2018). This effect may potentially be mediated by general attention or the level of involvement in the task. To explore whether contingency memory is related to the effect of GNG on preferences (i.e., choices), and the role of contingency memory in the delayed effect, we thus measured stimulus-response contingency memory after the choice task in both sessions.
To summarize, in the present research, participants were trained to consistently respond to certain food items and not respond to other items in GNG. Immediately after training, they received a choice task in which they chose between go and no-go items for consumption. One week later, the same items were again used in a food choice task (i.e., repeated choices), along with items that were not used in the choice task in Session 1 (but were used in GNG in Session 1; new choices). In Experiment 1 we used a fast choice task in Session 1 and a slow choice task in Session 2, while in Experiment 2 we used a slow choice task in both sessions. We assessed memory of stimulus-response contingencies in both sessions, to explore the role of contingency memory. Planned sample sizes, data analysis plans and hypotheses were all preregistered. The experimental materials, preregistrations, raw data, analysis scripts and supplemental materials can be found at https://osf.io/r8ya6.
2 Experiment 1
When conducting Experiment 1, we expected to obtain results in line with the indirect effect account, for two reasons. First, choice-induced preference change has been shown to be rather long-lasting (Sharot et al., 2012). It therefore seems plausible that such change induced by choices in Session 1 can be maintained over one week and influence choices in Session 2. Second, as mentioned above, the effect of GNG on preferences seemed to be confined to situations where people make choices quickly (Chen et al., 2019). It thus seemed unlikely that new slow choices in Session 2 would be influenced by GNG after one week. Taking these considerations into account, we predicted participants would choose go items more often in the fast choice task in Session 1. When the same choices were repeated one week later, they would still prefer go items, due to the immediate fast choices (i.e., the indirect effect). For the new choices in Session 2, we expected no effect, as these choices would be made without a time limit, and hence not susceptible to the direct influence of GNG.1
2.1 Method
2.1.1 Sample Size
A previous experiment with a similar setup showed the preference change
effect for repeated choices in Session 2 has an effect size of an odds
ratio (OR) of 1.18 (Experiments 5 and 6, Chen et al., 2019). For this
experiment, we planned to recruit 150 participants. With 150 participants
and an OR of 1.18 as the expected effect size, the experiment has around
84.7% power for detecting a statistically significant effect (with a
multilevel logistic regression as the planned analysis, formula: choice ∼ 1 + (1 | subject), and an alpha level of 0.05; power simulated in the simr package, Green & MacLeod, 2016). Note that we initially used a t-test in the power analysis, which is incorrect. See the Supplemental Materials for more detail on the power simulation. The Psychology Ethics Committee at Leiden University reviewed and approved the experiment.
2.1.2 Participants
One hundred and fifty-one participants (mostly undergraduate students at Leiden University) took part in the experiment.2 Three participants were excluded based on pre-specified exclusion criteria (accuracy on go or no-go trials 3SDs below sample mean and below 90%), leaving 148 participants for analysis in Session 1 (41 males, Mage = 23.0, SDage = 3.2). Four participants did not finish Session 2, leaving 144 participants for analysis in Session 2. With 144 participants, the achieved power (with an OR of 1.18 as the expected effect size and 0.05 as the alpha level) is around 84.0%.
2.1.3 Materials
Sixty pictures of different candies were selected from previous work (Chen et al., 2019) and used as stimuli. All candies were available in local supermarkets and candy stores, and hence familiar to our participants. In all pictures, the candies were placed on a white plate against a grey background, and covered approximately the same amount of area on the plate. The experiment was programmed in PsychoPy (Peirce, 2007). Participants received the experiment in individual cubicles.
2.1.4 Procedure
Preparation in Session 1.
Participants were asked to fast for 3 hours before the session started. Those who failed to adhere to this requirement as indicated by self-report (probed by the experimenter before starting the experiment) were asked to reschedule the experiment.
Evaluation task.
Participants first received an evaluation task, in which 60 pictures were presented one by one. For each picture, they indicated how much they wanted to eat the depicted candies at the moment by using a slider (−100 = Not at all; 100 = Very much; the numerical values were not displayed on the slider; see Figure 2 for the sequence of main tasks).
Ranking and Selection.
After getting the ratings of all pictures, the program ranked the pictures from the highest rating till the lowest for each participant. Thirty-two pictures (high value, ranked from 8 till 23; low value, ranked from 38 till 53) were selected and used in the following tasks. We then divided the 16 high-value pictures into two sets (8 pictures per set), with one set used only in the choice task in Session 2 (i.e., new choice condition), and the other set used in the choice tasks in both sessions (i.e., repeated choice condition; the conditions were thus within-subjects). Within each set, half of the items were assigned into the go condition, and the other half into the no-go condition in a counterbalanced manner, such that the average ratings of go and no-go items would be matched. The same division procedure was used for the 16 low-value pictures, resulting in 4 go items and 4 no-go items in the new choice condition, and 4 go items and 4 no-go items in the repeated choice condition. See Appendix for the item selection procedure.
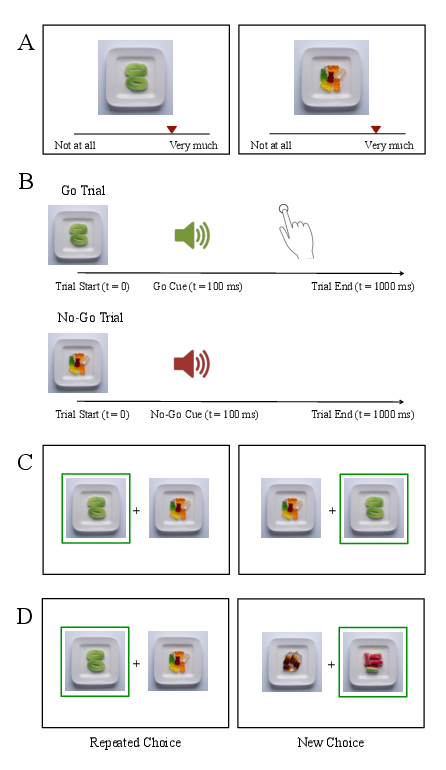
| Figure 2: The sequence of main experimental tasks. (A) Evaluation task; (B) The go/no-go training; (C) Choice task in Session 1 (immediate choice); (D) Choice task in Session 2 (delayed choice). |
Go/No-Go Training.
Participants then received the GNG. The 32 selected pictures were used in the training. Each picture was presented on screen for 1 second. One hundred milliseconds after picture onset, a tone (300ms, 1000 Hz vs. 400 Hz) was played via a headphone. If the played tone was a go cue, participants needed to press the B key on a keyboard as fast as possible; if it was a no-go cue, participants should not respond. The assignment of two different tones as go and no-go cue was counterbalanced across participants. The inter-trial interval randomly varied between 0.5 and 1.5 seconds, in steps of 0.1 second. Before the experimental blocks, participants received a practice block of 8 trials to get familiar with the task. Pictures used in the practice block were not used in the experimental blocks. During the practice block, performance feedback was provided after each trial (O in green after a correct response, and X in red after an incorrect response). The actual training consisted of 10 blocks, with each of the 32 pictures presented once in each block. Order of presentation was randomized within each block, and no performance feedback was provided after each trial. After every two blocks, the average accuracy in the preceding two blocks was displayed, and participants could take a short break if necessary.
Food Choice in Session 1.
After the training, participants received the choice task. They were informed that at the end of the session, one choice trial would be randomly selected and they would receive a small bag of the candies they had chosen on the selected trial. To reduce the amount of candies we needed to purchase, two additional trials were added to the end of the choice task, with candies that were available in the lab, and the program always selected from these two choice trials. These two trials were not included in the analyses.
On each choice trial, two candy pictures were presented side by side. The two candies were matched on evaluative ratings (both were rated either high or low) within each participant based on the evaluation task. One picture was previously associated with go responses, and the other with no-go responses in the training. Participants indicated their preference by pressing either the U or I key, for the left and right candy, respectively. They received 1.5 seconds for each choice. If they did not choose in time, the trial would be replaced by a prompt displaying “Choose faster!” in red for 500 ms, and the missed trial would be repeated later in the task until participants chose in time. If participants chose in time, the chosen candy was surrounded by a green frame for 500 ms as confirmation. The inter-trial interval varied between 1.0 and 1.5 seconds, in steps of 0.1 second. In this choice task, only half of the 32 selected pictures were presented (pictures belonging to the repeated choice condition). These 16 pictures were used to create 32 unique pairs (see Appendix), and each pair was presented twice to counterbalance the left-right position, resulting in 64 trials in total.
Memory Recognition in Session 1.
All 32 selected pictures were shown again one by one, and participants indicated for each picture whether it had been associated with pressing B (i.e., the go response) or not pressing B (i.e., the no-go response) in the training.
Demographics in Session 1.
At the end of Session 1, participants filled out the restrained eating scale (van Strien et al., 2007) and reported height, weight, the last time of food consumption, and the current hunger level (−100 = Not hungry at all; 100 = Very hungry; numerical values not displayed on the scale). Age and gender were reported when the experimental program was started. The result from the choice task was revealed, and participants received a small bag of candies of their choice.
Preparation in Session 2.
Session 2 was scheduled one week after Session 1 (except for 2 participants, who took part in Session 2 eight days, instead of seven days, after Session 1). Participants were again asked to fast for at least 3 hours before the session started.
Food Choice in Session 2.
Upon arrival, participants received a choice task where they made choices for consumption. The choice task was the same as the choice task in Session 1, except for two important changes. First, participants received unlimited time for each choice. Second, the choice task was twice as long as the one from Session 1. Half of the trials were repetitions of the choice trials from Session 1 (repeated choices), while the remaining half were presented for the first time (new choices). Like the repeated choice trials, on these new choice trials, the two candies were matched on evaluative ratings (both high or both low) within each participant, and one candy had been paired with go responses and the other with no-go responses in the GNG in Session 1. The whole task consisted of 128 trials, with the repeated and new choice trials randomly mixed.
Memory Recognition in Session 2.
All 32 pictures were presented one by one, and participants indicated for each picture whether it had been associated with pressing B or not pressing B in the GNG in Session 1.
Demographics in Session 2.
In the end participants indicated the last time of food consumption, and the current hunger level (−100 = Not hungry at all; 100 = Very hungry). The result from the food choice task was revealed, and participants received a small bag of candies of their choice. They were debriefed, compensated and thanked.
2.1.5 Data Analysis
We used multilevel logistic regression as the main analysis. The correlations between random effects were estimated when fitting multilevel models. The categorical variables were coded as: choice (choosing go item = 1, choosing no-go item = 0), session (Session 1 = 0, Session 2 = 1), choice condition (new = 1, repeated = 0), memory accuracy (correct = 1, incorrect = 0), and training condition (go = 1, no-go = 0). This coding scheme was used in all analyses.
2.2 Results
2.2.1 Performance in GNG
Participants performed very well in the GNG: for accuracy on go trials, M = 98.6%, SD = 3.1%; for accuracy on no-go trials, M = 97.9%, SD = 2.1%; and for median go reaction time, M = 518.0 ms, SD = 60.4 ms. For changes in performance throughout the training, see the Supplemental Materials.
2.2.2 Stimulus Evaluation
To check whether the selection procedure succeeded in creating go and no-go items that were matched on evaluation before the training, the average ratings of the selected pictures were submitted to a repeated-measures ANOVA, with rating level (high vs. low), training condition (go vs. no-go) and choice condition (new vs. repeated choices) as independent variables. Only the main effect of rating level was statistically significant, F(1, 147) = 838.2, p < .001, such that participants rated high-value items higher than low-value items (Mhigh = 35.3, SDhigh = 37.9; Mlow = −49.8, SDlow = 39.3). None of the other effects was statistically significant, Fs < 1.30, ps > .256. Inspection of the means across cells showed that before the training, the average ratings of go and no-go items were closely matched, for high-value and low-value items separately, and for items used on new and repeated choice trials. See Table S1 in the Supplemental Materials.
Note that previous work explored whether stimulus value (high vs. low value) would moderate the effect of GNG on choices, and overall found no moderation effect (Chen et al., 2019). To be consistent with the procedure of previous work, we also created choice pairs consisting of either two high-value or two low-value items. In line with previous findings, value of the choice pairs did not consistently modulate the effect of GNG (see the Supplemental Materials). For the following main analyses, we therefore did not include value of the choice pairs as a factor (as preregistered).
2.2.3 Choice in Session 1
Choice trials from Session 1 were analyzed with a multilevel logistic regression (formula: choice in Session 1 ∼ 1 + (1 | subject)), using the glmer function from the lme4 package in R (Bates et al., 2015; R Core Team, 2017). In line with previous findings (Chen et al., 2019) and our prediction, participants chose go items over no-go items when they chose under a time limit (Odds Ratio (OR) = 1.53, 95% CI = [1.36, 1.72], p < .001; see Figure 3, left panel).
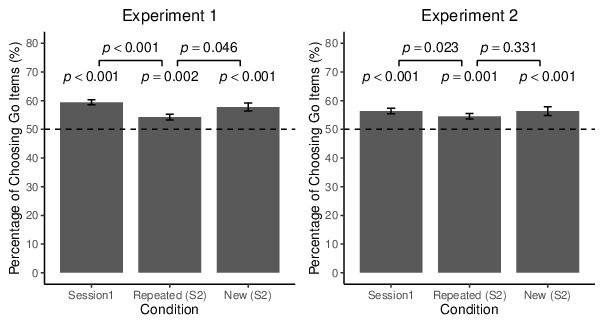
| Figure 3: Percentages of choosing go over no-go items in the different conditions in Experiment 1 (left panel) and Experiment 2 (right panel). P values (two-sided) are calculated from multilevel logistic regressions that compare the percentages of go choices against the 50% chance level (lower row) or between two conditions (upper row). Error bars stand for standard errors of mean. |
2.2.4 Choice in Session 2
For the repeated choices in Session 2, in line with our prediction,
participants still preferred go items (formula: repeated choice in Session
2 ∼ 1 + (1 | subject)) (OR = 1.22, 95% CI = [1.08, 1.37], p = .002). The size of this delayed effect was much smaller than that of the immediate effect (formula: choice ∼ 1 + session + (1 + session | subject); the dependent variable choice contains the choices in Session 1 and the repeated choices in Session 2), OR = 0.80, 95% CI = [0.73, 0.87], p < .001. Contrary to our prediction, on the new choice trials, participants also showed a preference for go items (formula: new choice in Session 2 ∼ 1 + (1 | subject)), OR = 1.45, 95% CI = [1.26, 1.66], p < .001. A direct comparison between the new choices and the repeated choices showed that preference for go items was stronger for new choices than for repeated choices (formula: choice in Session 2 ∼ 1 + choice condition + (1 + choice condition | subject)), OR = 1.19, 95% CI = [1.00, 1.41], p = .046.
2.2.5 Exploratory Analyses on Choice Reaction Time
Next we explored the influence of choice reaction time, for choices in
Session 1 and the repeated and the new choices in Session 2 separately. For
each analysis, the corresponding choice trials from each participant were
selected. The reaction times were standardized across the selected choice
trials within each participant and used as a predictor in multilevel
logistic regressions, with choice (choosing go or no-go item) as the
outcome variable. Random intercept and random slope for choice reaction
times were included (formulae: choice in Session 1 ∼ 1 +
choice RT + (1 + choice RT | subject); repeated choice in
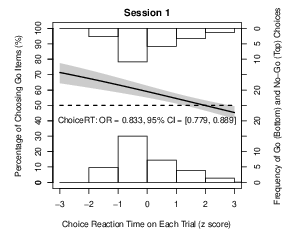
Session 2 ∼ 1 + choice RT + (1+choice RT | subject); new choice in Session 2 ∼ 1 + choice RT + (1 + choice RT | subject)). In both Session 1 and Session 2 (and for both repeated and new choices in Session 2), longer reaction times were associated with lower probability of choosing go items (OR = 0.85, 95% CI = [0.80, 0.91], p < .001 in Session 1; OR = 0.94, 95% CI = [0.88, 0.99], p = .030, for the repeated choices in Session 2; and OR = 0.87, 95% CI = [0.82, 0.92], p < .001 for the new choices in Session 2).
To assess the robustness of the results against influential data points, for each participant, trials with reaction times more than 2.5 median absolute deviation from each participant’s median reaction time were removed (Leys, Ley, Klein, Bernard & Licata, 2013). Choice reaction times were then standardized across the remaining trials within each participant. These analyses without outliers yielded the same results as the analyses reported above (see Figure 4).
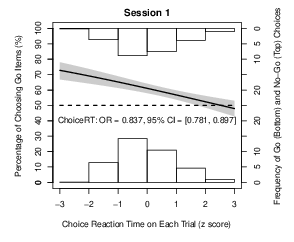
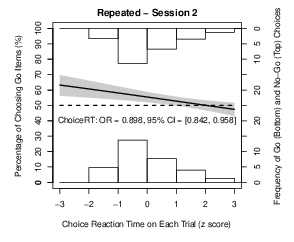
| Figure 4: Probability of choosing go items predicted by standardized reaction times in Experiment 1. Choice trials with reaction times more than 2.5 median absolute deviation from the median of each participant were removed. The solid line shows the probability of choosing go items (the left y axis) decreases as the choice RT increases. The shaded region stands for 95% confidence interval around the mean. The heights of bars stand for the average frequencies of choosing go items (bottom) and choosing no-go items (top) within each reaction time bin (the right y axis). |
2.2.6 Exploratory Analyses Comparing Choice RTs Between the Current Experiment and Chen et al. (2019)
Previous work has shown that immediately following training, participants did not prefer go items in a slow choice task (Experiment 1 and 3; Chen et al., 2019). In contrast, here the training led to preference change in a slow choice task after one week. As the exploratory analyses above showed, shorter choice reaction times were associated with a higher probability of choosing go items. It is thus possible that the reason why we observed an effect on delayed slow choices here was that participants on average chose faster than those in previous work (Chen et al., 2019). To explore this possibility, we thus compared the choice RTs in the current experiment to the choice RTs in Experiment 1 and 3 from Chen et al. (2019).
Since mean RTs were strongly influenced by extreme values, we opted to use median RTs instead. For each participant, we calculated their median choice RT for (1) the choices in Session 1, (2) the repeated choices in Session 2, and (3) the new choices in Session 2. These median choice RTs were then compared to the median choice RTs in Experiment 1 and 3 from Chen et al. (2019). As can be seen from Table 1, participants in the current experiment chose more quickly in Session 2 (repeated choices, M = 1087 ms, SD = 368; new choices, M = 1129 ms, SD = 375) than those in Experiment 3 (M = 1460 ms, SD = 703) from Chen et al. (2019). The comparisons against the choice RTs from Experiment 1 (M = 1143 ms, SD = 410) of Chen et al. (2019) were not statistically significant, and the Bayes factors provided support for the null hypothesis. However, Experiment 1 of Chen et al. (2019) used a different set of stimuli (high-calorie snacks rather than candies) and the procedure of GNG was also different (75% Go trials rather than 50% Go trials). This might make Experiment 1 of Chen et al. (2019) less comparable to the current experiment. Overall, there is some evidence that participants in the current experiment chose more quickly in Session 2 than those who received a slow choice task in previous work (at least compared to Experiment 3 of Chen et al., 2019). This result thus raised the question of whether GNG indeed could only change fast choices, or whether this conclusion was premature. GNG may impact choices as long as people do not choose too slowly. We will revisit this question in Experiment 2.
| Table 1: Comparison of the choice RTs in Experiment 1 to Experiments 1 and 3 of Chen et al. (2019). |
Comparison | diff | df | t | p | BF | g |
Session 1 vs. Exp 1 | −352 | 23.5 | −4.19 | < .001 | 2.87 × 10¹² | 0.918 |
Repeated vs. Exp 1 | −56 | 29.5 | −0.63 | .536 | 0.280 | 0.137 |
New vs. Exp 1 | −14 | 29.8 | −0.15 | .880 | 0.232 | 0.033 |
Session 1 vs. Exp 3 | −670 | 60.2 | −7.34 | < .001 | 1.17 × 10²⁰ | 1.120 |
Repeated vs. Exp 3 | −373 | 72.8 | −3.89 | < .001 | 9.38 × 10³ | 0.596 |
New vs. Exp 3 | −331 | 73.4 | −3.45 | <.001 | 868 | 0.528 |
| Note. diff = difference in choice RTs, in milliseconds. A negative value indicates shorter choice RTs in Experiment 1 than in Experiment 1 or 3 of Chen et al. 2019. Choice RTs were compared using the Welch’s t test. df = degrees of freedom from Welch’s t test. BF = Bayes factor from the Bayesian t test, using the default prior Cauchy’s width of 0.707. g = Hedges’s g.
|
2.3 Discussion
In line with our prediction, and replicating previous findings, participants preferred go items when they chose between go and no-go items under a time limit immediately after training. As expected, when the same choices were repeated one week later, they still preferred go items. Contrary to our prediction, participants also chose go items over no-go items when presented with the new choices in Session 2. Preferences for go items were even slightly stronger for the new choices than for the repeated choices. Thus, the GNG can directly influence delayed choices, and repeating the choices did not lead to a stronger effect.
Previous work has shown that immediately following training, participants overall did not prefer go items in a slow choice task (Chen et al., 2019). In contrast, here the training led to preference change in a slow choice task after one week. Exploratory analyses on the choice reaction times showed that for both immediate and delayed choices, shorter choice reaction times were associated with higher probabilities of choosing go items. Hence, one explanation for the inconsistency may be that whether participants overall show a preference for go items in a slow choice task depends on how fast they respond on average. In line with this idea, participants in Session 2 made choices more quickly than those in Experiment 3 of Chen et al. (2019), where the same slow choice task (with the same food items) was used. Since participants in the current experiment received a fast choice task in Session 1, they may have learned to make choices relatively quickly, and this response strategy may have led to an overall effect on preferences in Session 2. However, this increased decision-making speed alone may not explain the effect on delayed slow choices, as participants overall still chose more slowly in Session 2 (where they had unlimited time) than in Session 1 (where they had limited time; see Table 2). In Experiment 2, we sought to eliminate the potential learning of such a response strategy, and revisit the question of whether GNG influences choices without a time limit, by implementing a slow choice task in both sessions.
| Table 2: Comparison of the choice RTs between different conditions within Experiment 1. |
Comparison | diff | df | t | p | BF | g |
Session 1 vs. Repeated | −298 | 143 | −10.16 | < .001 | 3.91 × 10¹⁵ | 1.248 |
Repeated vs. New | −42 | 143 | −3.15 | .002 | 10.40 | 0.113 |
| Note. diff = difference in choice RTs, in milliseconds. Choice RTs were compared using the paired-samples t test. BF = Bayes factor from the Bayesian paired-samples t test, using the default prior Cauchy’s width of 0.707. g = Hedges’s g.
|
3 Experiment 2
The procedure of Experiment 2 was the same as Experiment 1, except that in both Sessions 1 and 2, participants received a slow choice task. The purpose of this modification was two-fold. First, this was to revisit the question of whether GNG can influence slow choices, with a more extensive training and a larger sample size than in previous experiments (Experiment 1, 8 repetitions, N = 24; Experiment 3, 6 repetitions, N = 60; Chen et al., 2019). Second, by using a slow choice task in Session 1, participants would presumably not learn the response strategy of choosing quickly. This would allow us to test whether the delayed effects observed in Experiment 1 were purely due to such a response strategy. Based on previous work (Chen et al., 2019; Veling, Chen, et al., 2017), we predicted that when participants received slow choices in Session 1, they would not prefer go items. For the delayed choices (both new and repeated) in Session 2, we did not have directional hypotheses.
3.1 Method
3.1.1 Sample Size
As in Experiment 1, we planned to recruit 150 participants. The Ethics Committee at the Faculty of Social Sciences of Radboud University reviewed and approved the experiment. All participants provided written informed consent.
3.1.2 Participants
One hundred and fifty-one participants took part in the experiment (mostly undergraduate students at Radboud University). Five participants were excluded based on pre-specified exclusion criteria (accuracy on go or no-go trials 3SDs below sample mean and below 90%; the same as in Experiment 1), leaving 146 participants for analysis in Session 1 (21 males, Mage = 21.7, SDage = 3.3). Five participants did not finish Session 2, leaving 141 participants for analysis in Session 2 (1 participant took part in Session 2 six days after Session 1). With 141 participants, the achieved power for detecting a delayed effect (with an OR = 1.18 as the expected effect size and an alpha level of 0.05) is around 80.6%.
3.1.3 Materials and Procedure
The same materials as in Experiment 1 were used. The procedure was also the same, except that participants received a choice task without time limit in Session 1. The rest remained the same.
3.2 Results
3.2.1 Performance in GNG
Similar to Experiment 1, overall participants showed good performance: for accuracy on go trials, M = 99.2%, SD = 1.7%; for accuracy on no-go trials, M = 98.2%, SD = 1.6%; and for median go reaction time, M = 463.9 ms, SD = 46.3 ms.
3.2.2 Stimulus Evaluation
A repeated-measures ANOVA was conducted on the average ratings before the training, with rating level (high vs. low), training condition (go vs. no-go) and choice condition (new vs. repeated choices) as independent variables. The main effect of rating level was statistically significant, F(1, 145) = 1272.5, p < .001 (Mhigh = 41.5, SDhigh = 32.0; Mlow = −44.7, SDlow = 37.2). All other effects were not statistically significant, Fs < 2.13, ps > .146. Before the training, the average ratings of go and no-go items were thus successfully matched (see Table S1 in the Supplemental Materials for average ratings in each condition before training).
3.2.3 Choice in Session 1
Contrary to our prediction, immediately after training, participants preferred go over no-go items when they had unlimited time for making choices (formula: choice in Session 1 ∼ 1 + (1 | subject)) (OR = 1.35, 95% CI = [1.17, 1.54], p < .001). Although participants descriptively showed a stronger preference for go items after training in Experiment 1 than in Experiment 2, this difference was not statistically significant (choice in Session 1 from both experiments ∼ 1 + experiment + (1 | subject)) (OR = 1.14, 95% CI = [0.95, 1.37], p = .156).
3.2.4 Choice in Session 2
For the repeated choices, participants still chose go items more often (formula: repeated choice in Session 2 ∼ 1 + (1 | subject)) (OR = 1.23, 95% CI = [1.08, 1.39], p = .001). This delayed effect was again smaller than the immediate effect in Session 1 (formula: choice ∼ 1 + session + (1 + session | subject); the dependent variable choice contains the choices in Session 1 and the repeated choices in Session 2) (OR = 0.90, 95% CI = [0.83, 0.99], p = .023). Replicating the result of Experiment 1, for the new choices, participants also showed a preference for go items (formula: new choice in Session 2 ∼ 1 + (1 | subject)) (OR = 1.33, 95% CI = [1.17, 1.51], p < .001). The difference between new and repeated trials was not statistically significant (formula: choice in Session 2 ∼ 1 + choice condition + (1 + choice condition | subject)) (OR = 1.09, 95% CI = [0.92, 1.29], p = .331), although as in Experiment 1, descriptively participants preferred go items more strongly for the new choices (see Figure 3, right panel).
3.2.5 Exploratory Analyses on Choice Reaction Time
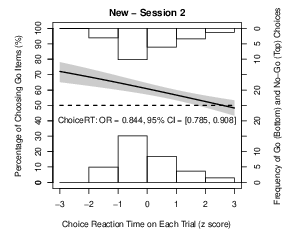
We similarly explored the influence of choice reaction times, for choices in Session 1 and the repeated and the new choices in Session 2, separately. For each of the three analyses, the corresponding choice trials were selected from each participant. Choice reaction times were standardized across the selected choice trials within each participant. Replicating results from Experiment 1, participants were less likely to choose go items on trials with longer reaction times (formulae: choice in Session 1 ∼ 1 + choice RT + (1 + choice RT | subject); repeated choice in Session 2 ∼ 1 + choice RT + (1 + choice RT | subject); new choice in Session 2 ∼ 1 + choice RT + (1 + choice RT | subject)) (OR = 0.86, 95% CI = [0.81, 0.92], p < .001 in Session 1; OR = 0.92, 95% CI = [0.88, 0.97], p = .003, for repeated choices in Session 2; and OR = 0.89, 95% CI = [0.84, 0.95], p < .001, for new choices in Session 2). The results remained the same when trials with extreme reaction times were removed (see Figure 5).

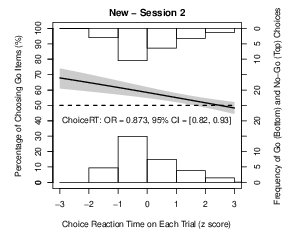
| Figure 5: Probability of choosing go items predicted by standardized reaction times in Experiment 2. Choice trials with reaction times more than 2.5 median absolute deviation from the median of each participant were removed. The solid line shows the probability of choosing go items (the left y axis) decreases as the choice RT increases. The shaded region stands for 95% confidence interval around the mean. The heights of bars stand for the average frequencies of choosing go items (bottom) and choosing no-go items (top) within each reaction time bin (the right y axis). |
3.2.6 Exploratory Analyses Comparing Choice RTs Between the Current Experiment and Chen et al. (2019)
As in Experiment 1, we compared the median choice RTs from the current experiment to those from Experiments 1 and 3 of Chen et al. (2019). Although we used a slow choice task in both sessions, participants nevertheless still chose more quickly in both Session 1 (M = 1254, SD = 444) and Session 2 (repeated choices: M = 979, SD = 256; new choices: M = 1050, SD = 290) than those in Experiment 3 of Chen et al. (2019). The comparisons against Experiment 1 of Chen et al. (2019) did not yield reliable differences (if anything, they chose more quickly for the repeated choices in Session 2 in the current experiment). See Table 3 for the results.
| Table 3: Comparison of choice RTs in Expt. 2 to Expts. 1 and 3 of Chen et al. (2019). |
Comparison | diff | df | t | p | BF | g |
Session 1 vs. Exp 1 | 112 | 32.6 | 1.23 | .229 | 0.410 | 0.269 |
Repeated vs. Exp 1 | −163 | 26.1 | −1.89 | .070 | 4.42 | 0.415 |
New vs. Exp 1 | −93 | 27.1 | −1.07 | .295 | 0.513 | 0.235 |
Session 1 vs. Exp 3 | −206 | 79.0 | −2.1 | .039 | 3.05 | 0.321 |
Repeated vs. Exp 3 | −481 | 65.8 | −5.15 | <.001 | 3.41 × 10⁸ | 0.791 |
New vs. Exp 3 | −410 | 67.7 | −4.37 | <.001 | 5.81 × 10⁵ | 0.670 |
| Note. diff = difference in choice RTs, in milliseconds. A negative value indicates shorter choice RTs in Experiment 2 than in Experiment 1 or 3 of Chen et al., 2019. Choice RTs were compared using the Welch’s t test. df = degrees of freedom from Welch’s t test. BF = Bayes factor from the Bayesian t test, using the default prior Cauchy’s width of 0.707. g = Hedges’s g.
|
Removing the time limit from the choice task in Session 1 led to longer choice RTs in Experiment 2 compared to Experiment 1. However, surprisingly, in Session 2 of Experiment 2 participants chose a bit faster than those in Session 2 of Experiment 1 (see Table 4). Thus, contrary to our expectation, receiving a slow choice task in Session 1 did not lead to slower choices in Session 2. This increased decision-making speed from Session 1 to Session 2 in Experiment 2 (see Table 5) may be due to the repetition of the same task. The experimental control over decision-making speed in the slow choice task is thus not optimal, as people can voluntarily choose quickly. Although the slow-slow design failed to reduce decision-making speed in Session 2, the effect on choices in Session 1 nevertheless showed that GNG can influence choices without time limit. The effects on delayed choices in Session 2 (for both repeated and new choices) again provided support for the direct effect account.
| Table 4: Comparison of the choice RTs between Experiment 1 and Experiment 2. |
Comparison | diff | df | t | p | BF | g |
Session1 | −464 | 162.2 | −12.27 | <.001 | 1.37 × 1025 | 1.428 |
Repeated | 108 | 255.7 | 2.87 | .004 | 6.16 | 0.339 |
New | 79 | 268.8 | 2.00 | .046 | 0.864 | 0.237 |
| Note. diff = difference in choice RTs between Experiment 1 and Experiment 2, in milliseconds. A negative difference indicates shorter choice RTs in Experiment 1. Choice RTs were compared using the Welch’s t test. df = degrees of freedom from Welch’s t test. BF = Bayes factor from the Bayesian t test, using the default prior Cauchy’s width of 0.707. g = Hedges’s g.
|
| Table 5: Comparison of the choice RTs between different conditions within Experiment 2. |
Comparison | diff | df | t | p | BF | g |
Session 1 vs. Repeated | 275 | 140 | 7.92 | <.001 | 1.11 × 10¹⁰ | 0.774 |
Repeated vs. New | −70 | 140 | −5.72 | <.001 | 1.74 × 10⁵ | 0.257 |
| Note. diff = difference in choice RTs, in milliseconds. Choice RTs were compared using the paired-samples t test. BF = Bayes factor from the Bayesian paired-samples t test, using the default prior Cauchy’s width of 0.707. g = Hedges’s g.
|
3.3 Discussion
Contrary to our prediction, participants chose go items over no-go items when they had unlimited time for making choices in Session 1. Numerically, the magnitude of this immediate effect was smaller than that observed in Experiment 1, but the difference between experiments was not statistically significant. Replicating results from Experiment 1, for both the repeated and new choices in Session 2, participants chose go items over no-go items. These results provided further support for the direct effect account. Based on Experiments 1 and 2, we conclude that merely responding versus not responding to food items can directly change preferences for these items for at least one week. Note that our results do not show that an indirect effect of GNG on Session 2 choices via its influence on Session 1 choices does not exist. As the exploratory analyses in the next section will show, choices in Session 1 influence choices in Session 2 in a more nuanced manner than the ‘indirect effect’ account we originally proposed.
In the current experiment, GNG influenced choices made without a time limit, while no such influence was observed in previous work (Chen et al., 2019; Veling, Chen, et al., 2017). Exploratory analyses revealed that as in Experiment 1, shorter choice reaction times were associated with a higher probability of choosing go items, for choices in both sessions. Surprisingly, using a slow choice task in Session 1 did not reduce the decision-making speed in Session 2, which might have contributed to the effects in Session 2. However, choice RTs in Session 1 were overall longer in Experiment 2 than in Experiment 1, while an effect of GNG on immediate choices was observed in both experiments. Thus, GNG seems able to influence choices without a time limit (and this direct influence can be maintained over one week). Post-hoc, we think the claim that GNG cannot influence choices without a time limit (Chen et al., 2019) was unwarranted for two reasons. First, participants who received a choice task without a time limit could in principle still choose quickly. It is possible that GNG may change preferences in a choice task without a time limit, as long as participants choose quickly on a substantial amount of trials (as the exploratory analyses on choice RTs here showed). Second, the previous work used a relatively short training and found no significant effect (Chen et al., 2019). In contrast, the current research employed a longer training. This difference in dosage may also explain the difference. The updated conclusion is thus that effects of GNG on preferences are stronger when people choose more quickly, and this effect varies along a continuum of decision-making speed (see also Chen et al., 2019, where shorter choice reaction times were also associated with higher probabilities of choosing Go items).
4 Exploring the Difference Between Repeated and New Choices
4.1 The Aim and Overview of Exploratory Analyses
Two experiments consistently showed that GNG led to preference change one week after training. Supporting the direct effect account, this delayed effect was observed without presenting the choices immediately after training. Furthermore, repeating the choices did not seem to increase the size of the delayed effect. If anything, participants chose go items more often with the new choices than with the repeated choices in Session 2, although this difference was not statistically significant in Experiment 2. Since neither account predicted such an effect, this unexpected finding was explored with a series of exploratory analyses.3
4.2 Comparing New and Repeated Choices in Session 2
To evaluate the difference between repeated and new choices, we first combined data from both experiments. Although the two experiments differed slightly in procedures (i.e., whether the choice task in Session 1 was with or without time limit), the results were highly similar, indicating that the two experiments may be sufficiently similar to be combined.
A multilevel logistic regression was used on choices from Session 2, with choice trials nested within participants. Whether a certain choice trial was new or repeated was used as the predictor, and whether the chosen item was a go or no-go item was used as the outcome. All random slopes and random intercepts were included (formula: choice in Session 2 ∼ 1 + choice condition + (1 + choice condition | subject)). With the combined dataset, the difference between new and repeated choices in Session 2 was statistically significant (OR = 1.14, 95% CI = [1.01, 1.28], p = .035). Overall, participants showed a stronger preference for go items with the new choices than with the repeated choices in Session 2.
4.3 Exploring Differences in Memory for New and Repeated Items
Being fully aware that the difference between the new and repeated choices in Session 2 was exploratory in nature and small in size, we nevertheless deemed further exploration of this (potential) difference interesting and worthwhile. One candidate for explaining this potential difference is participants’ memory of the stimulus-response contingencies. For instance, recent work has shown that GNG has a larger effect on stimulus evaluation for participants who remembered the contingencies better (Chen et al., 2018). To assess whether memory performance differed between new and repeated items, two multilevel logistic regressions were conducted, one for each session. For both analyses, whether the item was used in the new or repeated choices in Session 2 was used as predictor, and whether the contingency memory was correct or not was used as outcome. Random intercept and random slope were estimated per participant for memory in Session 1 (memory in Session 1 ∼ 1 + choice condition + (1 + choice condition | subject)), and only the random intercept was estimated for memory in Session 2 (formula: memory in Session 2 ∼ 1 + choice condition + (1|subject). Including the random slope leads to singular fit). In Session 1, participants remembered the stimulus-response contingencies better for the new items than for the repeated items (OR = 2.13, 95% CI = [1.83, 2.47], p < .001), whereas no memory advantage was observed in Session 2, (OR = 1.03, 95% CI = [0.95, 1.12], p = .492). In other words, participants’ contingency memory in Session 1 was better for the items that were not included in the Session 1 choice task, but this memory advantage was absent in Session 2. For the average memory accuracy and the discriminability index based on signal detection analysis (see below) in both sessions, see Table 6.
| Table 6: Memory performance in Sessions 1 and 2. |
| | Session 1 | Session 2 |
| New | Repeated | New | Repeated |
Memory Accuracy | 77.9% (20.0%) | 70.0% (18.3%) | 58.2% (13.4%) | 57.5% (14.8%) |
Discriminability | 1.68 (1.23) | 1.18 (1.11) | 0.47 (0.77) | 0.43 (0.86) |
| Note. Standard deviations are reported in parentheses. Memory accuracy stands for the accuracy in the memory recognition task. Discriminability stands for the discriminability index (d’) calculated from the signal detection analysis.
|
Since the memory recognition task was a forced binary choice task, correct responses could also result from guessing. To disentangle participants’ ability to tell go and no-go items apart (i.e., discriminability) and the general bias in responding (i.e., bias), we also applied signal detection analysis to the memory recognition data (Macmillan & Creelman, 2005). In line with the results reported above, in Session 1 participants showed better discriminability between go and no-go items for the new items, while the difference in discriminability between the new and repeated items was not statistically significant in Session 2 (see Table 6). For the details of these analyses, see the Supplemental Materials.
4.4 Exploring the Influence of Contingency Memory on Choices
The previous exploratory analyses identified a difference in contingency memory for new and repeated items in Session 1. To explore whether this difference in memory could explain the difference in Session 2 choices, two memory indices were calculated for each choice trial in Session 2, based on participants’ memory in Session 1 and Session 2, respectively. Trials on which both items were correctly remembered (i.e., participants correctly recalled the response category for both items; both items correct) were coded as 1, trials on which only one item was correctly remembered were coded as 0 (one item correct), and trials on which both items were incorrectly remembered were coded as −1 (both items incorrect). For each choice trial in Session 2, we looked up participants’ memory performance (i.e., correct vs. incorrect) for the two items in Session 1, and assigned a value to this Session 1 memory index based on the coding rules outlined above. The value of the Session 2 memory index was similarly determined by looking up participant’s memory performance for the two items in Session 2. This coding strategy allows us to describe participants’ contingency memory on the trial level, and relate these memory indices to choices in Session 2. In Table 7, we provide the means and standard deviations of the probability of choosing go items in both Session 1 and Session 2 (for repeated and new choices separately), as a function of participants’ memory index in Sessions 1 and 2. As the descriptive data show, participants were more likely to choose go items (in both Sessions 1 and 2) on trials for which they had better contingency memory (in both Sessions 1 and 2). Below, we conducted multilevel logistic regressions to assess the influence of Session 1 and Session 2 memory on choices in Session 2.
| Table 7: Probability of choosing Go items as a function of memory in Sessions 1 and 2. |
Memory Session | Memory
Index | Choices in
Session 1 | Repeated in Session 2 | New in
Session 2 |
1 | Both items incorrect | 41.5% (32.6%) | 39.7% (31.6%) | 42.3% (35.5%) |
| | One item correct | 50.3% (21.9%) | 48.3% (21.7%) | 53.1% (21.8%) |
| | Both items correct | 66.8% (22.1%) | 60.9% (22.5%) | 59.7% (21.2%) |
2 | Both items incorrect | 46.1% (30.0%) | 42.0% (29.6%) | 45.2% (31.3%) |
| | One item correct | 56.3% (18.1%) | 52.8% (17.5%) | 54.6% (19.1%) |
| | Both items correct | 64.2% (26.4%) | 64.2% (26.4%) | 64.7% (26.2%) |
| Note. Standard deviations are reported in parentheses.
|
Session 1 and Session 2 memory indices were used as predictors in three multilevel logistic regressions, with either Session 1 memory, Session 2 memory or both entered as predictors. In all three models, choice condition (new vs. repeated) was always included as a predictor, and whether participants chose the go or no-go item on each trial was used as outcome. Random intercept and random slopes for all predictors were included on the participant level (formulae: choice in Session 2 ∼ 1 + Session 1 memory + choice condition + (1 + Session 1 memory + choice condition | subject); choice in Session 2 ∼ 1 + Session 2 memory + choice condition + (1 + Session 2 memory + choice condition | subject); choice in Session 2 ∼ 1 + Session 1 memory + Session 2 memory + choice condition + (1 + Session 1 memory + Session 2 memory + choice condition | subject)). Results of the multilevel logistic regressions can be found in Table 8. Session 1 memory positively predicted Session 2 choices, both when entered alone and when entered together with Session 2 memory. Session 2 memory also positively predicted choices in Session 2, both when entered alone, and when entered together with Session 1 memory. Together, these results suggest that for trials that participants had better memory in Session 1, they chose go items more often in Session 2. The improved memory for new items compared to repeated items in Session 1 may thus potentially explain why participants showed a slightly stronger preference change for the new choices in Session 2. We also explored the effects of memory recognition RT in Session 1 on choices in Session 2. The analyses and results can be found in the Supplemental Materials.
| Table 8: Multilevel logistic regressions using Session 1 and 2 memory to predict Session 2 choices. |
Effect | OR | 95% CI | z | p |
Session 1 Memory as Predictor | | | | |
Session 1 Memory | 1.64 | [1.48, 1.82] | 9.30 | <.001 |
New vs. Repeated | 1.06 | [0.93, 1.20] | 0.89 | .373 |
Session 2 Memory as Predictor | | | | |
Session 2 Memory | 1.66 | [1.50, 1.84] | 9.87 | <.001 |
New vs. Repeated | 1.14 | [1.00, 1.29] | 2.02 | .043 |
| Session 1 and 2 Memory as Predictors | | | |
Session 1 Memory | 1.49 | [1.34, 1.65] | 7.48 | <.001 |
Session 2 Memory | 1.61 | [1.46, 1.78] | 9.36 | <.001 |
New vs. Repeated | 1.07 | [0.94, 1.22] | 1.01 | .315 |
Similar results were obtained when discriminability indices (calculated with the signal detection analysis) from both sessions were used as predictors of Session 2 choices. For details see the Supplemental Materials. However, since the discriminability index was calculated based on sets of items, the inferences can only be made on the participant level, rather than on the trial level. Combined, these two sets of analyses suggested that contingency memory in Session 1 was associated with choices in Session 2: on the trial level, participants were more likely to choose go items in Session 2 on trials for which they had better memory in Session 1; on the participant level, participants who remembered the stimulus-response contingencies better in Session 1 were overall more likely to choose go items in Session 2.
4.5 Choices Interfere with Contingency Memory
Why did the contingency memory differ between repeated and new items in Session 1? The defining difference between repeated and new items was that repeated items were presented in the choice task in Session 1, preceding the memory recognition task. Since in the choice task, participants also responded to items when making choices, it seemed plausible that such responses might have interfered with contingency memory. To test this idea, for each participant, we calculated how often each of the 16 items (8 go, 8 no-go) were chosen in the choice task in Session 1. Since each item was presented 8 times in the choice task, an item could be chosen maximally 8 times and minimally 0 times. The choice counts were standardized within each participant to facilitate the inclusion of the interaction effect (see below) in the analysis.
In a multilevel logistic regression, the training condition of an item
(i.e., go vs. no-go), the standardized choice count and their interaction
were used as predictors. Whether participants indicated the item as a go or
no-go item in the memory recognition task was used as outcome (remembered
as go = 1, remembered as no-go = 0). All random intercepts and random
slopes were estimated per participant (formula: memory in Session 1
∼ 1 + training condition * choice count in Session 1 + (1+training
condition
* choice count in Session 1 | subject)). As can be seen in Table 9, participants were more likely to indicate a go item as go than to indicate a no-go item as go, suggesting that they had acquired the stimulus-response contingencies from training. More interestingly, the standardized choice count was also a positive predictor. Participants were more likely to categorize an item as go the more often they had chosen this item in the choice task. The interaction effect was not significant.
| Table 9: Multilevel logistic regressions using choices to predict contingency memory. |
Effect | OR | 95% CI | z | p |
Session 1 | | | | |
Go vs. No-Go | 6.26 | [4.95, 7.90] | 15.4 | <.001 |
Choice Count (z score) | 1.73 | [1.51, 1.97] | 8.02 | <.001 |
Interaction | 1.06 | [0.89, 1.26] | 0.64 | .523 |
Session 2 | | | | |
Go vs. No-Go | 1.73 | [1.55, 1.93] | 9.59 | <.001 |
Choice Count (z score) | 1.50 | [1.37, 1.63] | 9.26 | <.001 |
Interaction | 0.90 | [0.81, 1.00] | -1.94 | .052 |
For Session 2, we similarly counted for each participant how often each item was chosen in Session 2, and used the standardized choice count to predict the recognition memory in Session 2 (formula: memory in Session 2 ∼ 1 + training condition * choice count in Session 2 + (1 + training condition * choice count in Session 2 | subject)). Similar results were obtained (see Table 9).
Choosing certain items may therefore influence the contingency memory for these items. This may explain why participants had better memory for new items in Session 1, and why this memory advantage disappeared in Session 2. That is, in Session 1, only the repeated items were presented in the choice task, which may have interfered with participants’ memory for these items. Without such interferences, contingency memory for new items was therefore retained better in Session 1. This memory advantage may have become smaller with the delay of one week. Furthermore, since both the new and repeated items were used in Session 2 choices, the interference from choices would be of similar magnitude, leading to similar levels of memory for repeated and new items in Session 2. Presenting items in the choice task itself (rather than the responses in the choice task) may also interfere with memory. However, such a general interference cannot explain the observed correlations between choices and memory, and is thus a complementary rather than an alternative explanation to the account proposed above.
4.6 Summary of Exploratory Analyses
In line with the order in which the tasks were presented, making choices in Session 1 may have interfered with participants’ contingency memory for repeated items. Session 1 contingency memory predicted participants’ choices in Session 2, which may explain the stronger preference change effect for new choices compared to repeated choices in Session 2 (although again the effect was obtained with an exploratory analysis and small in effect size). Choices in Session 2 then influenced participants’ contingency memory in Session 2, for both new and repeated items.
5 General Discussion
In the current research, we investigated the nature of the delayed effect of GNG on preferences, by presenting half of the items from the training in both the Session 1 and Session 2 choice task, and the remaining half only in the Session 2 choice task. In Experiment 1, we explored the possibility of using fast choices to influence slow choices, by using an immediate-fast, delay-slow design. In Experiment 2, we revisited the question of whether GNG can influence slow choices, by using an immediate-slow, delay-slow design. Contrary to our initial expectation to obtain support only for the indirect effect account, in both experiments, participants preferred go items in the new choices in Session 2, suggesting that GNG directly influenced delayed choices, without the mediating influence of immediate choices.
In both experiments, GNG influenced choices when there was no time limit for indicating choices (both right after training and one week later), while in previous work no effect of GNG on immediate slow choices was observed (Chen et al., 2019). Exploratory analyses showed that participants in the current research made decisions more quickly than those in previous work (Experiment 3 of Chen et al., 2019), and this might partly explain the different results. The experimental control over decision-making speed is thus not optimal in the slow choice task, as people can voluntarily choose quickly. Instead of concluding that GNG can only influence choices under a time limit, our revised conclusion is that the effect of GNG on choices varies along a continuum of decision-making speed, with faster choices being more strongly influenced by the training.
Repeating the choices did not lead to a stronger delayed effect. If anything, participants showed a slightly stronger preference for go over no-go items in the new choice trials than in the repeated choice trials in Session 2. Overall, these results provide strong support for the direct effect account. Consistently responding versus not responding to food items may therefore create preferences for go over no-go items that survive at least one week. Exploratory analyses further showed that choices interfered with participants’ contingency memory (as participants chose and hence responded to no-go items in the choice task), and contingency memory in Session 1 predicted choices in Session 2. Choices in Session 1 thus also influence choices in Session 2, but in a more nuanced manner than the original ‘indirect effect’ account. Implications of these findings will be discussed below.
5.1 Choices Interfere with Contingency Memory
Participants were more likely to indicate an item as a go item if they had chosen it frequently in the choice task. This influence of choice on memory may partly result from participants’ confusion over the context in which a response was previously executed. That is, when asked to indicate whether a certain item was paired with the go or no-go response, participants might need to retrieve past instances in which the item was encountered (Logan, 1998; 2002). These retrieved instances serve as input for determining participants’ memory response. Since the responses used for selecting preferred items in the choice task and the go responses in GNG were highly similar (i.e., both required pressing a key), participants may retrieve responses from both the GNG and the choice task. For items that participants frequently chose and hence responded to in the choice task, more instances involving go responses can be retrieved, and the chance of remembering the item as a go item accordingly increased. To test this claim, future work may use different responses in the GNG and the choice task to see whether contingency memory would be less susceptible to the interference of making choices. For instance, participants may make choices by looking at the preferred item or by moving a mouse cursor over the preferred item in a mouse-tracking paradigm (Freeman & Ambady, 2010). Such choice tasks will not only allow us to test the claim above, but also provide more insight (e.g., the attentional process, and which stage of decision-making is influenced by the training etc.) into the decision-making process.
The responses used in the current choice task were highly similar to the go responses in GNG. It is thus possible that the current choice task can be seen as a training in itself. Closer inspection of the choice task reveals that each food item was presented 8 times, which were 8 instances for participants to learn (cf. 10 repetitions of each stimulus in the GNG). Since participants chose (hence responded to) go items around 60% of the time, the net effect of the choice task might be to reduce the effect of GNG. This reasoning is consistent with the reasoning in the domain of approach avoidance training, where measuring the changes in approach/avoidance bias after training (e.g., by measuring the reaction time of approaching and avoiding the same item) may reduce the training’s effectiveness (Becker et al., 2015). In any case, this interference effect shows that go and no-go responses are such basic elements of many psychological tasks and human actions in general, that the influence of go and no-go responses on preferences may be quite ubiquitous. This shows the wide applicability of using simple go and no-go responses to modify preferences, but at the same time may also pose a challenge when such effects are studied in the laboratory. Extra caution is therefore needed to carefully examine all parts of an experiment, to ensure that the effect of GNG is not inadvertently modified by responses from other tasks.
The concern for the ‘counteractive’ effects of tasks after GNG may be one reason why researchers have widely used visual analogue or Likert scales to assess the effects of GNG (e.g., Chen et al., 2016; Lawrence, Sullivan, et al., 2015; Serfas et al., 2017), as the responses on these scales are quite distinct from the responses in GNG. While using such scales can help avoid the ‘counteractive’ effects, it has also resulted in a relatively paucity of studies that examine the effects of GNG on other behavioral outcomes, such as choices. Using choice tasks that involve responses distinct from go responses (such as the eye-tracking or the mouse-tracking paradigm mentioned above) can help address this problem.
5.2 The Role of Contingency Memory in Preference Change
Better contingency memory is associated with a stronger preference change effect. Since contingency memory was measured with an explicit recognition task, this finding raises the question to what extent this preference change effect is due to experimenter demand. However, demand characteristics alone cannot easily explain the effect of GNG on preferences. First, participants were more likely to choose go items on trials where they chose quickly. If they indeed purely based their choices on contingency memory, we may expect more choices for go items when they chose slowly, as accurately recalling the response category of each item and choosing accordingly would likely take time. Second and more importantly, contingency memory in Session 1 predicted choices in Session 2, after controlling for memory in Session 2. This finding suggests that choices are not purely determined by explicit contingency memory at the time of decision-making, as the demand characteristics explanation may predict. Rather, contingency memory in Session 1 may capture the extent of learning from training, which influences choices one week later above and beyond the explicit contingency memory in Session 2.
Memory plays an important role in decision-making. For instance, evidence accumulation models propose that during value-based decision-making (such as when choosing which food to eat), people accumulate evidence regarding the values of different options, and commit to a decision when a threshold is reached (Forstmann et al., 2016). Episodic memory has been argued to be an important source of such evidence (Bakkour et al., 2019). In line with this idea, episodic memory has been shown to influence choice in several lines of research. For instance, incidental reminders of previous choices or choice contexts can bias current choices for reward (e.g., Bornstein et al., 2017; Bornstein & Norman, 2017; Duncan & Shohamy, 2016). In the domain of eating behavior, implanting false positive or negative memories can increase or decrease one’s preference for certain food items, respectively (Bernstein & Loftus, 2009). Based on these observations, we propose that during the choice task in the current research, participants also retrieved past instances involving the food items presented on each choice trial. These episodic memory traces may include the go or no-go responses associated with each item, and/or the affective reactions accompanying the responses, and may thus bias the choices in favor of go items. Since the memory recognition task explicitly required participants to retrieve these episodes for each item, this correlation between contingency memory (in Session 1) and choices (in Session 2) may reflect this common memory retrieval process in these two tasks. For items that participants could easily retrieve relevant episodic memory, contingency memory for these items will be better in Session 1, and these relatively easily retrieved episodes will also have a larger influence on choices in Session 2. In other words, contingency memory may partly capture how effectively participants have learned from the training.
In addition to being an assessment of learning in Session 1, the memory recognition task may also have contributed to the maintenance of the learned changes (i.e., changes in stimulus evaluation or the formation of stimulus-response associations). Previous research has shown that testing participants on learned materials is a powerful mnemonic enhancer, leading to better long-term retention of learned knowledge, even in comparison to repeated studying of the same materials (Karpicke & Roediger, 2008; Roediger & Butler, 2011; Roediger & Karpicke, 2006). The memory recognition task in the present research is akin to such a retrieval practice, in which participants need to retrieve the previous instances associated with a certain stimulus. The benefits identified for such retrieval practice may therefore apply to the memory recognition task as well. This raises an interesting question, namely whether testing participants’ explicit contingency memory would lead to better maintenance of the training-induced changes, especially when they can retrieve the correct stimulus-response pairings. Exploring the testing effect in the context of GNG may be a fruitful direction for future research, as it may help elucidate the role of contingency memory in the delayed effects and provide effective methods for increasing the retention of training effects in applied settings.
5.3 Comparison Between GNG and CAT
In both experiments, the magnitude of the delayed effects was smaller than that of the immediate effects. In contrast to this quick decline in effect size, a more stable effect has been demonstrated with the CAT (Salomon et al., 2018; Schonberg et al., 2014). Some procedural differences may have contributed to this difference. For instance, previous work on the CAT normally employed more intensive training (from 12 to 20 repetitions), and the uneven distribution of go and no-go items in the CAT (around 25% go items in the CAT, rather than 50% as in the GNG) may have made learning the stimulus-response contingencies easier.
Different underlying mechanisms of the CAT and the GNG may also lead to the different stability of the delayed effects. The effect of CAT on preference has been ascribed to heightened attention associated with go items via training (Schonberg et al., 2014), which may be more easily retained than changes in stimulus evaluation or formation of stimulus-response associations as induced by GNG. Moreover, as most previous CAT experiments included choices immediately following training (except Experiment 1 in Botvinik-Nezer et al., 2019, where preference change was observed three days after the CAT), it has remained unclear whether the stable delayed effects over up to six months from the CAT are due to the direct influence of the training, or rather due to the immediate choices. Based on the current findings with GNG, it seems likely that the CAT can directly lead to stable preference change over a long duration. A procedure similar to the one employed here can be used to shed light on this question.
5.4 Limitations and Future Directions
The present research convincingly showed that GNG-induced changes could be maintained over time, and influence people’s preferences after one week. However, the changes induced by GNG were not directly measured. GNG may change stimulus evaluation (Chen et al., 2016; Schonberg et al., 2014; Veling et al., 2008), which in turn may lead to preference change (Veling et al., 2013). Alternatively, or in addition, stimulus-stop and/or stimulus-go associations formed during GNG may underlie the preference change effect. Future work may directly measure stimulus evaluation and stimulus-response associations both immediately after training and after a delay, to see whether these changes can be maintained, and how they may relate to preference change. A second important question concerns the generalization of the training effects to new contexts. In the current research (and most previous research), participants received all tasks in the same context, namely research cubicles in a psychology laboratory. Being in the same context may help participants retrieve relevant episodic memories from the training (Bornstein & Norman, 2017), and thus boost the effect of GNG on preferences both immediately after training and after some delay. However, real-life situations in which people make food choices are probably very different from psychology laboratories. It is therefore important to see whether the effects of GNG can be maintained in novel and ecologically more valid contexts.
5.5 Conclusion
To conclude, in two experiments we consistently found that participants’ food choices were influenced by the GNG they received one week earlier, both when these choices were encountered for the first time and when these choices were repeated. Furthermore, the preference change effect was observed for both choice tasks with and without a time limit. These findings strongly suggest that changes induced by GNG can be retained over time, without the mediating influence of immediate choices. Exploratory analyses showed that choices interfered with contingency memory, and contingency memory measured immediately after training reliably predicted choices one week later. Contingency memory may therefore be a summary of all previous stimulus-response pairings, and measuring memory may help retain the effect. While more research is still needed for understanding the exact mechanism that underlies the delayed effects, the current research unequivocally showed that manipulating mere action versus inaction toward items has a lasting influence on people’s preferences for these items. Tasks that manipulate such simple go/no-go responses, such as the GNG, hence seem worthwhile to explore as tools for sustainable behavior change.
References
Allom, V., Mullan, B., & Hagger, M. (2016). Does inhibitory control training improve health behaviour? A meta-analysis. Health Psychology Review, 10, 168–186. https://doi.org/10.1080/17437199.2015.1051078
Bakkour, A., Palombo, D. J., Zylberberg, A., Kang, Y. H., Reid, A., Verfaellie, M., Shadlen, M. N., & Shohamy, D. (2019). The hippocampus supports deliberation during value-based decisions. ELife, 8, e46080. https://doi.org/10.7554/eLife.46080
Bates, D. M., Maechler, M., Bolker, B., & Walker, S. (2015). Fitting linear mixed-effects models using lme4. Journal of Statistical Software, 67, 1–48. https://doi.org/10.1177/009286150103500418
Becker, D., Jostmann, N. B., Wiers, R. W., & Holland, R. W. (2015). Approach avoidance training in the eating domain: Testing the effectiveness across three single session studies. Appetite, 85, 58–65. https://doi.org/10.1016/j.appet.2014.11.017
Bernstein, D. M., & Loftus, E. F. (2009). The consequences of false memories for food preferences and choices. Perspectives on Psychological Science, 4, 135–139. https://doi.org/10.1111/j.1745-6924.2009.01113.x
Bornstein, A. M., Khaw, M. W., Shohamy, D., & Daw, N. D. (2017). Reminders of past choices bias decisions for reward in humans. Nature Communications, 8, 15958. https://doi.org/10.1038/ncomms15958
Bornstein, A. M., & Norman, K. A. (2017). Reinstated episodic context guides sampling-based decisions for reward. Nature Neuroscience, 20, 997–1003. https://doi.org/10.1038/nn.4573
Botvinik-Nezer, R., Bakkour, A., Salomon, T., Shohamy, D., & Schonberg, T. (2019). Memory for individual items is related to non-reinforced preference change. bioRxiv, 621292. https://doi.org/10.1101/621292
Camp, B., & Lawrence, N. S. (2019). Giving pork the chop: Response inhibition training to reduce meat intake. Appetite, 141, 104315. https://doi.org/10.1016/j.appet.2019.06.007
Chen, Z., Holland, R., W., Quandt, J., Dijksterhuis, A., & Veling, H. (2019). When mere action versus inaction leads to robust preference change. Journal of Personality and Social Psychology, 117, 721–740. https://doi.org/10.1037/pspa0000158
Chen, Z., Veling, H., Dijksterhuis, A., & Holland, R. W. (2016). How does not responding to appetitive stimuli cause devaluation: Evaluative conditioning or response inhibition? Journal of Experimental
Psychology: General, 145, 1687–1701. https://doi.org/10.1037/xge0000236
Chen, Z., Veling, H., Dijksterhuis, A., & Holland, R. W. (2018). Go/No-Go training changes food evaluation in both morbidly obese and normal-weight individuals. Journal of Consulting and Clinical Psychology, 86, 980–990. https://doi.org/10.1037/ccp0000320
Daw, N. D., & O’Doherty, J. P. (2013). Multiple systems for value learning. In Glimcher, P. W., & Fehr, E. (Eds.). Neuroeconomics: Decision Making and the Brain: Second Edition, pp. 393–410. London: Academic Press. https://doi.org/10.1016/B978-0-12-416008-8.00021-8
Doya, K. (2008). Modulators of decision making. Nature Neuroscience, 11, 410–416. https://doi.org/10.1038/nn2077
Duncan, K. D., & Shohamy, D. (2016). Memory states influence value-based decisions. Journal of Experimental Psychology: General, 145, 1420–1426. https://doi.org/10.1037/xge0000231
Forstmann, B. U., Ratcliff, R., & Wagenmakers, E.-J. (2016). Sequential sampling models in cognitive neuroscience: Advantages, applications, and extensions. Annual Review of Psychology, 67, 641–666. https://doi.org/10.1146/annurev-psych-122414-033645
Freeman, J. B., & Ambady, N. (2010). MouseTracker: Software for studying real-time mental processing using a computer mouse-tracking method. Behavior Research Methods, 42, 226–241. https://doi.org/10.3758/BRM.42.1.226
Green, P., & MacLeod, C. J. (2016). SIMR: An R package for power analysis of generalized linear mixed models by simulation. Methods in Ecology and Evolution, 7, 493–498. https://doi.org/10.1111/2041-210X.12504
Guitart-Masip, M., Duzel, E., Dolan, R., & Dayan, P. (2014). Action versus valence in decision making. Trends in Cognitive Sciences, 18, 194–202. https://doi.org/10.1016/j.tics.2014.01.003
Karpicke, J. D., & Roediger, H. L. (2008). The critical importance of retrieval for learning. Science, 319, 966–968. https://doi.org/10.1126/science.1152408
Lawrence, N. S., Sullivan, J. O., Parslow, D., Javaid, M., Adams, R. C., Chambers, C. D., Kos, K., & Verbruggen, F. (2015). Training response inhibition to food is associated with weight loss and reduced energy intake. Appetite, 95, 17–28. https://doi.org/10.1016/j.appet.2015.06.009
Lawrence, N. S., Verbruggen, F., Morrison, S., Adams, R. C., & Chambers, C. D. (2015). Stopping to food can reduce intake. Effects of stimulus-specificity and individual differences in dietary restraint. Appetite, 85, 91–103. https://doi.org/10.1016/j.appet.2014.11.006
Leys, C., Ley, C., Klein, O., Bernard, P., & Licata, L. (2013). Detecting outliers: Do not use standard deviation around the mean, use absolute deviation around the median. Journal of Experimental Social Psychology, 49, 764–766. https://doi.org/10.1016/j.jesp.2013.03.013
Logan, G D. (1998). Toward an instance thepry of automatization. Psychological Review, 95, 492–527. https://doi.org/10.1037/0033-295X.95.4.492
Logan, Gordon D. (2002). An instance theory of attention and memory. Psychological Review, 109, 376-400. https://doi.org/10.1037/0033-295X.109.2.376
Macmillan, N. A., & Creelman, C. D. (2005). Detection theory: A user’s guide (2nd ed). Lawrence Erlbaum Associates.
Peirce, J. W. (2007). PsychoPy: Psychophysics software in Python. Journal of Neuroscience Methods, 162, 8–13. https://doi.org/10.1016/j.jneumeth.2006.11.017
R Core Team. (2017). R Development Core Team. In R: A Language and Environment for Statistical Computing. http://www.R-project.org
Roediger, H. L., & Butler, A. C. (2011). The critical role of retrieval practice in long-term retention. Trends in Cognitive Sciences, 15, 20–27. https://doi.org/10.1016/j.tics.2010.09.003
Roediger, H. L., & Karpicke, J. D. (2006). Test-enhanced learning: Taking memory tests imporves long-term retention. Psychological Science, 17, 249–255. https://doi.org/10.1111/j.1467-9280.2006.01693.x
Salomon, T., Botvinik-Nezer, R., Gutentag, T., Gera, R., Iwanir, R., Tamir, M., & Schonberg, T. (2018). The cue-approach task as a general mechanism for long-term non-reinforced behavioral change. Scientific Reports, 8, 1–13. https://doi.org/10.1038/s41598-018-21774-3
Schonberg, T., Bakkour, A., Hover, A. M., Mumford, J. A., Nagar, L., Perez, J., & Poldrack, R. A. (2014). Changing value through cued approach: An automatic mechanism of behavior change. Nature Neuroscience, 17, 625–630. https://doi.org/10.1038/nn.3673
Serfas, B. G., Florack, A., Büttner, O. B., & Voegeding, T. (2017). What does it take for sour grapes to remain sour? Persistent effects of behavioral inhibition in go/no-go tasks on the evaluation of appetitive stimuli. Motivation Science, 3, 1–18. https://doi.org/10.1037/mot0000051
Sharot, T., Fleming, S. M., Yu, X., Koster, R., & Dolan, R. J. (2012). Is choice-induced preference change long lasting? Psychological Science, 23, 1123–1129. https://doi.org/10.1177/0956797612438733
Sharot, T., Velasquez, C. M., & Dolan, R. J. (2010). Do decisions shape preference? Evidence from blind choice. Psychological Science, 21, 1231–1235. https://doi.org/10.1177/0956797610379235
Sutton, R. S., & Barto, A. G. (1998). Reinforcement learning: An introduction. MIT Press. https://doi.org/10.1109/TNN.1998.712192
Thorndike, E. L. (1911). Animal intelligence: Experimental studies. Macmillan. https://doi.org/10.1097/00005053-191205000-00016
van Strien, T., Peter Herman, C., Engels, R. C. M. E., Larsen, J. K., & van Leeuwe, J. F. J. (2007). Construct validation of the Restraint Scale in normal-weight and overweight females. Appetite, 49, 109–121. https://doi.org/10.1016/j.appet.2007.01.003
Veling, H., Aarts, H., & Stroebe, W. (2013). Stop signals decrease choices for palatable foods through decreased food evaluation. Frontiers in Psychology, 4, 1–7. https://doi.org/10.3389/fpsyg.2013.00875
Veling, H., Chen, Z., Tombrock, M. C., Verpaalen, I. A. M., Schmitz, L. I., Dijksterhuis, A., & Holland, R. W. (2017). Training impulsive choices for healthy and sustainable food. Journal of Experimental Psychology: Applied, 23, 204–215. https://doi.org/10.1037/xap0000112
Veling, H., Holland, R. W., & van Knippenberg, A. (2008). When approach motivation and behavioral inhibition collide: Behavior regulation through stimulus devaluation. Journal of Experimental Social Psychology, 44, 1013–1019. https://doi.org/10.1016/j.jesp.2008.03.004
Veling, H., Lawrence, N. S., Chen, Z., van Koningsbruggen, G. M., & Holland, R. W. (2017). What is trained during food go/no-go training? A review focusing on mechanisms and a research agenda. Current Addiction Reports, 4, 35–41. https://doi.org/10.1007/s40429-017-0131-5
Veling, H., van Koningsbruggen, G. M., Aarts, H., & Stroebe, W. (2014). Targeting impulsive processes of eating behavior via the internet: Effects on body weight. Appetite,78, 102–109. https://doi.org/10.1016/j.appet.2014.03.014
Walker, L. A., Chambers, C. D., Veling, H., & Lawrence, N. S. (2019). Cognitive and environmental interventions to encourage healthy eating: Evidence-based recommendations for public health policy. Royal Society Open Science, 6, 190624. https://doi.org/10.1098/rsos.190624
Wessel, J. R., O’Doherty, J. P., Berkebile, M. M., Linderman, D., & Aron, A. R. (2014). Stimulus devaluation induced by stopping action. Journal of Experimental Psychology: General, 143, 2316–2329. https://doi.org/10.1037/xge0000022
Appendix
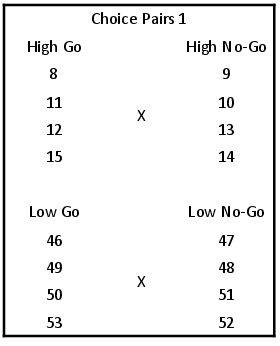
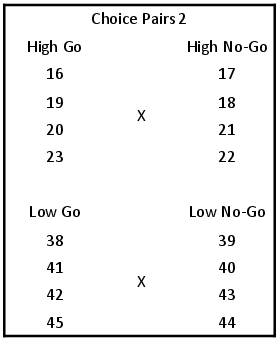
| Figure 6: Selection procedure used in Ranking and Selection. Numbers stand for the rankings. Choice pairs 1 and 2 are used as repeated choice trials or new choice trials in a counterbalanced order across participants. |
This document was translated from LATEX by
HEVEA.