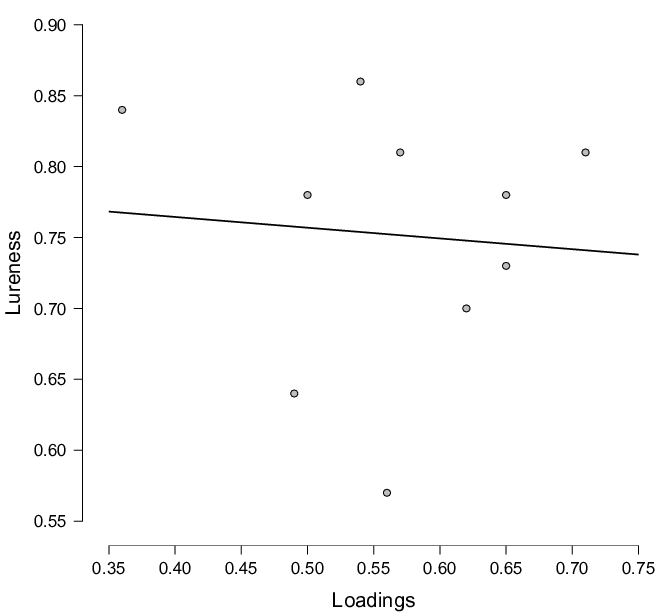
| Figure 1: Relationship between the CRT items loadings on a single CRT-BNT factor and the lureness index of items. |
Judgment and Decision Making, Vol. 15, No. 5, September 2020, pp. 741-755
A reflection on cognitive reflection – testing convergent/divergent validity of two measures of cognitive reflectionNikola Erceg* Zvonimir Galić# Mitja Ružojčić$ |
The aim of the study was to test convergent/discriminant validity of two measures of cognitive reflection, cognitive reflection test (CRT) and belief bias syllogisms (BBS) and to investigate whether their distinctive characteristic of luring participants into giving wrong intuitive responses explains their relationships with various abilities and disposition measures. Our results show that the same traits largely account for performance on both non-lure task, the Berlin Numeracy Test (BNT), and CRT and explain their correlations with other variables. These results also imply that the predictive validity of CRT for wide range of outcomes does not stem from lures. Regarding the BBS, we found that its correlations with other measures were substantially diminished once we accounted for the effects of BNT. This also implies that the lures are not the reason for the correlation between BBS and these measure. We conclude that the lures are not the reason why cognitive reflection tasks correlate with different outcomes. Our results call into question an original definition of CRT as a measure of ability or disposition to resist reporting first response that comes to mind, as well as the validity of results of studies showing “incremental validity” of CRT over numeracy.
Keywords: cognitive reflection; belief bias; lures; numeracy; convergent validity
To make a rational decision, frequently we need to take time to deliberate, question the idea that first comes to mind and reflect on the available information before deciding. This principle lead Frederick (2005) to construct a short three-item measure in which every question was designed in a way that triggers an intuitive, impulsive answer that is always incorrect. In order to resist reporting the (inaccurate) response that first comes to mind, it is presumed that a person needs to “reflect“ on it and engage in slower and more deliberate thinking that is required to realize the correct response. Because of this characteristic, the test was named the Cognitive Reflection Test (CRT). In his seminal paper, Frederick reported that for the majority of students the CRT was quite hard, in spite the fact that it requires only basic mathematical skills to be correctly solved. The CRT was also shown to be related to different measures of cognitive abilities and analytic cognitive style, but the correlations were low enough to allow the conclusion that the CRT and other used cognitive measures “likely reflect common factors, but may also measure distinct characteristics, as they purport to“ (Frederick, 2005, p. 35).
Since then, the CRT became popular among researchers because of its brevity and the fact that it was able to predict an incredibly wide range of cognitive and behavioral outcomes. Specifically, CRT has been found to predict performance on a range of tasks from the heuristics and biases (H&B) domain. For example, the CRT score was negatively correlated with susceptibility to the conjunction fallacy and conservatism in updating probabilities (Oechssler, Roider & Schmitz, 2009), and the base rate fallacy (Hoppe & Kusterer, 2011), and positively correlated with a general indicator of resilience to using mental shortcuts, as indicated with a composite of 15 different H&B tasks, including sample size problem, gambler’s fallacy, Bayesian reasoning, framing problem, sunk cost and others (Toplak, West & Stanovich, 2011). Moreover, the predictiveness of the CRT spans outside the cognitive domain. CRT was found to predict religious belief (Pennycook, Cheyne, Seli, Koehler & Fugelsang 2012; Shenhav, Rand & Greene, 2012), political orientation (Deppe et al., 2015; Pennycook & Rand, 2019), science understanding (Shtulman & McCallum, 2014, Gervais, 2015), moral reasoning (Paxton, Ungar & Greene, 2012; Royzman, Landy & Goodwin, 2014) and susceptibility to pseudo-profound bullshit statements (Pennycook, Cheyne, Barr, Koehler & Fugelsang, 2015; see Pennycook, Fugelsang & Koehler [2015] and Pennycook & Ross [2016] for a detailed account of predictiveness of the CRT across different domains).
Such breadth of the CRT bears the following question: where does this predictivity of the CRT come from? On the one hand, the CRT might be such a potent predictor because, similarly to some other non-lure measures (e.g., numeracy), it assesses different cognitive capabilities (i.e., abilities in a narrow sense, as discussed in Baron, 1985) and thinking dispositions that substantially account for performance on different tasks that the CRT predicts. For example, CRT was found to be highly correlated with “general cognitive ability” (e.g., Blacksmith, Yang, Behrend and Ruark 2019; Frederick, 2005) as well as with numerical ability (Campitelli & Gerrans, 2014; Finucane & Gullion, 2010; Liberali, Reyna, Furlan, Stein & Pardo, 2012; Primi et al., 2016; Thomson & Oppenheimer, 2016; Welsh, Burns and Delfabbro, 2013). To a certain extent, the CRT also assesses thinking dispositions, broadly defined as the tendencies towards particular patterns of intellectual behavior (Tishman & Andrade, 1996). One example is reflection/impulsivity (R/I), disposition to be careful at the expense of speed so those that are reflective are willing to sacrifice the efficiency and speed in responding in order to be more accurate (Baron, 2018; Baron, Scott, Fincher and Metz (2015); Baron, Gürçay & Metz, 2017). This view also follows from the results that show positive correlations between response time and accuracy on the CRT (e.g., Frey, Johnson & De Neys, 2017; Stupple, Pitchford, Ball, Hunt & Steel, 2017) and, in this regard, CRT might not be especially different from other tasks in which slower and more careful responding can lead to more accurate responses. Therefore, the traits that influence performance on any cognitive task that asks for both ability and deliberation (either with or without lures), might account for the predictive potency of the CRT.
On the other hand, the CRT has a distinctive characteristic of luring participants into incorrect intuitive responses that, allegedly, need to be detected and overridden in order to come up with correct response responsible. Some authors believe that this characteristic of the test should be mostly responsible for predictive potency of the CRT. In this regard, it is said that the CRT measures some additional ability or disposition, not shared with non-lure measures, to resist reporting a first response that comes to mind (Frederick, 2005), something that might be termed cognitive miserliness (Stupple et al., 2017; Toplak et al., 2011; Toplak, West & Stanovich, 2014). Thus, this additional ability or disposition could be responsible for CRT’s correlation with various outcomes.
Therefore, a key question is whether the lures make the CRT “special” or can some other, non-lure tasks predict the same outcomes to a similar degree. Several recent studies argue that the lures or the disposition to reflect and correct the intuitive wrong response are not important for the predictive power of CRT. For example, Baron et al. (2015) concluded that there is no evidence that “intuitive lures” matter at all for reliability or predictive validity of the CRT. A recent piece of evidence that the lures do not account for the predictive potency of CRT comes from a study by Attali and Bar-Hillel (2020). Across two studies, they showed that the latent CRT factor and numerical factor formed with items without lures were correlated so highly that they were practically factorially indistinguishable. Their data showed that the predictive power of the CRT items came from their quality as math items and not from their “lureness”. This result goes against the usual interpretation of CRT as a measure of some additional dispositions uniquely assessed by lures and shows that the lures are not the reason why CRT predicts performance on different cognitive tasks as well as various real life outcomes. Thus, in our study we decided to constructively replicate (Lykken, 1968) these findings using different set of CRT and well as math problems.
In our study, we investigated are the lures responsible for the correlations that the CRT has with different outcomes. To strengthen our constructive replication of Attali and Bar-Hillel (2020) study, in addition to CRT, we also used syllogisms that assess belief bias (belief bias syllogisms, BBS) as additional measure of cognitive reflection. Similarly to the CRT, BBS also trigger intuitive but incorrect response that needs to be detected and overridden in order to give a correct response. In other words, BBS items have lures but, unlike CRT, do not require participants to know math to solve them. Baron et al. (2015) showed that BBS are valid cognitive reflection items and they have been shown to predict performance on H&B tasks similarly as the CRT (West, Toplak & Stanovich, 2008). As non-lure tasks we used numeracy tasks (Cokely, Galešić, Schulz, Ghazal & Garcia-Retamero, 2012) and verbal reasoning items (Condon & Revelle, 2014).
In order to accomplish study aims we did three things. First, we correlated our lure and non-lure measures with different tasks from the H&B domain (base-rate neglect, four card selection, causal base rate, gambler’s fallacy and availability bias tasks) and a thinking disposition measure (AOT questionnaire). We chose these H&B tasks because the cognitive reflection measures should be uniquely suited for predicting them, better than the non-lure measures. This view follows from the tripartite theory of mind (Stanovich, 2012; Pennycook, Fugelsang & Koehler, 2015a) that differentiates between autonomous, algorithmic and reflective parts of the mind. The bat-and-ball CRT problem elegantly illustrates this: “A bat and a ball cost $1.10 in total. The bat costs $1 more than the ball. How much does the ball cost?“ This problem automatically triggers relatively strong initial response (i.e., 10 cents). However, after a more careful reflection, it is clear that this is an incorrect answer, and that the right response is in fact 5 cents. Thus, in order to overcome the initial wrong response (generated by the autonomous mind), and arrive to the correct one, one has to first reflect on the answer and recognize the need to engage in a more deliberate processing (the reflective mind), but also to possess adequate computational power, knowledge and abilities to calculate the right answer (algorithmic mind). Stanovich, West and Toplak (2016), in their categorization of rationality tasks according to their dependence on the conflict detection/knowledge, put both cognitive refection tasks and H&B tasks on the same high level of dependence on the conflict detection dimension. That means that both of these two types of tasks cue intuitive but incorrect responses that need to be detected and overridden (reflective mind) if the task is to be solved correctly.
Conversely, according to the tripartite theory, non-lure tasks, or the tasks that do not depend on the conflict detection (such as tests of fluid intelligence), should capture only algorithmic mind and not the dispositions towards analytic/reflective thinking that are unique to the tasks high on the conflict detection dependence (Stanovich, 2009, 2012; Pennycook, Fugelsang & Koehler, 2015). Thus, because cognitive reflection and H&B tasks have this common characteristic of triggering intuitive incorrect response and non-lure tasks do not, correlations between these two types of tasks should be greater than correlations between the non-lure and H&B tasks.
Second, we aimed to replicate Attali and Bar-Hillel (2020), who showed that one-factor model that did not differentiate between CRT items and ordinary math problems showed excellent fit to their data. They concluded that CRT items are essentially high quality math items and that the CRT’s predictive value stems from the fact that it captures, what they called, “mathematical ability” (p. 95). In other words, the CFA suggested that the fact that the CRT items have lures did not ensure that they capture different construct than the regular math problems. In the current study, we seek to constructively replicate their results with different sets of CRT and math problems. As non-lure math problems we are using The Berlin Numeracy Test (BNT; Cokely et al, 2012). This measure of statistical numeracy is particularly good test of convergent/discriminant validity of the CRT because BNT successfully predicted similar outcomes as CRT such as the ability to evaluate and understand risks (Cokely et al., 2012), maximization of expected value on monetary lotteries (Sobkow, Olszewska, & Traczyk, 2020), financial literacy (Skagerlund, Lind, Strömbäck, Tinghög & Västfjäll, 2018) and performance on some of the H&B tasks (e.g., sunk cost, framing, base rate neglect, gambler’s fallacy, etc.; Allan, 2018; Ghazal, 2014). There is also evidence that both BNT and CRT assess similar thinking dispositions related to deliberation, reflectiveness and actively open-minded thinking (Baron et al., 2015; Cokely, Feltz, Ghazal, Allan, Petrova & Garcia-Retamero, 2018; Cokely & Kelley, 2009; Ghazal, Cokely & Garcia-Retamero, 2014). Therefore, it is not surprising that several previous studies that investigated both CRT and BNT reported very high correlations between the two (e.g., Cokely et al. [2012] reported the correlation of r = .56 (disattenuated r = .93), Skagerlund et al. (2018) reported correlation of r= .61 (disattenuated r = 1) and Sobkow et al. (2020) reported correlation of r = .59 (disattenuated r = .90)). Taken together these results indicate that BNT as a non-lure math measure is well suited for a replication of Attalli and Bar-Hillel (2020) result that the CRT and non-lure math problems load on the same factor. This would be another evidence against the importance of lures in predicting various outcomes.
Finally, to make our conclusions about the importance of lures more robust and expand on Attali and Bar-Hillel findings, we tested the importance of lures for predictiveness of BBS tasks. If BBS and BNT predict H&B tasks for the same reasons (i.e., not because of lures), than the correlations between the BBS and the H&B tasks should be greatly diminished once we statistically account for the effect of BNT in these tasks.
506 undergraduate University of Zagreb students (67% Faculty of humanities and social sciences students, mostly psychology students, and the rest from various other University of Zagreb faculties), participated in the study (27% males). The mean age was 21.2 (min = 18, max = 31, SD = 2.13).
We used two different measures of cognitive reflection, the numerical one that required certain levels of mathematical skills to come to the correct responses and the verbal one and BBS that do not require any mathematical knowledge.
We used an expanded, 10-item version of the CRT in order to increase reliability and response range of the total score. It consisted of three original CRT items (Frederick, 2005), but also additional items from previously reported alternative CRT measures (Primi et al., 2015; Thomson & Oppenheimer, 2016; Toplak et al., 2014). An example of an item is “In an athletics team, tall members are three times more likely to win a medal than short members. This year, the team has won 60 medals so far. How many of these have been won by short athletes?”. Here, the intuitive incorrect answer is 20 and the correct one is 15. All the items are listed in the Appendix. Total score was calculated by summing the correct responses, thus one could score anywhere between 0 (if none of the responses were correct) and 10 (if all the responses were correct).
BBS tasks assess the cognitive reflection by examining the susceptibility to belief bias. An example task goes as follows: “Premise 1: All flowers have petals. Premise 2: Roses have petals. Conclusion: Roses are flowers.” (Markovits & Nantel, 1989). According to this syllogism, it does not follow that only flowers have petals, so roses might as well be something other than flowers (e.g., children collage art). However, because the conclusion that roses are flowers conforms with our empirical reality, it is quite believable and many people accept it as valid. Thus, the false intuitive response is the product of believability of the conclusion, while strong conformity with logical principles is needed to come up with the right, logically valid response. In addition to the “Roses have petals” example we used three additional syllogisms whose conclusions were believable, albeit logically incorrect (see Appendix for all the tasks). We considered as correct the response where participants identified believable conclusion as logically incorrect. Participants’ scores ranged between 0 and 4.
We used The Berlin numeracy test (BNT; Cokely et al., 2012) as a measure of numeracy. The BNT is a four-question test for assessing numeracy and risk literacy. An example of a question is “Imagine we are throwing a five-sided die 50 times. On average, out of these 50 throws how many times would this five-sided die show an odd number (1, 3 or 5)?”. The questions are designed in a way that they gradually become harder and a total score is calculated by summing up the correct responses on the four questions (see Appendix for all the items).
Verbal Reasoning (VR) was measured with four items taken from the International Cognitive Ability Resource (ICAR; for details see http://icar-project.com and Condon & Revelle, 2014). VR items include different logic, vocabulary and general knowledge questions. All of the items are presented in Appendix A.
In this study we used a 15-item AOT scale introduced by Campitelli and Gerrans (2014) as a measure of thinking disposition. It is a self-report scale where participants indicate their level of agreement with the items on a six-point scale (1 – strongly disagree to 6 – strongly agree). An example of an item is “It is OK to ignore evidence against your established beliefs” (see Appendix A). The total score on this scale is calculated as a mean level of agreement with the items and can be anything between 1 and 6.
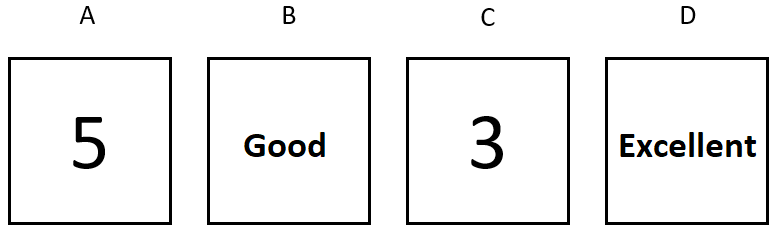
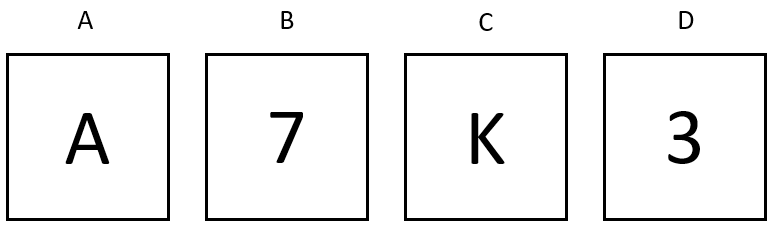
We used five different tasks that had the same structure (all of the items are presented in the Appendix). A rule was explicitly stated for each of the items and participants were informed that the rule may or may not be correct. Their task was to check the accuracy of the rule by turning two cards of their choice. For example, one of the items was: “Rule: If a card shows “5” on one side, the word “Excellent” is on the opposite side. Which two cards would you choose to turn to check the accuracy of this rule?”. Participants then saw four cards that had numbers 5 and 3 and words “Excellent” and “Good” written on the front side. The correct answer here would be to turn the card containing number 5 and word “Good” because turning only these two cards would allow one to conclude whether the rule is correct or false. However, because the card with word “Excellent” is present, participants could be lured to turn it instead of the card “Good”, although for the rule to be correct it does not matter what is behind the “Excellent” and “3” cards (Nickerson, 1998). Picking the two accurate cards to turn would be scored as 1 so the minimum score on this task was 0 while the maximum was 5.
Base-rate neglect task consisted of five similar problems where the description of a person was contrasted to the base-rate information. Specifically, there were two possible answers, a stereotypical one (based on the description of a person) and a base-rate consistent one. For example, one of the items was: “Among the 1000 people that participated in the study, there were 50 16-year-olds and 950 50-year-olds. Helen is randomly chosen participant in this research. Helen listens to hip hop and rap music. She likes to wear tight T-shirts and jeans. She loves to dance and has a small nose piercing. Which is more likely? a) Helen is 16 years old; or b) Helen is 50 years old.”
Here, the description of Helen was stereotypical for a teenager. Thus, a person who heavily relies on this information would respond with an “a”. However, a base-rate information indicated that there is much greater probability that randomly chosen participant is indeed a 50 years old. Thus, a response “b” was coded as a correct one. However, it has to be noted that technically this does not have to be a correct response and that this depends on the diagnosticity of the information in the task (i.e., the information could be that Helen is a minor which would render a base-rate based response incorrect1). Nevertheless, as the stereotypical response is intuitive on these tasks and one needs to engage in correcting this intuitive response in order to incorporate base-rate information into a judgment (Barbey & Sloman, 2007; Pennycook, Fugelsang & Koehler, 2012), we always coded a response based on base-rates as a correct one. The correct responses were scored as 1 and the theoretical range of scores was 0 to 5.
In the causal base-rate, participants are provided with two conflicting pieces of information: one is statistical and favors one decision while another is based on personal, case-based experience and favors another decision (Toplak et al., 2011; Stanovich et al., 2016). We present one of the items we used here, and report all three in the Appendix:
Professor Kellan, the director of a teacher preparation program, was designing a new course in human development and needed to select a textbook for the new course. She had narrowed her decision down to one of two textbooks: one published by Pearson and the other published by McGraw. Professor Kellan belonged to several professional organizations that provided Web-based forums for its members to share information about curricular issues. Each of the forums had a textbook evaluation section, and the websites unanimously rated the McGraw textbook as the better choice in every category rated. Categories evaluated included quality of the writing, among others. Just before Professor Kellan was about to place the order for the McGraw book, however, she asked an experienced colleague for her opinion about the textbooks. Her colleague reported that she preferred the Pearson book. What do you think Professor Kellan should do?
- a. She should definitely use the Pearson textbook;
- b. She should probably use the Pearson textbook;
- c. She should probably use the McGraw textbook;
- d. She should definitely use the McGraw textbook.
Here preference for the McGraw textbook indicates a tendency to rely on the large-sample information in spite of salient personal testimony. A preference for the Pearson textbook indicates reliance on the personal testimony over the large-sample information. Each item was scored one to four. In this case, one point is given if a participant thinks that a) She should definitely use the Pearson textbook while four points are given if participant thinks that d) She should definitely use the McGraw textbook.
Gambler’s fallacy refers to the tendency for people to see links between events in the past and events in the future when the two are really independent (Stanovich et al., 2016). Consider the following problem which is one of the five we used (see Appendix for all the problems):
When playing slot machines, people win something about 1 in every 10 times. Julie, however, has just won on her first three plays. What are her chances of winning the next time she plays?
____ out of ____.
Here the correct answer is 1 out of 10 (it was scored as 1, while all the other responses were scored as 0). However, people that are prone to gambler’s fallacy would reason that, since Julia already won three times in a row, her probability of winning again would somehow need to be lower than 1 in 10. This does not make sense as slot machine does not remember Julia’s previous outcomes and always presents outcomes with the same 1/10 probability. We measure the gambler’s fallacy with five items. We scored correct responses as 1 and incorrect as 0, so the theoretical range of results was 0 to 5.
The availability heuristic refers to assessing the frequency of a class or the probability of an event by the ease with which instances or occurrences can be brought to mind (Tversky & Kahneman, 1973). Availability or the ease of retrieval certain instances of events is often influenced by the vividness or media exposure and does not necessarily correspond to the true frequency of such instances. For example, people might think that homicide is much more common cause of death than the diabetes (it is the opposite; this was one of our questions) because homicides are often covered in media while diabetes complications and deaths are rarely discussed publicly. In this study, we followed a paradigm introduced by Lichtenstein, Slovic, Fischhoff, Layman and Combs (1978), by asking participants which of the four pairs of lethal events is more common. Choosing causes of death that are more vivid and more covered in media is a sign of over-reliance on easily available and retrievable information (Pachur, Hertwig & Steinmann, 2012; Stanovich et al., 2016). Thus, we refer to responses that follow from the availability heuristic even in situations when this does not correspond to reality as the availability bias. We scored the correct responses as 1 and incorrect (based on the availability heuristic) as 0. Thus, the score ranged from 0 (greatest availability bias) to 4 (lowest availability bias).
Table 1: Descriptive statistics and correlations among all the variables. The G6 reliabilities are shown in the diagonal, bivariate correlations are below the diagonal, correlations between the latent factors are above the diagonal.
M SD Min Max CRT BBS BNT VR AOT BRN FCS CBR GF AV CRT 5.59 2.91 0 10 .92 .66 .93 .77 .26 .35 .34 .35 .04 .19 BBS 2.10 1.62 0 4 .55** .93 .68 .54 .32 .33 .25 .30 -.04 .13 BNT 1.56 1.12 0 4 .58** .42** .61 .80 .26 .41 .20 .41 -.03 .28 VR 3.50 0.81 0 4 .46** .33** .36** .64 .22 .27 .30 .40 .17 .45 AOT 4.51 0.65 1.87 6 .22** .28** .17** .14** .83 .26 .21 .23 .25 .18 BRN 2.71 1.86 0 5 .30** .30** .26** .15* .25** .92 .25 .40 .27 .20 FCS 1.53 1.48 0 5 .28** .22** .14* .19** .19** .22** .86 .22 -.08 .14 CBR 8.88 1.52 4 12 .22** .20** .19** .17** .16* .28** .12* .45 -.01 .40 GF 4.09 1.04 0 5 .05 -.03 -.01 .11 .20** .20** -.04 -.01 .76 .16 AV 2.72 1.19 0 4 .11 .11 .14* .13* .11 .19** .12 .23** .03 .79 Note. * p< .05, * p < .01; CRT – Cognitive reflection test; BBS – belief bias syllogisms; BNT – Berlin numeracy testy; VR – verbal reasoning; AOT – actively open-minded thinking; BRN = base-rate neglect; FCS – four cards selection task; CBR – causal base-rate; GF – gambler’s fallacy; AV – availability bias.
Participants solved all the tasks as a part of a larger data collection effort in which they also solved a number of additional tasks that were not part of the current study. The regular and verbal CRT items were presented in four fixed, but different sequences and these sequences were randomly distributed across participants. All the other instruments were solved in fixed order. The students filled-in the tests and questionnaires on computers, in groups of 20 to 25 participants under the supervision of the investigators. Participants were reimbursed with course credits and/or cinema card vouchers. The whole testing session lasted up to two hours with a break of 10 to 15 minutes in the middle of a session. Upon reaching half of our planned sample (N = 253) we changed some of the measures and added some additional measures, mostly related to H&B tasks. This is why all the analyses involving H&B tasks are done on the remaining half of the sample (N = 253).
To answer our first question, whether the tasks with lures exhibit greater correlations with H&B and thinking disposition tasks than our non-lure tasks, we calculated correlation coefficients among all our variables. We report these correlations along with descriptive statistics and G6 reliability coefficient in Table 1.
In order to estimate the relationships among the variables while accounting for the measurement error, we calculated the correlations between the latent factors and reported them in the upper part of the Table 1, above the diagonal. Prior to that, we made sure that a one-factor structure fits each of our instruments well and that all of the items load sufficiently on their respective factors. We report the details of the analyses and fit indices for each of the factors in Appendix B. In short, for each of the factors, a one-factor solution proved to be a very good fit. Most of the loadings were much higher than .30, in fact only three of the total number of loadings did not pass this cut-off: a) on VR factor, the first item had loading lower than .30; b) on GF factor, first variable had loading lower than .30; c) on AV factor, first item had loading lower than .30. Thus, we can conclude that majority of our items are appropriate manifest indicators of their respective latent factors and that it is appropriate to do further analyses on these factors.
By looking at the upper part of the correlation table, two things are apparent. First, CRT and BNT factors correlate so highly (r = .93) that it appears that these two factors are empirically indistinguishable. Second, both our lure (CRT and BBS) and non-lure measures (BNT and VR) show moderate to high correlations with thinking disposition and most of the H&B measures. In fact, the correlations of CRT and BNT factors with H&B factors are remarkably similar, and it does not appear that our data support the expectation that the lure measures are related more with H&B tasks than the non-lure measures. In fact, BNT factor correlated more strongly with three H&B factors (BRN, CBR and AV factors) than either CRT (test for differences in correlations: z = 2.75; p = .00 for BRN and CBR; z = 5.56, p = .00 for AV) or BBS factor (z = 1.73, p = .04 for BRN; z = 2.36, p = .01 for CBR; z = 4.32, p = .00 for AV). The CRT factor did not even correlate higher than BNT with the other measure of cognitive reflection (i.e., BBS), even though the two are allegedly measuring the same ability/disposition to resist reporting initial, intuitive responses. The only case that a lure measure correlated more than BNT with an outcome was of the CRT-FCS correlation (z = 6.17; p = .00). However, even here this correlation did not surpass the correlation between VR factor (another non-lure measure) and FCS (z = 0.99, p = .16). Thus, judging from the correlation matrix, it does not seem that the lures gave either CRT or BBS additional predictive power over the non-lure measures.
Figure 1: Relationship between the CRT items loadings on a single CRT-BNT factor and the lureness index of items.
In the next two analyses, we investigated whether the CRT and BNT are factorially indistinguishable and whether the lures are responsible for the correlations between BBS and H&B tasks. Specifically, if BBS predicts H&B tasks for the same reason BNT predicts them (i.e., because the abilities and thinking dispositions not related to lures that are important for all three types of tasks and the lures are not so important), then the correlation between the BBS and the H&B tasks should be greatly diminished once we statistically account for the effect of BNT in these tasks. To assess these parameters free from error and to control for the Type 1 errors, we used CFA and SEM methods (Westfall & Yarkoni, 2016).
To test whether the CRT and BNT are factorialy distinguishable, we compared a model where the correlation between the latent CRT factor and latent BNT factor was freely estimated with the one where the correlation was fixed at 1 (meaning that both CRT and BNT items loaded on a single factor). Both models showed excellent fit to the data (χ2(76) = 57.07, p = .95; CFI = 1; TLI = 1; RMSEA = .00 for the two correlated factors model and χ2(77) = 58.61, p = .94; CFI = .1; TLI = .1; RMSEA = .00 for the one factor model). There was no significant differences in the fit between the models, indicating that the latent factor of cognitive reflection is practically indistinguishable from the latent factor of numeracy (Δ χ2(1) = 1.54, p = .22). To check whether the CRT items factor loadings on this single factor are related with lureness of the items, we calculated the correlation between the loadings and the lureness index, the proportion of errors that were lures. We calculated the lureness index for each of the items as a proportion of intuitive responses in all incorrect responses on that specific item (we report the Lureness of each of CRT items in Appendix C). The relationship between the loadings and the lureness is pictured in the Figure 1 from which it is clear that the lures are not the reason why the items loaded on single CRT-BNT factor that fitted the data best (r = -.08, p = .82).
To further strengthen our findings, we explored how mathematical models developed by Campitelli and Gerrans (2014) to assess CRTs construct validity fitted to our data. In short, Campitelli and Gerrans developed three models which they called mathematical ability model (MATH), rational thinking model (RAT) and thinking disposition model (DISP). The first MATH model assumes that the CRT measures only mathematical ability and is equivalent to a regression analysis in which CRT performance is predicted only by the score in the numeracy test. The RAT and DISP models assume that the CRT, in addition to mathematical ability, also measures rational thinking (assessed by BBS) and the thinking disposition of AOT. Campitelli and Gerrans (2014) concluded that the “analyses provided very strong evidence (BIC difference > 10) in favor of RAT and DISP over MATH and that, “therefore, CRT is not just another numeracy test” (p. 441). On the contrary, and in accordance with our findings that the CRT and BNT are factorially indistinguishable, our analyses showed that the MATH model fitted our data better than the RAT and DISP models (BIC (math) = 3993.49; BIC (rat) = 4001.26; BIC (disp) = 4345.35). Therefore, it seems that the CRT scores are best explained by the same dimention that explains the BNT scores.
The finding that the traits that the CRT shares with non-lure BNT tasks explain all the variance in the CRT tasks indicates that the lures are not essential for the predictive power of the CRT. These results replicate the results of Attali and Bar-Hillel, although their explanation that CRT measures “numerical ability” seems too narrow, as we believe that both CRT and BNT also capture different thinking dispositions that might even be more important for their predictive power than the “pure” mathematical ability.
As BBS are not math tasks, it did not make sense repeating the same analysis that we did on CRT, i.e., checking whether BNT and BBS are factorially indistinguishable. Therefore, we conducted a different analysis that helped us answer the question of lure importance for (supposedly) cognitive reflection measures. We wanted to see to what degree will accounting for the effects on BNT in BBS and H&B tasks using SEM affect the correlations between the BBS and H&B factors. In order to do that, we specified a model in which a BNT factor was regressed on each of the BBS and H&B factors, and left residual variance in the factors free to co-vary. The results showed that, when the effects of BNT were accounted for in this way, all of the correlations between BBS factor, H&B factors and AOT factors substantially decreased and ceased to be significant (for BRN from r = .33 to r = .01; for FCS from r = .25 to r = .09; for CBR from r = .30 to r = .03; for AV from r = .13 to r = -.03; for AOT from r = .32 to r = .14). Judging from these results, it seems that the BBS correlates with different outcomes mostly for the same reasons that the non-lure BNT correlates with these same outcomes. Again, as for CRT, the most plausible conclusion seems to be that the lures are not crucial for the predictiveness of the BBS.
Our study represents a test of convergent/discriminant validity of CRT and BBS, two types of tasks that are supposed to capture the cognitive reflection construct. More specifically, we wanted to explore whether their unique characteristic of cuing a strong intuitively appealing, but wrong, response is responsible for their correlations with different H&B tasks and thinking dispositions. We did this in several different ways. First, we compared the correlation coefficients between our two cognitive reflection measures with lures (CRT and BBS) and H&B tasks with the correlations between our non-lure tasks and H&B tasks. These correlations were either the same or our non-lure BNT task was correlated more strongly with H&B tasks. Second, we tested whether the CRT and BNT are factorially indistinguishable by comparing a two-factor model (CRT and BNT items load on separate factors that are allowed to correlated) with a one-factor model (CRT and BNT items load on the same factor). The two-factor model did not show better fit than the one-factor model, meaning that the same underlying trait probably affected both CRT and BNT performance. Third, using Campitelli and Gerrans (2014) formula, we tested a model that presumes that the CRT responses depend only on numeracy against the models that they, in addition to numeracy, also depend on rational thinking skills and thinking dispositions. The first model described out data the best. Numeracy was the only relevant predictor of the CRT responses, rational thinking (operationalized as BBS result) and thinking dispositions (operationalized as AOT result) did not contribute over numeracy. Fourth, in order to see whether the lures are making the CRT items “good” items, we correlated the lureness index of the CRT items with their respective loadings on a one CRT – BNT factor. These were not correlated meaning that whatever traits the CRT and BNT have in common, the lures are not responsible for it. Finally, we checked whether the correlations between the BBS and outcomes (H&B tasks and AOT) would be diminished when we statistically account for the effects of BNT on BBS, H&B tasks and AOT. All of the correlations were substantially smaller meaning that the BBS correlate with H&B tasks and AOT mostly for the same reasons that the BNT correlates with them. This represented another piece of evidence that the correlations between BBS and outcomes largely do not depend on the lures.
Our findings showed that essentially all the valid variance in the CRT was explained by the numeracy factor as the same traits that influence performance on the non-lure numerical problems also influence performance on the CRT tasks with lures. Thus, for whatever reasons CRT predicts a wide range of outcomes described in the introduction, it has probably little to do with the lures. The characteristic that made the CRT items famous, ability to trigger false intuitive responses, seems not to be the test’s characteristic responsible for its predictive validity. Performance on the CRT tasks predicts outcomes because these are good math tasks, not because these tasks require suppression of the initial wrong response. One implication of these results is that different studies that utilized regression analysis to conclude that the incremental validity of CRT over numeracy stems from lures (e.g., Barr, Pennycook, Stolz & Fugelsang, 2015a,b; Liberali et al., 2012; Pennycook, Cheyne, Barr, Koehler & Fugelsang, 2014; Trippas, Pennycook, Verde & Handley, 2015) might be due to a) narrow measures of numeracy that did not capture complete range of the disposition (at least not to the extent that BNT does), b) low reliability of numeracy and CRT measures making both measures imperfect and incomplete measure of the numeracy construct (see Baron, et al., 2017 for a discussion about statistical control), or c) Type 1 error characteristic of this kind of regression analysis (Westfall & Yarkoni, 2016).
However, the key question is which abilities and/or dispositions account for performance on math tasks, whether the lure or the non-lure ones. Attali and Bar-Hillel (2020) call these traits “mathematical ability”. Although they do not mean to imply that the traits affecting CRT and BNT responses are abilities in a narrow sense of capabilities free from certain thinking dispositions, nevertheless this does sound a bit narrow. Therefore, we would argue (along with a lot of other authors, i.e. Baron et al., 2015; Cokely and Kelley, 2009; Ghazal et al., 2014) that, in addition to mathematical ability in a narrow sense, some thinking dispositions must play role in the CRT and BNT performance and account for their correlations with different outcomes. Our finding that non-math task (BBS) correlates with different outcomes for the same reasons as the math task (BNT) implies that BNT (and consequently CRT) does not correlate with these outcomes only because it assesses mathematical ability that might account for these correlations. Instead, at least one disposition could account for BBS and BNT correlations with different outcomes. This disposition might be reflective and careful approach to cognitive tasks that includes taking more time in order to be more accurate, a disposition referred to as R/I (Baron, 2018; Baron et al., 2015; Baron et al., 2017). In their protocol analysis of decision making under risk, Cokely and Kelley (2009) found that both CRT and numeracy predicted higher number of verbalized considerations on risk decision-making tasks and number of considerations was further related both to the number of normative correct responses and to the response times. The authors concluded that CRT and numeracy are associated with more careful, thorough, and elaborate cognition. In line with this are the findings that there is sometimes a positive correlation between CRT score and CRT response time (e.g., Baron et al., 2015; Stupple et al., 2017), as well as that participants that scored higher on BNT performed better on various tasks (lotteries, intertemporal choice, denominator neglect, and confidence judgments) because they deliberated more during decision making and, in that way, more accurately evaluated their judgments (Ghazal et al., 2014).
In sum, we can conclude that our results thus replicate Attali and Bar-Hillel (2020) findings that all the systematic variance in the numerical CRT can be explained by “the math factor” where this factor is influenced both by math ability and thinking dispositions (such as R/I). What seems to be clear from this, as well as several previous studies (Attali & Bar-Hillel, 2020; Baron et al., 2015) is that the lures are not essential for the predictive validity of cognitive reflection measures. In other words, our findings indicate that what supposed to be a cognitive reflection test does not capture the ability or disposition to resist reporting the response that first comes to mind (Frederick, 2005) but rather a stable characteristic to be careful and reflective from the start. In this regard it is similar to many of the others cognitive tests that allow participants to sacrifice speed for accuracy. We also tried to expand on Attali and Bar-Hillel results by examining BBS as another measure of cognitive reflection. Similarly as for the CRT, our results indicate that the lures do not play important role in correlations between BBS and other tasks. Thus, we doubt that either of cognitive reflection measures actually measure cognitive reflection as defined by Frederick (2005).
The conclusions of the current study are qualified by several facts. First, as mentioned before, our sample consisted of college students that are on average more intelligent, numerate and open-minded than the general public. In this particular case, this fact can be relevant. Namely, at least some of the college students could have ample experience with basic mathematical operations that are required to successfully solve CRT items and through their education they could have lots of opportunities to train their skills. This means that some of the college students might have developed good mathematical intuitions that allow them to do basic mathematical operations swiftly and almost intuitively. It is also in line with the “hybrid” dual-process model that posits that not only incorrect but also correct responses can be intuitively cued and with greater probability among those more experienced in particular task (De Neys, 2017). However, this could in turn mean that the effect of deliberation and reflection on accuracy in solving CRT tasks would be diminished in our sample. The other significant drawback of the study is the fact that the sample on which we calculated our correlations between our (non)lure tasks and H&B tasks was halved. This could mean that the parameters are estimated with lesser precision.
CRT is deemed to be a specific measure of cognitive reflection defined as the ability or disposition to resist reporting first response that comes to mind because of its ability to cue intuitive but incorrect responses that need to be detected and overturned in order to produce a correct response. However, it seems that neither the CRT nor BBS as another cognitive reflection measure capture cognitive reflection conceptualized in this way. This conclusion follows from the fact that, in our study, the same traits that accounted for performance on the non-lure cognitive task (those that do not cue intuitive incorrect response) completely accounted for performance on the CRT. This means that the lures do not capture any additional disposition not captured by numerical non-lure tasks and, thus, that they do not account for the broad predictive ability of the CRT. Similarly to the CRT, the lures do not appear to be especially important for the predictive ability of BBS as its correlations with various outcomes were substantially diminished once the effect of non-lure task (BNT) was statistically accounted for in a SEM regression. We believe that cognitive reflection measures capture some basic cognitive capabilities and thinking dispositions that allow them to correlate with such a wide variety of tasks as well as real life outcomes.
Allan, J. N. (2018). Numeracy vs. intelligence: A model of the relationship between cognitive abilities and decision making. (Master’s thesis, University of Oklahoma, Norman, USA). Retrieved from https://hdl.handle.net/11244/299906.
Attali, Y., & Bar-Hillel, M. (2020). The false allure of fast lures. Judgment & Decision Making, 15(1), 93–111.
Barbey, A. K., & Sloman, S. A. (2007). Base-rate respect: From ecological rationality to dual processes. Behavioral and Brain Sciences, 30(3), 241–254.
Baron, J. (1985). Rationality and intelligence. New York: Cambridge University Press
Baron, J. (2018). Individual Mental Abilities vs. the World’s Problems. Journal of Intelligence, 6(2), 23.
Baron, J., Gürçay, B., & Metz, S. E. (2017). Reflection, intuition, and actively open-minded thinking. In M. Toplak & J. Weller (Eds.), Individual differences in judgment and decision making: A developmental perspective. Psychology Press.
Baron, J., Scott, S., Fincher, K., & Metz, S. E. (2015). Why does the Cognitive Reflection Test (sometimes) predict utilitarian moral judgment (and other things)?. Journal of Applied Research in Memory and Cognition, 4(3), 265–284.
Barr, N., Pennycook, G., Stolz, J. A., & Fugelsang, J. A. (2015a). Reasoned connections: A dual-process perspective on creative thought. Thinking & Reasoning, 21(1), 61–75.
Barr, N., Pennycook, G., Stolz, J. A., & Fugelsang, J. A. (2015b). The brain in your pocket: Evidence that Smartphones are used to supplant thinking. Computers in Human Behavior, 48, 473–480.
Blacksmith, N., Yang, Y., Behrend, T. S., & Ruark, G. A. (2019). Assessing the validity of inferences from scores on the cognitive reflection test. Journal of Behavioral Decision Making. 1-14.
Campitelli, G., & Gerrans, P. (2014). Does the cognitive reflection test measure cognitive reflection? A mathematical modeling approach. Memory & cognition, 42(3), 434–447.
Cokely, E. T., Feltz, A., Ghazal, S., Allan, J. N., Petrova, D., & Garcia-Retamero, R. (2018). Skilled decision theory: From intelligence to numeracy and expertise. In K. A. Ericsson, R. R. Hoffman, A. Kozbelt, & A. M. Williams (Eds.), Cambridge handbooks in psychology. The Cambridge handbook of expertise and expert performance (p. 476–505). Cambridge University Press.
Cokely, E.T., Galesic, M., Schulz, E., Ghazal, S., & Garcia-Retamero, R. (2012). Measuring risk literacy: The Berlin Numeracy Test. Judgment and Decision Making, 7, 25–47.
Cokely, E. T., & Kelley, C. M. (2009). Cognitive abilities and superior decision making under risk: A protocol analysis and process model evaluation. Judgment and Decision Making, 4(1), 20–33.
Condon, D. M., & Revelle, W. (2014). The International Cognitive Ability Resource: Development and initial validation of a public-domain measure. Intelligence, 43, 52–64.
De Neys, W. (2017). Bias, conflict, and fast logic: Towards a hybrid dual process future? In W. De Neys (Ed.), Dual Process Theory 2.0 (pp. 47–65). Oxon, UK: Routledge.
Deppe, K. D., Gonzalez, F. J., Neiman, J. L., Jacobs, C., Pahlke, J., Smith, K. B., & Hibbing, J. R. (2015). Reflective liberals and intuitive conservatives: A look at the Cognitive Reflection Test and ideology. Judgment & Decision Making, 10(4), 314–331.
Finucane, M. L., & Gullion, C. M. (2010). Developing a tool for measuring the decision-making competence of older adults. Psychology and Aging, 25(2), 271–288.
Frederick, S. (2005). Cognitive reflection and decision making. Journal of Economic perspectives, 19(4), 25–42.
Frey, D., Johnson, E. D., & De Neys, W. (2017). Individual differences in conflict detection during reasoning. The Quarterly Journal of Experimental Psychology, 71(5):1188-1208.
Gervais, W. M. (2015). Override the controversy: Analytic thinking predicts endorsement of evolution. Cognition, 142, 312–321.
Ghazal, S. (2014). Component numeracy skills and decision making. (Doctoral dissertation, Michigan Technological University, Houghton, USA). Retrieved from https://digitalcommons.mtu.edu/cgi/viewcontent.cgi?article=1964&context=etds.
Ghazal, S., Cokely, E. T., & Garcia-Retamero, R. (2014). Predicting biases in very highly educated samples: Numeracy and metacognition. Judgment and Decision Daking, 9(1), 15–34.
Hoppe, E. I., & Kusterer, D. J. (2011). Behavioral biases and cognitive reflection. Economics Letters, 110(2), 97–100.
Liberali, J. M., Reyna, V. F., Furlan, S., Stein, L. M., & Pardo, S. T. (2012). Individual differences in numeracy and cognitive reflection, with implications for biases and fallacies in probability judgment. Journal of Behavioral Decision Making, 25(4), 361–381.
Lichtenstein, S., Slovic, P., Fischhoff, B., Layman, M., & Combs, B. (1978). Judged frequency of lethal events. Journal of Experimental Psychology: Human Learning and Memory, 4(6), 551–578.
Lykken, D. T. (1968). Statistical significance in psychological research. Psychological Bulletin, 70(3p1), 151-159.
Markovits, H., & Nantel, G. (1989). The belief-bias effect in the production and evaluation of logical conclusions. Memory & Cognition, 17(1), 11–17.
Nickerson, R. S. (1998). Confirmation bias: A ubiquitous phenomenon in many guises. Review of General Psychology, 2(2), 175–220.
Oechssler, J., Roider, A., & Schmitz, P. W. (2009). Cognitive abilities and behavioral biases. Journal of Economic Behavior & Organization, 72(1), 147–152.
Pachur, T., Hertwig, R., & Steinmann, F. (2012). How do people judge risks: availability heuristic, affect heuristic, or both?. Journal of Experimental Psychology: Applied, 18(3), 314–330.
Paxton, J. M., Ungar, L., & Greene, J. D. (2012). Reflection and reasoning in moral judgment. Cognitive Science, 36(1), 163–177.
Pennycook, G., Cheyne, J. A., Barr, N., Koehler, D. J., & Fugelsang, J. A. (2014). The role of analytic thinking in moral judgements and values. Thinking & Reasoning, 20(2), 188–214.
Pennycook, G., Cheyne, J. A., Barr, N., Koehler, D. J., & Fugelsang, J. A. (2015). On the reception and detection of pseudo-profound bullshit. Judgment and Decision making. 10(6), 549–563
Pennycook, G., Cheyne, J. A., Koehler, D. J., & Fugelsang, J. A. (2015a). Is the cognitive reflection test a measure of both reflection and intuition?. Behavior Research Methods, 48(1), 341–348.
Pennycook, G., Cheyne, J. A., Seli, P., Koehler, D. J., & Fugelsang, J. A. (2012). Analytic cognitive style predicts religious and paranormal belief. Cognition, 123(3), 335–346.
Pennycook, G., Fugelsang, J. A., & Koehler, D. J. (2012). Are we good at detecting conflict during reasoning?. Cognition, 124(1), 101–106.
Pennycook, G., Fugelsang, J. A., & Koehler, D. J. (2015). Everyday consequences of analytic thinking. Current Directions in Psychological Science, 24(6), 425–432.
Pennycook, G., Fugelsang, J. A., & Koehler, D. J. (2015a). What makes us think? A three-stage dual-process model of analytic engagement. Cognitive Psychology, 80, 34–72.
Pennycook, G., & Rand, D. G. (2019). Cognitive reflection and the 2016 US Presidential election. Personality and Social Psychology Bulletin, 45(2), 224–239.
Pennycook, G., & Ross, R. M. (2016). Commentary: Cognitive reflection vs. calculation in decision making. Frontiers in Psychology, 7, 9.
Primi, C., Morsanyi, K., Chiesi, F., Donati, M. A., & Hamilton, J. (2016). The development and testing of a new version of the cognitive reflection test applying item response theory (IRT). Journal of Behavioral Decision Making, 29(5), 453–469.
Royzman, E. B., Landy, J. F., & Goodwin, G. P. (2014). Are good reasoners more incest-friendly? Trait cognitive reflection predicts selective moralization in a sample of American adults. Judgment and Decision Making, 9(3), 176–190.
Shenhav, A., Rand, D. G., & Greene, J. D. (2012). Divine intuition: Cognitive style influences belief in God. Journal of Experimental Psychology: General, 141(3), 423–428.
Shtulman, A., & McCallum, K. (2014). Cognitive reflection predicts science understanding. In Proceedings of the Annual Meeting of the Cognitive Science Society (Vol. 36, No. 36).
Skagerlund, K., Lind, T., Strömbäck, C., Tinghög, G., & Västfjäll, D. (2018). Financial literacy and the role of numeracy–How individuals’ attitude and affinity with numbers influence financial literacy. Journal of Behavioral and Experimental Economics, 74, 18–25.
Sobkow, A., Olszewska, A., & Traczyk, J. (2020). Multiple numeric competencies predict decision outcomes beyond fluid intelligence and cognitive reflection. Intelligence, 80, 101452.
Stanovich K. E. (2009). Rational and irrational thought: The thinking that IQ tests miss. Scientific American Mind, 20(6), 34–39.
Stanovich, K. E. (2012). On the distinction between rationality and intelligence: Implications for understanding individual differences in reasoning. In K. J. Holyoak & R. G. Morrison (Eds.), Oxford library of psychology. The Oxford handbook of thinking and reasoning (pp. 433–455). Oxford University Press.
Stanovich, K. E., West, R. F., & Toplak, M. E. (2016). The rationality quotient: Toward a test of rational thinking. MIT press.
Stupple, E. J., Pitchford, M., Ball, L. J., Hunt, T. E., & Steel, R. (2017). Slower is not always better: Response-time evidence clarifies the limited role of miserly information processing in the Cognitive Reflection Test. PloS one, 12(11), e0186404.
Thomson, K. S., & Oppenheimer, D. M. (2016). Investigating an alternate form of the cognitive reflection test. Judgment and Decision making, 11(1), 99.
Tishman, S., & Andrade, A. (1996). Thinking dispositions: A review of current theories, practices, and issues. Cambridge, MA. Project Zero, Harvard University.
Toplak, M. E., West, R. F., & Stanovich, K. E. (2011). The Cognitive Reflection Test as a predictor of performance on heuristics-and-biases tasks. Memory & cognition, 39(7), 1275–1289.
Toplak, M. E., West, R. F., & Stanovich, K. E. (2014). Assessing miserly information processing: An expansion of the Cognitive Reflection Test. Thinking & Reasoning, 20(2), 147–168.
Trippas, D., Pennycook, G., Verde, M. F., & Handley, S. J. (2015). Better but still biased: Analytic cognitive style and belief bias. Thinking & Reasoning, 21(4), 431–445.
Tversky, A., & Kahneman, D. (1973). Availability: A heuristic for judging frequency and probability. Cognitive psychology, 5(2), 207–232.
Welsh, M., Burns, N., & Delfabbro, P. (2013). The cognitive reflection test: How much more than numerical ability?. In Proceedings of the Annual Meeting of the Cognitive Science Society (Vol. 35, No. 35).
West, R. F., Toplak, M. E., & Stanovich, K. E. (2008). Heuristics and biases as measures of critical thinking: Associations with cognitive ability and thinking dispositions. Journal of Educational Psychology, 100(4), 930–941.
Westfall, J., & Yarkoni, T. (2016). Statistically controlling for confounding constructs is harder than you think. PloS one, 11(3), e0152719.
(all are believable, but logically incorrect)
* Todorić is a well-known Croatian rich businessman
Verbal reasoning
2; 3; 4; 5 (correct); 6; 7.
35; 39; 44; 47 (correct); 53; 57.
Friday; Monday; Wednesday; Saturday; Tuesday; Sunday (correct).
The cards you see in front of you are printed on both sides. The content of the cards is determined by some rule. In this task, a rule is proposed to determine the content of these cards. However, this rule may or may not be correct.
To find out if this rule is correct or not, we give you the opportunity to turn two cards and see what’s on the back of those cards. So, your job is to check that the rule described in the task is correct by only turning two cards.
____ out of _____ (Correct: 1 out of 10).
Which cause of death is more likely?
| χ2 | df | CFI | TLI | RMSEA | SRMR | N | Estimator | |
| CRT | 36.35 | 35 | 1 | 1 | .01 | .03 | 506 | DWLS |
| BBS | 10.54** | 2 | .99 | .98 | .09 | .04 | 506 | DWLS |
| NUM | 0.27 | 2 | 1 | 1 | .00 | .01 | 506 | DWLS |
| VR | 1.43 | 2 | 1 | 1 | .00 | .02 | 506 | DWLS |
| AOT | 261.34** | 90 | .87 | .85 | .06 | .05 | 469 | ML |
| BRN | 6.19 | 5 | 1 | 1 | .03 | .04 | 253 | DWLS |
| FCS | 5.21 | 5 | 1 | 1 | .01 | .04 | 253 | DWLS |
| CBR | Just 3 variables, i.e., perfect fit | |||||||
| GF | 5.16 | 5 | 1 | .99 | .01 | .05 | 253 | DWLS |
| AV | 12.00** | 2 | .92 | .77 | .14 | .09 | 253 | DWLS |
| AV + | 0.07 | 1 | 1 | 1 | .00 | .00 | 253 | DWLS |
| + after allowing the first two items to covary as they are both related to diabetes. | ||||||||
| Item | Lureness |
| CRT1 | .86 |
| CRT2 | .64 |
| CRT3 | .73 |
| CRT4 | .57 |
| CRT5 | .81 |
| CRT6 | .84 |
| CRT7 | .78 |
| CRT8 | .81 |
| CRT9 | .78 |
| CRT10 | .70 |
This work is a part of the project “Implicit personality, decision making and organizational leadership” funded by the Croatian science foundation (Grant no. 9354).
Data can be found at https://osf.io/zctme/.
Copyright: © 2020. The authors license this article under the terms of the Creative Commons Attribution 3.0 License.
This document was translated from LATEX by HEVEA.