Judgment and Decision Making, Vol. 16, No. 1, January 2021, pp. 165-200
The effects of tool comparisons when estimating the likelihood of task successShuqi Lia Jane E. Millerb Jillian O’Rourke Stuartc Sean J. Julesd Aaron M. Scherere Andrew R. Smithf Paul D. Windschitlg |
Abstract:People often use tools for tasks, and sometimes there is uncertainty about whether a given task can be completed with a given tool. This project explored whether, when, and how people’s optimism about successfully completing a task with a given tool is affected by the contextual salience of a better or worse tool. In six studies, participants were faced with novel tasks. For each task, they were assigned a tool but also exposed to a comparison tool that was better or worse in utility (or sometimes similar in utility). In some studies, the tool comparisons were essentially social comparisons, because the tool was assigned to another person. In other studies, the tool comparisons were merely counterfactual rather than social. The studies revealed contrast effects on optimism, and the effect worked in both directions. That is, worse comparison tools boosted optimism and better tools depressed optimism. The contrast effects were observed regardless of the general type of comparison (e.g., social, counterfactual). The comparisons also influenced discrete decisions about which task to attempt (for a prize), which is an important finding for ruling out superficial scaling explanations for the contrast effects. It appears that people fail to exclude irrelevant tool-comparison information from consideration when assessing their likelihood of success on a task, resulting in biased optimism and decisions.
Keywords: social comparison, contrast effect, comparative information, optimism, confidence, bias
Misjudging one’s chance of success at a task can be costly. Overestimating the likelihood of success might cause one to attempt a task that should probably be avoided, or it might cause one to under-prepare for a task, leading to a failure that should have been a success. Underestimating the likelihood of success can lead people to forgo good opportunities or spend unnecessary resources to ensure success. The present work concerns people’s perceptions of the likelihood of success on tasks involving a tool.
Humans’ use of tools is common (Osiurak, Jarry, & Le Gall, 2010; Osiurak, Navarro, Reynaud & Thomas, 2018) and the ability to judge what a tool affords is viewed as a crucial cognitive skill (Gibson, 1979; Osiurak & Badets, 2016). Prior research suggests that people may overestimate how beneficial tools will be (Osiurak, Morgado, Vallet, Drot & Palluel-Germain, 2014; Virgo, Pillon, Navarro, Reynaud & Osiurak, 2017), and that the planned use of a tool may even create perceptual distortions (e.g., Davoli, Brockmole & Witt, 2012; Witt & Proffitt, 2008; Witt, Proffitt & Epstein, 2005). However, the tool use literature has not addressed whether comparisons across tools bias users’ optimism. The specific focus of the present studies was on whether, when, and how comparisons among tools might bias people’s beliefs about their likelihood of successfully completing a task with a specified tool.
Imagine Julia has an appointment across town, but a snowstorm has dropped fresh snow on the roads. She is wondering whether she could successfully drive across town in her Honda Civic sedan, vs. ending up stuck in the snow or being in an accident. Essentially, Julia needs to estimate her chance of success given her skills, the task characteristics, and the tool she has available — her sedan. Her perceived chance of success should not logically be influenced by salient comparisons with other tools (e.g., seeing that her sedan is parked next to a neighbor’s 4-wheel drive SUV), but we suspected it might be.
Prior work from a variety of domains has revealed comparison- or context-induced biases (Suls & Wheeler, 2007). There are two major directions of influence—assimilation and contrast (Bless & Schwarz, 2010; Gerber, Wheeler & Suls, 2018; Wedell, Hicklin & Smarandescu, 2007; Wundt, 1894). Assimilation is when exposure to a comparison or contextual stimulus causes judgments about the critical stimuli to be closer to the comparison’s position than they otherwise would be. In keeping with this direction, Julia might be more optimistic after seeing the SUV than if she had not seen the comparison vehicle. Alternatively, a contrast effect is when a comparison causes judgments about the critical stimuli to be further from the comparison’s position than they otherwise would be. In keeping with this direction, Julia might be less optimistic after seeing the SUV.
There are numerous theoretical perspectives on the determinants of contrast and assimilation (e.g., Biernat, Manis & Kobrynowicz, 1997; Bless & Schwarz, 2010; Herr, Sherman & Fazio, 1983; Loersch & Payne, 2011; Markman & McMullen, 2003; Mussweiler, 2003; Parducci, 1965; for a review see Wedell et al., 2007). Several of these perspectives are consistent with the notion that, when a comparison tool is clearly better or worse than a target tool, contrast effects occur. For example, Herr et al. (1983) proposed that when a primed stimulus is moderate and a target stimulus is ambiguous, the tendency for the target stimulus to be similarly categorized as the primed stimulus would be high, leading to an assimilation effect. However, if the target is not ambiguous or if the primed stimulus is clearly distinct (or extreme) relative to the target, the categorization made salient by the primed stimulus would not be used to interpret the target. Instead, the primed stimulus becomes a context against which a target is evaluated, thereby yielding the potential for a contrast effect. Our work addresses situations in which the target tool is not substantially ambiguous and the comparison tools are clearly better or worse than the target tool. Therefore, assimilation through feature and category overlap is unlikely, but contrast effects seem possible.
Empirical examples of contrast effects cover a broad set of situations and dependent variables. In social comparison studies, when people are exposed to an upward vs. downward comparison target (i.e., a target individual who is better or worse than they are), their self-evaluations often show a contrast effect (Gerber et al., 2018; Morse & Gergen, 1970; Wood, 1989; Zell & Alicke, 2010). In social perception studies, evaluations about a target person’s behavior and traits are often affected by comparisons with relevant others (Biernat & Billings, 2001; Chambers & Windschitl, 2009; Higgins & Lurie, 1983). In psychophysics studies, judgments of the magnitude of a stimulus are often contrasted against the magnitude of previous stimuli (Coren & Ennis, 1993; Helson, 1964; Jesteadt, Luce & Green, 1977; see also Matthews & Stewart, 2009). Finally, studies show that people’s reactions (e.g., affect) to risk information partially depend on how it compares to others’ risk information—yielding contrast effects (Fagerlin, Zikmund-Fisher & Ubel, 2007; French, Hevey, Sutton, Kinmonth & Marteau, 2006; Klein, 2003; Windschitl, Martin & Flugstad, 2002).
Nonetheless, it should not be a foregone conclusion that comparison tools produce contrast effects on optimism. It is possible that people effectively ignore the presence of a comparison tool as they do mental simulations to estimate their optimism about a given target tool. It is also possible that people recognize the potential for a comparison tool to impact their optimism, and they attempt to deliberatively control or counteract that impact. As discussed in flexible-correction models of bias in judgment, such attempts could lead to counter-adjustment (leaving a null effect), or either over- or under-correction (Chien, Wegener, Petty & Hsiao, 2014; Petty & Wegner, 1993; Wegner & Petty, 1995; Wilson & Brekke, 1994).
The way in which optimism is measured could also be a factor in influencing the magnitude or direction of contrast effects. This point is related to a general distinction between subjective and common-rule scales. Contrast effects can be especially prevalent on “subjective” scales (Biernat et al., 1997). The name “subjective” has been used to refer to scales that contain flexibly interpreted response options, such as short and tall on a height-related scale. Comparison stimuli can help define respondents’ interpretations and uses of scale options, thereby yielding contrast effects at a superficial, response-scale level (Manis & Armstrong, 1971; Parducci, 1965; Stevens, 1958; Upshaw, 1969). Common-rule scales, sometimes called “objective scales,” are less prone to contrast effects and can be more prone to assimilation effects (Biernat et al., 1997; Mussweiler & Strack, 2000). When people are asked to indicate height in inches or time in minutes, there is no longer the same flexibility that allows response options to be differentially defined under different contexts or comparison stimuli. Thus, a major source of contrast effects is removed.
In our studies, although we did solicit some responses on a verbal likelihood scale that had flexibly-interpretable endpoint options of very unlikely and very likely, our primary dependent measures were not answered on a verbal likelihood scale. Instead, we assessed optimism using a numeric measure, which asked people to indicate their likelihood of success by choosing one of eleven possible response options ranging from 0% to 100% in 10% increments. This numeric likelihood scale can be considered a common-rule scale. That is, “20%” should carry the same meaning across contexts—in the same way that a measurement such as “62 inches” should carry the same meanings across contexts. Normatively, respondents should not use the same response on a common-rule scale to mean different things as a function of comparison context. This is not to say that they will not, however (Windschitl, 2002). If we detected a comparison-induced contrast effect on a numeric scale, two interpretations would be possible. One is that the comparison truly altered an internal representation of the likelihood of success. The other is that the internal representation of the likelihood of success was unaffected, but people treated the numeric scale as if it were not a common-rule scale. Their interpretation of the scale options contextually shifted as a function of context.
Critically, we also included decision measures in our studies to better assess the depth of any contrast effects we might observe on likelihood measures. If contrast effects were detected on the likelihood measures but not with decisions, it might suggest that judgment-scaling mechanisms are the best explanations for these effects (Biernat et al., 1997; Parducci, 1965; Sherman, Ahlm, Berman & Lynn, 1978). However, if contrast effects extended to decisions, this suggests that comparisons affected internal uncertainty or confidence.
Finally, it is worth emphasizing that in our paradigm we asked people about immediately impending performances. We measured participants’ optimism and relevant choices for tasks they were about to complete rather than hypothetical or distant-future tasks. For some forms of bias that affect performance predictions, inaccuracies driven by the bias are greater when the task is hypothetical or slated for a distant future (Armor & Sackett, 2006). Because misjudging one’s chance of success at a task can be costly, people’s awareness that they will receive immediate feedback on an impending task might sharpen their expectations away from contrastive or assimilative bias (see Moore & Klein, 2008, for a relevant example about comparisons, but without tools).1
Six studies examined whether, when, and how comparisons across tools bias users’ optimism. In each study, there were 2-4 independent tasks for a given participant to attempt (e.g., roll a ball from across a lab room in an attempt to knock over a stake). Some studies just involved the participant, while others involved the additional participation of a confederate. For a given task, participants received their tool, but they also were made aware of either an upward comparison (saw a better tool) or a downward comparison (saw a worse tool) before being asked about their chances of success and other responses.
In our first study, the comparison tool was held by a confederate posing as a co-participant, creating a situation akin to social comparison studies. In the second study, there was no confederate; the comparison tool was simply an alternative tool that could have been received by the participant. The third and fourth studies were similar to the first and second, respectively, except that a lateral-comparison condition was introduced to examine the symmetry/asymmetry of contrast effects induced by upward vs. downward comparisons. In the fifth study, we changed the procedure such that participants understood the “alternative tool” would be used in a second attempt at the task. The sixth study addressed an important alternative explanation for the results from our paradigm.
Seventy-one University of Iowa students (44 female, 27 male; Mage=19.86 years, SDage=4.63) taking an introductory psychology class participated for partial fulfillment of a research exposure requirement. Each participant encountered 4 tasks. The manipulation of upward vs. downward comparison was within-subject; a participant always saw two tasks involving upward comparisons and two involving downward comparisons. The assignment of a specific task to these conditions was counterbalanced across participants. Our sample size afforded >98% power to detect a medium-size difference (d=0.50) for a within-subject comparison between upward and downward conditions (Faul, Erdfelder, Buchner & Lang, 2009).
Each session had one participant and a female confederate playing the role of second participant. After the consent process, the participant and confederate watched a video informing them they would individually have an attempt at completing four tasks. Then, in an instructional video specific to Task 1, an actor explained the task, the goal, and the general nature of the tool. It was made clear that the performances of the “two” participants on the tasks would not be compared (i.e., it was not a competition). Task 1 always involved rolling a ball across the room in an attempt to knock over a stake (see Tasks and Tools section for more details about all four tasks). The video showed the full physical context for the task, and the actor mimed (without a tool) the action that the participant would execute when they had their tool. After the video, the experimenter asked the “two” participants to each draw a slip of paper that was supposedly used to determine which tool each person would receive. The experimenter stepped into a nearby room and returned with a tool for the participant and confederate. Every participant in the study received the same tool (e.g., the same ball in Task 1), while the tool given to the confederate was manipulated (better or worse; e.g., either a larger or smaller ball than the participant’s ball). After the participant and confederate held and inspected their respective tools, they were asked to place their tool on the floor and privately write down a numeric likelihood estimate and hypothetical bet decision for the task (solicited in counterbalanced order). These steps (watching video, receiving tool, and completing two measures) were then repeated for Tasks 2, 3, and 4. Prior to attempting the tasks, participants completed a pick-task item and all other items (see Measures below). After attempting the tasks, the participant was fully debriefed about the use of the confederate and the purpose of the study.
Within each task, the tool received by the participant was always the same, and only one attempt was allowed. The confederate’s tool was either more or less useful. The order of the four tasks remained the same.
Task 1 involved attempting to knock over a stake from an 8-foot distance with a ball. Task 2 involved attempting to knock over five foam blocks from a distance of 5 feet by creating a blast of air with the waving of a plastic rectangular lid. Task 3 involved using a spoon to try to move four marbles, one at a time, from one plate to another within 10 seconds. Each spoon had an extended handle, making it harder to control as a function of handle length. Task 4 involved using a box to try to catch a round piece of paper—before it reached the ground—as it unpredictably zigged and zagged while falling from a high starting point. The size of the ball, plastic lid, spoon extension, and box given to the confederate varied to make the confederate’s tool better or worse than the participant’s tool, for the respective task. Results from pilot testing verified that the tools used in the study were indeed perceived as differentially useful for the tasks.2
For the numeric likelihood question, participants made estimates about their chance of success by choosing one of eleven possible response options ranging from 0% to 100% in 10% increments. For each hypothetical bet, participants were asked to imagine that they had been given $5 and could bet some or all of it on the task. If they successfully completed the task, they would double the amount they bet. Otherwise, they would lose that amount. Participants circled $0, $1, $2, $3, $4, or $5 to indicate the amount they would bet. Of the rest of the measures—answered after all tasks had been introduced but before they were attempted—the first and most important was the pick-task decision: “Imagine you could play one of the four tasks for a chance to win $20 (if successful). Which task would you pick?” Participants were also asked about the following for each task: the numeric likelihood of their “co-participants’” success (0-100%), the usefulness of their own tool (7-point scale), the usefulness of their “co-participants’” tool (7-point scale), and the verbal likelihood of their own success (7-point scale from very unlikely to very likely). Questions about gender, age, and general reactions came last. Actual performance on the tasks was recorded, but was never considered a measure of interest in our studies.3
For most analyses below, we first calculated a composite score of participants’ judgments on a given measure for the two tasks experienced as upward-condition tasks, and a separate composite for the two downward-condition tasks. In the studies reported here, we did not apply corrections for our multiple, targeted comparisons.
Preliminary analyses confirmed that upward and downward comparisons were successfully manipulated. Participants in the downward-comparison condition on a given task rated their own tool as more useful (M=5.27, SD=0.92) than the confederate’s tool (M=2.61, SD=1.06), t(70)=19.02, p<.001, d=2.26, 95% CI[2.38, 2.94]. By contrast, participants in the upward-comparison condition on a given task rated their own tool as less useful (M=3.56, SD=1.03) than the confederate’s tool (M=6.17, SD=0.88), t(70)=18.10, p<.001, d=2.15, 95% CI[2.32, 2.89].4
Relevant to the numbers above, the rated usefulness of the participants’ tool was higher in the downward versus upward condition, t(70)=19.02, p<.001. This is expected because it is perfectly reasonable for a person to use contextual comparisons when judging tool usefulness on a 7-point scale. Such scales can be interpreted as comparative (Biernat et al., 1997). Our main interest was whether comparisons influenced expectations expressed on non-comparative scales and on related decisions, both of which should be based on absolute rather than comparative assessments.
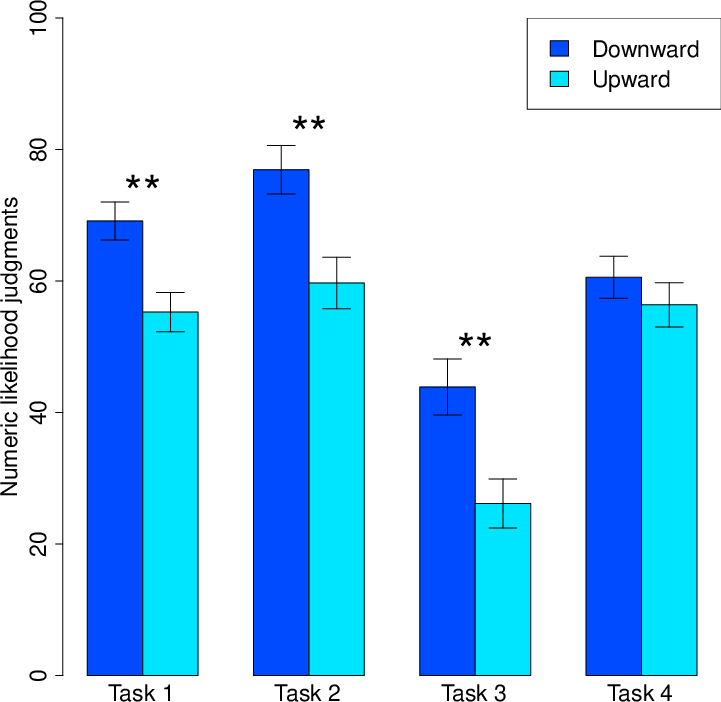
Consistent with a contrast effect, we found that when participants saw the other person holding a tool that was worse than their own (i.e., downward comparison), they reported a higher likelihood of being successful (M=62.61%, SD=18.60%) than when they saw the other person holding a tool that was better than their own (i.e., upward comparison; M=49.58%, SD=18.06%), t(70)=5.21, p<.001, d=0.62, 95% CI[8.04, 18.02]. We also made between-subject comparisons of participants who were in an upward vs. downward condition for each task. The directional results for all four tasks were the same as the overall results just reported (see Figure 1). The comparison was significant (ps<.01) in all but the fourth task (p=.37). Therefore, the results were generally consistent across tasks.
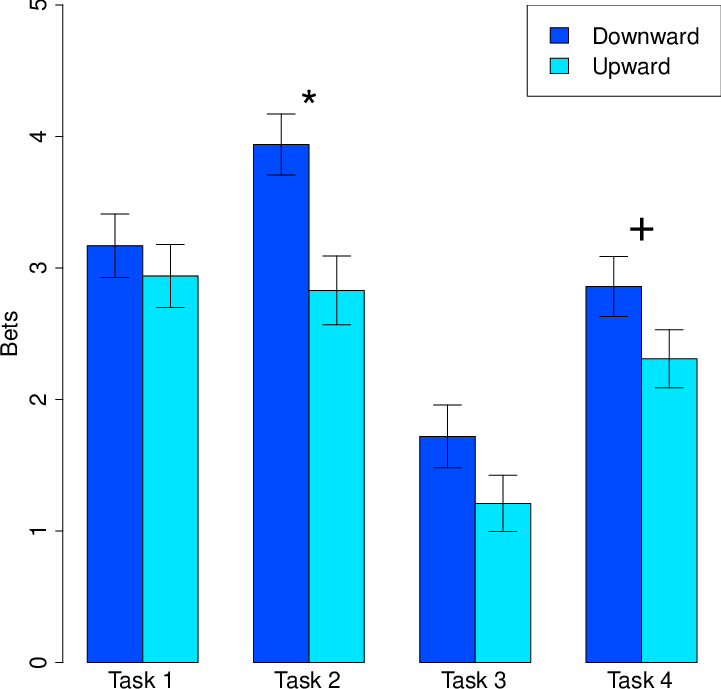
As with other measures, we created composites of hypothetical bet amounts ($0-$5) selected in the upward and downward conditions. Again consistent with a contrast effect, for tasks in which participants saw a downward comparison, they bet significantly more money (M=$2.92, SD=$1.23) than for tasks in which they saw an upward comparison (M=$2.32, SD=$1.22), t(70)=4.36, p<.001, d=0.52, 95% CI[0.33, 0.87]. As was the case for the likelihood results, the directional difference for per-task comparisons of upward vs. downward conditions was the same for all four tasks, although it was significant for only the second task (p=.002), but not the others (ps of .51, .11, .09) (see Figure 2).
Recall that participants picked a task from the four possible tasks to play, for which they would hypothetically receive $20 if they were successful. Participants tended to gravitate more toward some tasks rather than others; the respective frequencies of people picking Tasks 1-4 were 22, 35, 0 and 11. This just suggests that Task 2 generally appeared to be the easiest for success, and Task 3 the most difficult. Our primary research question was whether people were more likely to select a given task when the confederate’s tool for that task was less (vs. more) useful than the participant’s tool. As assessed with a binomial test, a significant majority of participants (50 of the 68 responding; 74%) picked a task for which their tool was better than the confederate’s tool (p<.001). More specifically, of the 22 instances in which a participant picked Task 1, it was in the downward condition 15 times. Of the 35 instances in which a participant picked Task 2, it was in the downward condition 25 times. Of the 11 instances in which a participant picked Task 4, it was in the downward condition 10 times. No participant picked Task 3. In short, when participants picked a task that they thought offered them the best shot to win $20, irrelevant comparisons shaped their decisions.
Verbal likelihood judgments also displayed contrast effects. Estimates were higher in the downward condition (M=4.85, SD=1.01) than in the upward condition (M=3.73, SD=1.09), t(70)=7.36, p<.001, d=0.87, 95% CI[0.81, 1.41]. The comparisons per task were directionally the same and were significant for all four tasks (ps<.01).
Study 1 provided the first test of whether social comparisons involving tools influence people’s expectations and decisions regarding an immediately impending task. Critically, all participants received the same tools, and the manipulated tools (the confederate’s) were not objectively relevant to the participants’ attempts at the tasks. Results were consistent with our hypothesis: the presence of a second tool held by a confederate served as a comparison and elicited a contrast effect; downward social comparison situations made participants more optimistic than upward social comparison situations. Although flexible-correction models provide a plausible rational for an alternative prediction that people would avoid showing contrast effects or might even show assimilation effects, contrast effects were clearly dominant (Wegner & Petty, 1995; Wilson & Brekke, 1994). That is, people did not use intuitive correction processes to fully undo the impact of exposure to a salient comparison tool.
The fact that contrast effects were detected with both judgment and decision measures is important for drawing inferences about the psychological level at which the observed effects were operating. It appears that the contrast effects were not merely due to judgment-scaling dynamics that can occur without changes to internal representations of the target characteristic (Manis & Armstrong, 1971; Sherman et al., 1978). If the contrast effects in Study 1 were only observed on the likelihood judgments and not decisions, a scaling explanation would be more plausible. Instead, the presence of comparison tools affected the participants’ choices of what tool they would like to use for a chance at winning $20. The results for this measure support the conclusion that the contrast effects were probably due to a change in the participants’ internal representations of their likelihood of success with a given tool.
In Study 1, the comparison tool was assigned to another person (the confederate). Consequently, the study does not reveal whether the comparison-induced contrast effects were uniquely social in nature or whether non-social comparisons could trigger the same effects. Study 2 addressed this question by modifying the paradigm so that it did not involve a confederate. The comparison tool was made salient to the participant, but it was not assigned to him/her or anyone else. More specifically, this other tool was essentially a counterfactual tool—a tool to which they could have been assigned but were not.
Studies on counterfactual thinking show that people’s satisfaction, happiness, and other affective reactions to outcomes are often shaped—usually in a contrastive direction—by the extent to which upward or downward counterfactuals are salient (Kassam, Morewedge, Gilbert & Wilson, 2011; Medvec, Madey & Gilovich, 1995; Roese, 1997). Various reviews and theoretical perspectives assume that, despite the definitional differences between social comparison effects and counterfactual thinking effects, these processes are similar in many ways (e.g., Markman & McMullen, 2003; Olson, Buhrmann & Roese, 2000). As such, it might be expected that the results of Study 2, will be similar to those of Study 1. However, it is also plausible that social dynamics in Study 1 played a facilitating or crucial role in producing the observed effects (Morewedge, Zhu & Buechel 2018). For example, even though it was made clear to participants in Study 1 that there was no competition with the confederate, the general similarity with a person vs. person competitive context might have made social comparisons between tools highly influential.
Forty-eight University of Iowa undergraduate students (26 female, 22 male; Mage=19.25 years, SDage=1.16) participated. The study was a two-cell within-subject design (comparison condition: downward vs. upward). There were four tasks and the order of comparison conditions was counterbalanced. Each participant was in an upward-comparison condition for two of the tasks and a downward-comparison condition for the other two. Our sample size afforded >92% power to detect a medium-size difference (d=0.50) for a within-subject comparison between upward and downward conditions (Faul et al., 2009).
The study was similar to Study 1 in the sense that it involved the same four tasks and participants were aware that there were two tools available for each task. The novel part of Study 2 was that all sessions were run with only one participant and no confederate. After the introductory video for a task, the participant drew a slip of paper from a container as part of a rigged drawing. While the participant unfolded the slip, the experimenter briefly left and returned with two tools—allowing the participant to see both before learning which one was theirs. All the measures were the same as in Study 1 except that 1) there were no questions referring to another participant/confederate and 2) the pick-task question was altered to make the prize real rather than hypothetical. Instead of asking participants to imagine they might win $20, the question informed them that they would win a candy bar if they successfully completed the task.
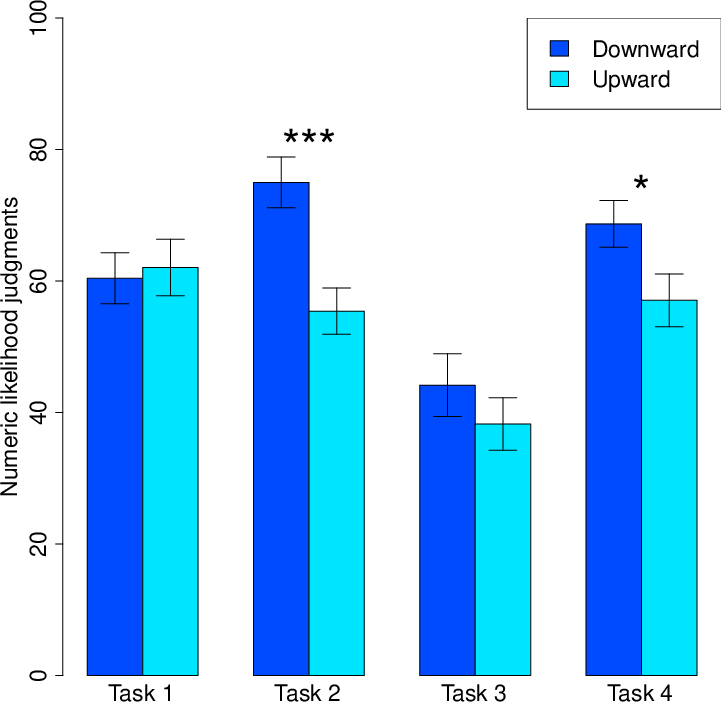
Consistent with a contrast effect, we found that when participants saw a counterfactual tool that was worse than their own (i.e., downward comparison), they reported a higher likelihood of being successful (M=61.25%, SD=16.62%) than when they saw a counterfactual tool that was better than their own (i.e., upward comparison; M=52.92%, SD=17.80%), t(47)=3.19, p=.003, d=0.46, 95% CI[3.07, 13.59]. When examined in each individual task, this same directional pattern was observed for the second (p<.001), third (non-significant p=.35), and fourth tasks (p=.04). There was a nonsignificant reversal for the first task (p=.78) (see Figure 3).
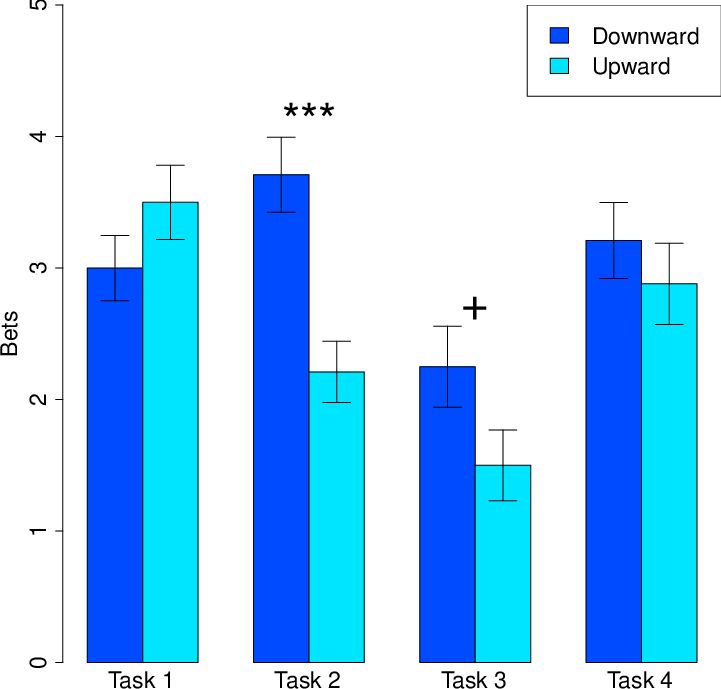
Again consistent with a contrast effect, participants bet significantly more money on successful task completion when there was a salient downward comparison (M=$2.98, SD=$1.14) than a salient upward comparison (M=$2.52, SD=$1.30), t(47)=2.84, p=.007, d=0.41, 95% CI[0.13, 0.78]. When examined in individual tasks, this same directional pattern was observed for the second (p<.001), third (non-significant p=.07), and fourth tasks (non-significant p=.43). There was a nonsignificant reversal for the first task (p=.20) (see Figure 4).
Recall that participants selected one of the four tasks to play in order to win a candy bar if successful. In a nearly significant trend, a binominal test revealed that the majority of participants (31 of 48; 65%) picked a task for which their tool was better than the counterfactual tool (p=.06).
In line with the other findings, verbal likelihood estimates were higher in the downward condition (M=4.86, SD=1.08) than in the upward condition (M=4.38, SD=1.16), t(47)=2.40, p=.02, d=0.35, 95% CI[0.08, 0.90]. The comparisons per task were directionally the same; the comparison was only significant for the second task (p=.001) but not for the other three tasks (ps=.35, .12, .90, respectively).
Study 2 examined whether people’s expectations and decisions can be influenced in nonsocial comparison situations. We found that being aware of a counterfactual tool biased participants’ judgments and decisions regarding the tasks, even though no one received the counterfactual tools. Specifically, when the counterfactual tool was less (more) useful tool than the participant’s own tool, participants were more (less) optimistic and placed a higher (lower) hypothetical bets about successfully completing the task. These findings fit with theoretical perspectives that emphasize similarities between social comparisons and counterfactual thinking (Markman & McMullen, 2003; Olson et al., 2000), and they rule out the notion that the results from Study 1 were specific to a social-comparative or competitive context.
In addition, the results on the pick-task decisions essentially replicate and extend those from Study 1. When participants were asked to pick a task on which a candy bar would be at stake, the majority of participants bet on a task for which the counterfactual tool was less useful (again, the p-value for this majority proportion was .06). Consistent with Study 1, this result suggests that the influence of comparisons is not just a scaling effect.
Although we have demonstrated that participants’ estimations of the likelihood of success are influenced in both social comparison and nonsocial counterfactual situations, we have not yet established whether this tendency is a bidirectional and symmetrical contrast effect. In other words, it is not clear whether being exposed to downward social comparisons made people more optimistic, or whether being exposed to upward social comparisons made people less optimistic, or a combination of both.
Bruchmann (2017) noted that most social comparisons studies that present comparisons to people do not include a control condition or lateral-comparison condition (e.g., Brown, Novick, Lord & Richards, 1992; Mussweiler, Rüter & Epstude, 2004). When interpreting these studies, there has been a tendency to assume that the results are symmetrical (i.e., both upward and downward comparisons produce effects in the direction of contrast, relative to what would be observed in a no-comparison control or lateral control condition). However, it is problematic to draw this conclusion without data from a control condition. A recent meta-analysis suggests that contrast effects might come from both upward and downward directions, although the number of studies included in the analysis was quite small and thus the conclusion was limited (Gerber et al., 2018). Bruchmann’s (2017) recent studies suggest that downward comparisons disproportionately influenced self-evaluations as compared to upward comparisons.
To address the symmetry/asymmetry question in our paradigm, we added a lateral-comparison condition in Study 3. Similar to Study 1, we examined the impact of social comparisons through the use of a confederate. However, instead of always staging comparisons in which the confederate’s tool was better or worse than the participant’s tool, it was sometimes the same as the participant’s tool (in the lateral-comparison condition). Using a lateral comparison as a control condition is better than a “no comparison” control because the act of comparison remains constant and only the direction of the comparison varies.
Seventy-two University of Iowa undergraduate students (49 female, 23 male; Mage=19.15 years, SDage=2.57) participated. One participant was excluded from data analyses because the confederate was recognized as a previous classmate. The study was a one-factor (comparison condition: downward vs. upward vs. lateral) within-subject design. Our design and sample size afforded >98% power to detect a medium-size difference (d=0.50) for a pairwise comparison (Faul et al., 2009).
This study was the same as Study 1 with three exceptions. First, we added the lateral-control condition in which the comparison tool was the same as the participant’s tool. Second, we only used three tasks (1, 2, and 4), which simplified the counterbalancing for this design. A participant was in each comparison condition exactly once (fully counterbalanced). Third, the pick-task measure was the same as what was used in Study 2 rather than Study 1.
Descriptive statistics for the key variables are reported in Table 1. Our main interest was in how the upward and downward conditions differed from the lateral conditions, but it is first instructive to note that we replicated the contrast effects observed in the previous studies. That is, pairwise comparisons of upward vs. downward conditions were significant for the numeric likelihoods (t(70)=2.90, p=.005), bets (t(69)=4.62, p<.001), and verbal likelihoods (t(67)=4.77, p<.001). Omnibus tests for all three measures (comparing among the three conditions) were also significant.5 It is also important to note that the sample means from the lateral conditions always fell (directionally) in between the sample means for the upward and downward conditions.
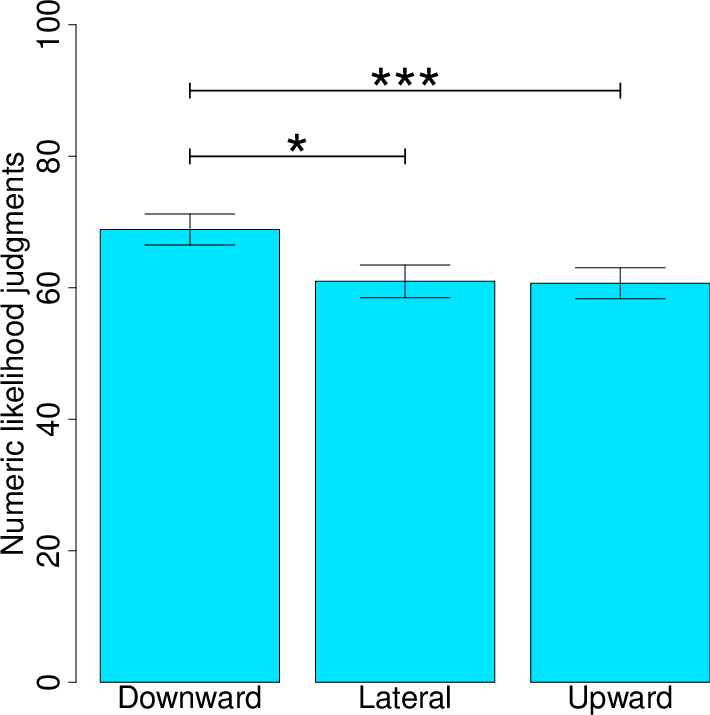
Table 1: Study 3 Descriptive Statistics for Numeric Likelihood Judgments, Bets, and Verbal Likelihood Judgments in Downward, Lateral, and Upward Conditions.
Variable Condition Mean SD Numeric Likelihood Judgments (0%-100%) Downward 68.87% 19.97% Lateral 60.99% 21.19% Upward 60.70% 20.02% Bets ($0-$5) Downward 3.64 1.39 Lateral 3.21 1.37 Upward 2.79 1.35 Verbal Likelihood Judgments (1-7) Downward 5.47 1.30 Lateral 4.68 1.31 Upward 4.53 1.20
However, tests of whether means in the upward and downward conditions were significantly different from the lateral condition returned mixed results across measures. For numeric likelihood judgments, participants’ estimates were significantly higher in the downward condition (vs. lateral, t(70)=2.62, p=.01), but they were not significantly lower in the upward condition (vs. lateral; t(70)=0.10, p=.92) (see Figure 5). The same pattern was true for verbal likelihood judgments—estimates were significantly higher in the downward condition (vs. lateral, t(67)=4.07, p<.001), but they were not significantly lower in the upward condition (vs. lateral; t(67)=0.80, p=.42). However, for betting decisions, the bets were significantly higher in the downward condition (vs. lateral, t(69)=2.17, p=.03), and significantly lower in the upward condition (vs. lateral; t(69)=2.54, p=.01) (see Figure 6). Although it may be tempting to speculate about why likelihood judgments, but not bets, showed an asymmetry in how upward and downward comparisons influenced people, there are two important reasons to put off such speculation. First, when we compared the absolute magnitude of the downward vs. lateral effect with the absolute magnitude of the upward vs. lateral effect, we found that the asymmetry was not statistically significant (numeric likelihood judgments, p=.21; verbal likelihood judgments, p=.06). Second, with a similar paradigm except involving nonsocial comparisons, the next study offers a test of the same patterns but with a sample size of 207 rather than 72. In other words, full conclusions should be drawn following the higher-powered study.
Finally, results from the pick-task decisions were consistent with the other results. Of all the participants, 47.9% chose a task that was in the downward condition, 31% chose a task that was in the lateral condition, and only 16.9% chose a task that was in the upward condition. These choice proportions varied from equality, χ 2(2)=10.52, p=.005. The downward-condition task was significantly more likely to be selected than the upward-condition task (p=.001). The selection rate for the lateral-condition task was not significantly different from the rate for the downward-condition task (p=.11) or the upward-condition task (p=.09).
Study 4 provided another test, with a large sample size, of the symmetry/asymmetry issue. We again included a lateral condition to see if both upward and downward comparisons have an effect on participants’ optimism. Unlike Study 3, we used a nonsocial version of the paradigm (akin to what was used in Study 2).
The participants were 207 undergraduate students (167 female, 37 male, 3
unreported; Mage=18.91,
SDage=1.57). Our sample-size goal of
204 was determined a priori and preregistered on the Open Science
Framework
(https://osf.io/p534u/?view_only=5ec77d12e1e74b5ba08bbadc705b463a).
As in Study 3, the design was a three-cell within-subject design (upward,
lateral, downward) and involved three tasks. Our sample size afforded
>99% power to detect a medium-size difference
(d=0.50) for a within-subject comparison between upward and
downward conditions (Faul et al., 2009).
The procedural flow was generally similar to those in the previous studies: a participant watched an introductory video and learned about the tools for a given task immediately before completing the main dependent measures for that task. As in Study 3, a lateral condition was included, but as in Study 2, no confederate was involved. There was a slight change to the process by which the participant was assigned to their tools. Specifically, after watching the video, the participant was instructed that the computer would randomly choose which tool they would be using in the task. The participants clicked through an online survey that displayed pictures of the two tools. While the participant was viewing the two possible tools on the computer, the experimenter stepped into a nearby room and returned with both tools. The participants were encouraged to examine and pick up the tools before they clicked to the next screen, which displayed the picture of the participant’s assigned tool. Every participant in the study was assigned the same tool by the computer (e.g., the same ball in Task 1), while the other tool was manipulated (e.g., either a larger, smaller, or same-sized ball relative to the participant’s ball). After the participant was told which tool they would be using, they completed the set of three main dependent measures on the computer. Unlike in previous studies, the verbal likelihood measure was included in this set. The verbal measure always came before the numeric, but whether these two measures came before or after the bets was counterbalanced. Afterwards, participants completed a final questionnaire including manipulation check questions, a pick-task question, and demographic questions. The participants then completed all three tasks and were debriefed.
Descriptive statistics for the key variables are reported in Table 2. The study again replicated the contrast effects observed in the previous studies. Pairwise comparisons of upward vs. downward conditions were significant for the numeric likelihoods (t(206)=7.39, p<.001), bets (t(206)=5.60, p<.001), and verbal likelihoods (t(206)=6.96, p<.001). Omnibus tests for all three measures (comparing among the three conditions) were also significant.6
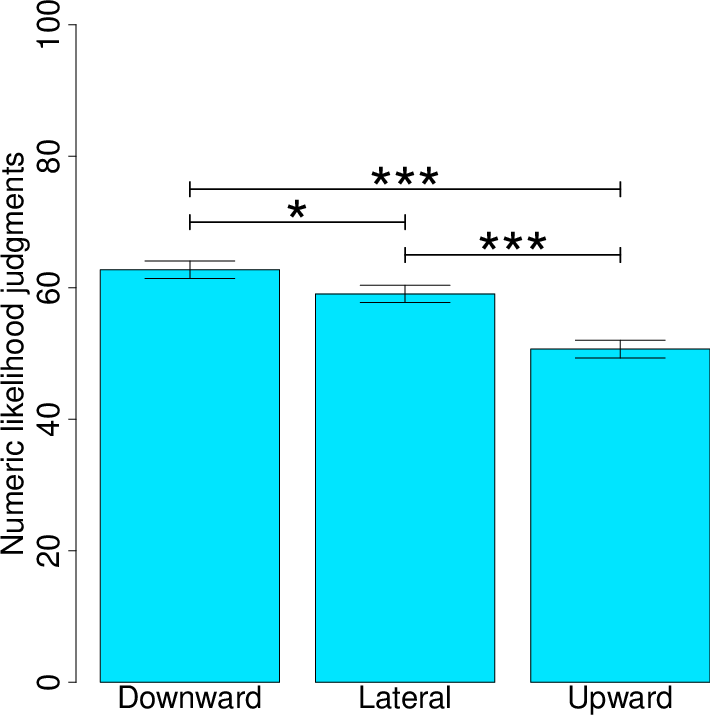
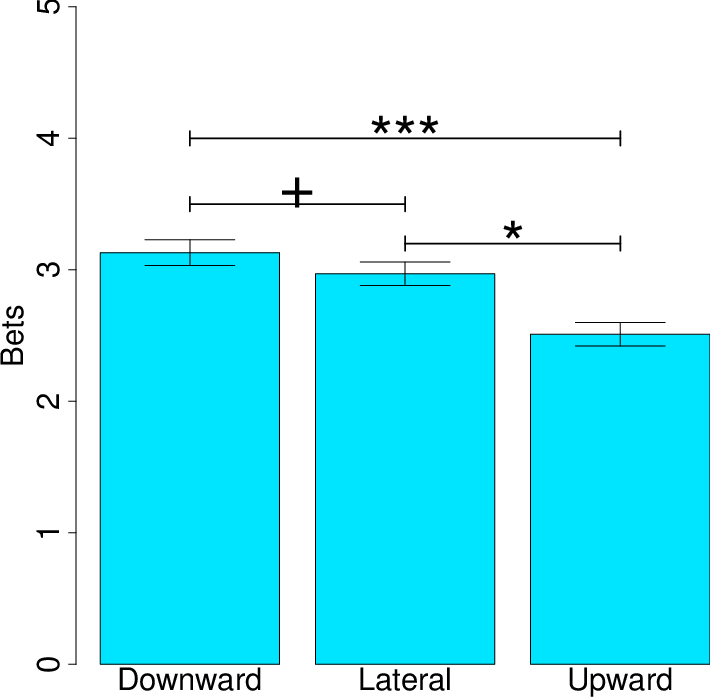
Table 2: Study 4 Descriptive Statistics for Numeric Likelihood Judgments, Bets, and Verbal Likelihood Judgments in Downward, Lateral, and Upward Conditions.
Variable Condition Mean SD Numeric Likelihood Judgments (0%-100%) Downward 62.75% 18.97% Lateral 59.08% 18.74% Upward 50.68% 19.47% Bets ($0-$5) Downward 3.13 1.30 Lateral 2.97 1.27 Upward 2.51 1.41 Verbal Likelihood Judgments (1-7) Downward 4.85 1.26 Lateral 4.63 1.22 Upward 4.03 1.39
More important are the results pertaining to how the upward and downward conditions compared to the lateral condition. In short, the means for lateral condition were typically different from and always fell between the means for the upward and downward conditions. Numeric likelihood judgments were significantly higher in the downward condition vs. lateral (t(206)=2.53, p=.01) and significantly lower in the upward condition vs. lateral (t(206)=5.46, p<.001) (see Figure 7). Verbal likelihood judgments were also significantly higher in the downward condition (vs. lateral; t(205)=2.15, p=.03) and significantly lower in the upward condition (vs. lateral; t(205)=5.55, p<.001). Bets were not statistically higher in the downward condition (vs. lateral; t(206)=1.67, p=.10), and they were significantly lower in the upward condition (vs. lateral; t(206)=4.55, p<.001) (see Figure 8).
Finally, results from the pick-task decisions were consistent with the other results. Of all the participants, 44.4% chose a task that was serving in the downward condition, 30.9% chose a task that was serving in the lateral condition, and only 24.6% chose a task that was serving in the upward condition. These choice proportions varied from equality/indifference, χ 2(2)=12.94, p=.002. The downward-condition task was significantly more likely to be selected than the lateral-condition task (p=.03) and the upward-condition task (p=.001). The lateral vs. downward comparison was not significant (p=.23).
In Study 3, upward comparisons (vs. lateral comparisons) did not have a significant effect on people’s likelihood judgments. However, the upward comparison effects were robust in Study 4, which had a much larger sample size. Downward comparison effects for likelihood judgments were robust in both studies. For bets, results from both Study 3 and 4 were largely consistent in showing effects of both upward and downward comparisons (albeit one result from Study 4 had a p value of .10). Considering all the results from both Studies 3 and 4, it seems reasonable to conclude that both upward and downward comparisons influence expectations and relevant decisions. It is probably not the case that the contrast effects observed in Studies 1 and 2 were driven only by processes occurring in either an upward-comparison or downward-comparison context.
The previous studies show that tool comparisons influence optimism. In Studies 1 and 3, the comparisons were social comparisons. In Studies 2 and 4, the comparisons were nonsocial. However, one common feature across all these studies is that the comparisons were essentially comparisons to an alternative reality. That is, all the comparisons could be considered counterfactuals. In all studies, participants were told there was a random process that determined which of the two tools would become theirs. Thus, the participant was aware that the comparison tool was a tool to which they could have been assigned—but were not.
In Study 5, we made a small adjustment to the paradigm to test whether the counterfactual nature of the comparison was a key factor in creating the effects observed in the prior studies. As in the previous studies, participants always saw two tools: the target (medium) tool and one of the three comparison tools (upward, lateral, or downward comparison tool). Critically, for each of the three tasks, participants were instructed that they would attempt the task twice, once with each of the two tools they received. If contrast effects are detected in this study, such results would rule out a set of affective-based explanations for findings in the prior studies. Namely, because of the counterfactual nature of comparisons in the previous studies, the observed contrast effects could be due to affective reactions that participants had after learning about their fortunate or unfortunate tool assignment for a given task. They might have felt mild disappointment if receiving a worse tool, and they might have felt mild relief or satisfaction if receiving a better tool. These affective reactions might then have influenced optimism. However, this dynamic would not occur in Study 5, because participants were informed that they would experience both of the tools available for a task. The participants would have no reason for feeling disappointment or satisfaction about tool assignments.
The participants were 140 undergraduate students (96 female, 44 male; Mage=19.05, SDage=2.07). As in Study 4, the design was a three-cell within-subject design (upward, lateral, downward) and involved the 3 tasks (fully counterbalanced). Our sample size afforded >99% power to detect a medium-size difference (d=0.50) for a within-subject comparison between upward and downward conditions (Faul et al., 2009).
The tasks and procedures were identical to those for Study 4, except as noted. Critically, after the video introduction for each task, participants were instructed that they would complete each task two times, once with each tool. They were then shown pictures of the two tools on the computer. While they were viewing the pictures, the experimenter stepped into a nearby room and returned with the two tools. Participants were encouraged to examine and pick up the tools. Every participant saw a target tool (always medium-sized) and a comparison tool (better, lateral, or worse than the target tool). We were interested in whether numeric and verbal likelihood estimates were similarly sensitive to comparison effects, so we solicited both numeric and verbal likelihood estimates in counterbalanced order for each of the two tools in a task. Bets and pick-task decisions were not solicited in this study.
Overall, the results revealed that even non-counterfactual comparisons produced contrast effects in people’s optimism about an impending task. The analyses reported here focused on participants’ responses about the target tool (always medium-sized) rather than the comparison tool—although Table 3 displays statistics for responses about both tools.7 The omnibus tests from the repeated-measures ANOVAs were significant for both numeric likelihood judgments [F(2, 276)=47.44, p<.001, ηp2=.26] and verbal likelihood judgments about the target tool [F(2, 278)=63.78, p<.001, ηp2=.32]. Pairwise comparisons revealed more optimism in the downward than upward condition as assessed on both numeric (p<.001) and verbal measures (p<.001) (see Figure 9). Sample means from the lateral conditions always fell (directionally) in between the sample means for the upward and downward conditions (see Table 3 for more pairwise-test results).
Table 3: Study 5 Descriptive Statistics for Numeric and Verbal Likelihood Judgments in Downward, Lateral, and Upward Conditions.
Variable Condition
Mean (Target)
SD (Target)
Mean (Comparison)
SD (Comparison) Numeric Likelihood Judgments Downward 69.14%a 17.55% 44.79% 22.23% Lateral 67.41%a 16.30% 66.29% 17.11% Upward 53.02% 19.14% 72.57% 18.67% Verbal Likelihood Judgments Downward 5.29 1.2 3.3 1.26 Lateral 4.81 1.18 4.88 1.13 Upward 3.88 1.42 5.46 1.29 Note. Means within a column and judgment type are significantly different except those that share a subscript.
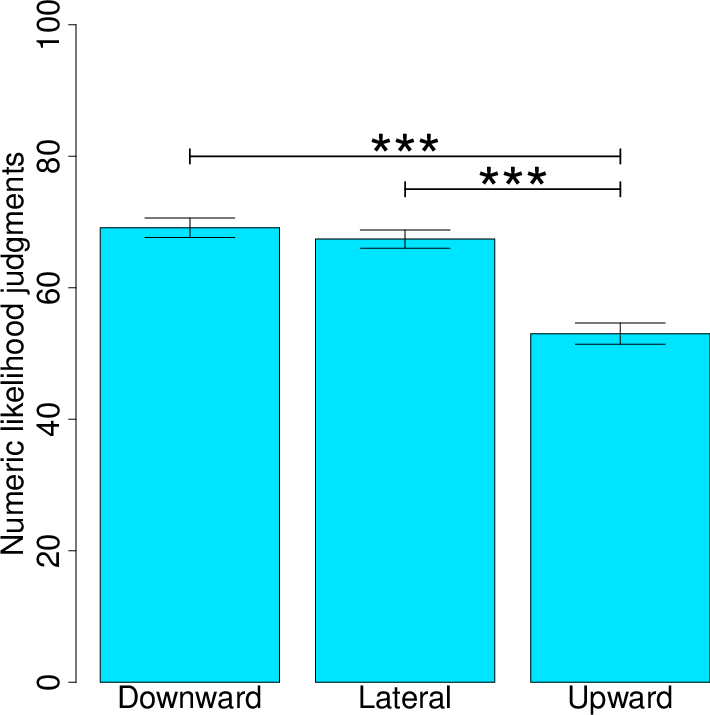
Figure 9: Study 5 numeric likelihood judgments about being successful with the target tool when the task was experienced as a downward-condition task, lateral-condition task, or upward-condition task. ***p<.001 for pairwise, between-condition comparisons. See Table 3 for judgment data about success with the comparison tool and for verbal likelihood data.
In sum, the main results of Study 5 are consistent with what we found in previous studies. Therefore, the counterfactual nature of comparisons in Studies 1-4 does not appear to be a necessary ingredient in the contrast effects that have been observed. Even when participants knew they would be using both tools, their optimism about using one tool was affected by a contrast with the second tool. The findings rule out affect-based explanations for the results from the prior studies. Because participants in Study 5 were informed that they would experience both of the tools available for a task, they had no reason for feeling disappointment or satisfaction about tool assignments.
The impetus for the final study was a comment we received during the editorial review process.8 In the car example from the introduction, the comparison car parked near Julia’s sedan should not logically influence her optimism about arriving at her appointment on time. However, in the context of a research study, participants might make inferences about the researchers’ use of stimuli, and these inferences could complicate the assumption that comparison tools are logically irrelevant to optimism. Specifically, participants might have assumed that the researchers who prepared the study picked a set of possible tools that offered general probabilities of success that were spread roughly evenly across the 0-100% spectrum. If participants believed there were two tools in the set, they might have assumed one of the tools offered less than a 50% chance of success while the other offered greater than a 50% chance. By seeing a comparison tool, they could make a probabilistic inference about their own tool. For example, if they believed the comparison tool was better than theirs, they could assume that the general level of probability associated with their tool was below 50%. Related inferences would have similar implications even if people assume there were three tools.9 These types of inferences are not illogical, and Studies 1-5 did not rule them out. Study 6 addressed this issue.
Study 6 used the same general paradigm as Study 5 with some changes. Participants again saw two tools per task — the comparison tool and the target tool. The target tool was again always the medium-sized tool. This time, participants were informed that there were three possible tools. Critically, we used a number-label system to make participants aware of the relative standing of any tool within its set of three tools. When participants were estimating their chance of success with the target tool, they were aware that, in the full tool set, there was both a better and worse tool than that target tool. This neutralizes the ability of logical probabilistic inferences to explain any comparison effects we might observe. We predicted that the contrast effects seen in our previous studies would continue to be observed in Study 6.
The participants were 61 undergraduate students (48 female, 13 male;
Mage=19.41,
SDage=3.10). The study’s
preregistration can be viewed on the Open Science Framework
(https://osf.io/s543y/?view_only=734ae259ae2542c48c5b27ba9deeb131).
The sample-size goal was 100 participants, but the coronavirus epidemic
that hit the U.S. in 2020 required a suspension of data collection after
61 participants. Because the suspension was estimated to last at least
several months, we decided to analyze the available data. Our sample size
afforded >97% power to detect a medium-size difference
(d=0.50) for a within-subject comparison between upward and
downward conditions (Faul et al., 2009).
The study was a two-cell, within-subject design involving two tasks. The assignment of which task was used for the upward or downward condition was counterbalanced across the sample.
The tasks and procedures were identical to those in Study 5, except as noted. First, we only used Tasks 1 and 2. Second, the video introduction included important additional information. It explicitly informed participants that there was a total of three tools for each task. A graphic showed the words “Tool 1,” “Tool 2,” and “Tool 3” with font sizes that increased from 1 to 3. Tool 1 was said to always be the “smallest,” with Tool 2 being “larger,” and Tool 3 the “largest.” A picture of the three tools for an unused task (Task 3 from earlier studies) was shown to further emphasize that Tool 1 was the smallest, Tool 2 was larger, and Tool 3 was the largest. As in Study 5, participants were told they would attempt each task twice, once with each of two tools “randomly selected” from the three tools. Third, in large numbering, we printed the respective number (“1,” “2,” or “3”) on all tools (smallest, medium, largest, respectively). The last change was the addition of awareness checks at the end of the study. The two checks that were described in the preregistration as criteria for inclusion were the following: 1) “This question is about Ball 2. Considering all 3 balls, is Ball 2 the smallest, medium, or largest?” 2) “This question is about Fan 2. Considering all 3 fans, is Fan 2 the smallest, medium, or largest?”
As in Study 5, participants always received the medium tool (“Tool 2”) for a given task, and they received an upward tool for one task and a downward tool for the other task (counterbalanced). Both numeric and verbal likelihood judgments were again solicited.
Our interest was again on people’s optimism about the target tool (i.e., Tool 2). However, to rule out logical probabilistic inferences as key drivers of any observed contrast effects, we needed to be sure that participants understood that Tool 2 was always intermediate in size between the other two tools on a given task. Analyses of awareness checks showed good understanding. Specifically, 57 out of 61 participants correctly answered both of the preregistered awareness checks (i.e., they indicated that for both tasks, Tool 2 was the medium tool). As specified in the preregistration, for our main analyses below we excluded data from the four participants who failed the awareness checks.
The results replicated our prior findings. The comparison tool again had a contrast effect on participants’ optimism about successfully completing a task with Tool 2. People reported a higher numeric likelihood of being successful in the downward (M=63.86%, SD=15.56%) than upward condition (M=51.93%, SD=14.93%), t(56)=4.36, p<.001, d=0.58, 95% CI [6.45, 17.41]. Verbal likelihood estimates also revealed that people were more optimistic in the downward (M=4.81, SD=1.71) than upward condition (M=3.88, SD=1.24), t(56)=4.29, p<.001, d=0.57, 95% CI [.50, 1.36]. The counterbalancing did not interact with the results (ps >.74). Given that these findings are from participants who were aware that the target tool (Tool 2) was intermediate between two other tools, the contrast effects cannot be explained by the logical-probabilistic-inference account that inspired this study.
We conducted six studies, each involving 2-4 tasks in which participants were given a tool for their attempt. For each task, an additional tool was also made salient. Although the additional tool was not directly relevant to participants’ individual performance, the additional tool was not ignored. It served as a comparison and produced contrast effects on participants’ expectations and decisions. In Study 1, the additional tool was essentially part of a social comparison since it was assigned to a confederate. We found that participants were more optimistic about their likelihood of success and willing to bet more money when the confederate received a tool that was worse vs. better than theirs. In Study 2, we found the same effects for non-social, counterfactual situations in which the additional tool was a tool to which the participant might have been assigned, but was not. In Studies 3 and 4, a lateral-comparison condition was used to examine the symmetry/asymmetry of the contrast effects in social and non-social comparison situations, respectively. The results suggested that both upward and downward comparisons influence optimism and relevant decisions. Study 5 established that comparisons do not need to be counterfactual to drive contrast effects. Even when participants knew they would use each of the two tools, their optimism about success with one tool was biased by the quality of the other tool. Study 6 addressed an alternative, logical-inference explanation for the contrast effects we observed.
Overall, we found consistent results across various types of dependent measures related to expectations about success at the tasks. The presence of a more or less useful tool influenced not only people’s judgments of the likelihood of successfully completing the tasks but also their behavioral decisions. Although the contrast effects detected with verbal likelihood judgments could be interpreted as judgment-scaling effects (and this could arguably be applied to numeric likelihood judgments and hypothetical bets too), the fact that we found evidence of contrast effects on the pick-task decisions allows us to dismiss the idea that the effects are merely due to scaling effects (Biernat et al., 1997; Manis & Armstrong, 1971; Parducci, 1965; Sherman et al., 1978). In the pick-task decisions, participants selected the task for which their performance would determine whether they would be awarded a prize. From the perspective of self-handicapping and attributional ambiguity, participants might have had a reason to pick a task in which their tool was worse than the comparison tool, because this would lend attributional flexibility if they failed (Jones & Berglas, 1978; Major, 2007). However, participants selected the task in which their tool was better than the comparison tool, suggesting that the comparison tool truly altered their internal confidence and led them to feel more optimistic about task success.
All of these findings also mean that participants did not use intuitive correction processes to fully undo the impact of exposure to a salient comparison tool. Flexible-correction models of judgment provide a plausible rational for why the current studies might have yielded null effects or even assimilation effects (Wegner & Petty, 1995; Wilson & Brekke, 1994). It is possible that participants engaged in some corrective processes that dampened the size of the observed contrast effects but did not erase them. If so, this failure could be due to misjudging the impact of the comparison (and hence the amount of adjustment needed) or a lack of motivation to fully adjust.
An important feature of this work was that the tasks were real and immediately impending, not hypothetical or in a distant future. Asking for predictions about hypothetical tasks could lead to findings of bias that do not materialize under non-hypothetical conditions. For example, Armor and Sackett (2006) compared people’s predictions for hypothetical and real versions of the same tasks, and found that although people exhibited unrealistic optimism regarding hypothetical versions, expectations for real versions were less optimistic and sometimes quite accurate.
Our results also offer a counterpoint to results from a somewhat related project—mentioned in Footnote 1—that examined the impact of social comparisons on expectations for an impending task (Moore & Klein, 2008). That project found no evidence that social comparisons produced contrast effects on expectations about whether a person would have success at meeting an absolute score threshold. Exactly why our studies and theirs produced different conclusions is hard to determine because of multiple paradigm differences. Their social comparative information 1) had nothing to do with tools, 2) was in the form of numeric percentile scores, and 3) referenced a group rather than a singular referent (i.e., participants learned where their initial score placed them relative to other students at the same school). Irrespective of which of these or other differences account for the discrepant conclusions of the two projects, our findings provide clear evidence that comparisons can affect expectations about an immediately impending task.
There are pragmatic consequences of being overconfident or underconfident on actual impending tasks. For example, miscalibrated confidence can lead to poor decisions (e.g., letting doubts keep you from starting an endeavor that actually has high likelihood of success, driving into a snowstorm that you are bound to get stuck in). Within the current studies, the fact that participants let comparisons influence their choice of task to perform for a prize presumably resulted in suboptimal choices, thereby reducing the actual likelihood of receiving the prize. We say “presumably” because we did not formally record performances (see Footnote 4). Future research would be required to more fully establish the applied ramifications of tool-comparison effects on immediate outcomes.
There are a number of additional moderator questions whose answers would shed light on the generalizability of the findings. For example, would the influence of comparison tools on optimism decline if people already had experience with the focal tool? It might be the case that the influence is reduced when people do have experience with the specific tool applied to the exact task in question. Even if this is the case, we note that people often need to use tools for tasks that are entirely new or partially new. Uncertainty in the difficulty of the task might be enough (even with a familiar tool) to allow comparison tools to have an impact on optimism.
The results from the present studies have general relevance to two findings in a recent meta-analysis of social comparison research (Gerber et al., 2018). First, although comparisons can lead to either assimilation or contrast, the most prevalent outcome in social comparisons studies that were meta-analyzed was contrast effects. In our paradigm, we also observed similar contrast effects, perhaps because participants’ tools were distinctly different from those of the comparison referent (Wedell et al., 2007). Second, upon analyzing the very limited number of studies that included a control condition, Gerber and colleagues (2018) tentatively suggested that both upward and downward comparisons led to contrast. Taken together, our Studies 3-5 also showed contrast effects from both upward and downward comparisons. Although our findings fall in line with the general conclusions from the meta-analysis, we note that the social comparison studies in the meta-analysis had different outcome measures (i.e., did not measure expectations and decisions about impending tasks). Therefore, our findings expand the scope of conclusions discussed in Gerber et al. (2018).
With that said, we emphasize that the effects detected here were not restricted to social comparison situations. Whether the additional tool was held by another person (Studies 1 and 3), was a counterfactual tool (Studies 2 and 4) or was a second tool that would also be used by the participant (Studies 5 and 6), contrast effects occurred. The existence of the effects even in Studies 5 and 6 suggests that the findings in all the studies are driven by basic processes operating on expectation formation. Support theory, a prominent theory of how people estimate subjective probability, assumes that people compare the perceived evidence or support for a focal outcome against the support for the alternative to the focal outcome (Tversky & Koehler, 1994). Without additional stipulations, support theory would not anticipate the present findings. The theory would simply suggest that people compare support for successfully completing the task with support for failing at the task; support for succeeding or failing with an alternative tool would have no role in the judgment process. However, one could stipulate that salient comparisons (i.e., the alternative tool) may impact the assessed levels of evidence or support before those assessments are used in the estimation of subjective likelihoods (see Windschitl & Chambers, 2004). With this added stipulation, the present results are compatible with support theory.
In the tool-use literature, simulations are assumed to be part of the process by which people gauge the actions and effort needed for success with a tool (Osiurak, 2014). In the broader literature in judgment and decision making, it is assumed that running simulations is a means for judging likelihoods (Kahneman & Tversky, 1982). To assess the likelihood of success on a task, such as the ones we used here, people might imagine or mentally simulate the process by which they would use their particular tool within physical realities of the task (recall that a videotaped actor illustrated the general action that would be executed with a tool, but no tool was held for the illustration). For example, a person might imagine how they would stretch far with one hand out and use wrist action to create wind with the fan in an attempt to knock down blocks. In such mental simulations, we suggest that people do not isolate themselves, their tool, and the task materials for running the simulations and formulating an estimate. At some level, they also assess the general usefulness of the tool for the task, and this assessment is biased by contextual comparisons. It is not clear if the biased evaluation of usefulness changes participants’ visual simulations of themselves using their tool, but it is clear that the bias somehow ultimately shapes optimism and relevant decisions. This influence of contextual elements is likely to be important for research on how people estimate the potential efficiency benefits of tools (e.g., Osiurak et al., 2014).
The question of “Can I do it?” is often really “Can I do it with the tool(s) I have?” Our findings suggest that one’s confidence about success does not just depend on the tools one has, but also other tools. These might be tools that are currently available to others, tools that might have been available but are not, or even tools that will be available on a next attempt. In all these cases, the better (or worse) the other tools, the less (more) likely one’s success might seem. One intriguing implication of these results is that people may tend to be systematically overoptimistic with the best tools that are available, because only downward comparisons exist for those tools. In specific cases like Julia’s from our opening example, a chance exposure to one salient comparison could lure one into a bad decision. Julia may indeed be falsely confident about her snowy trip in her Honda Civic, if it just happens to be parked next to a car that would fare even worse.
Biernat, M., & Billings, L. S. (2001). Standards, expectancies, and social comparison. In A. Tesser & N. Schwarz (Eds.), Blackwell handbook of social psychology: Intraindividual processes (pp. 257–283). London: Blackwell.
Biernat, M., Manis, M., & Kobrynowicz, D. (1997). Simultaneous assimilation and contrast effects in judgments of self and others. Journal of Personality and Social Psychology, 73, 254–269. http://dx.doi.org/10.1037/0022-3514.73.2.254
Bless, H., & Schwarz, N. (2010). Mental construal and the emergence of assimilation and contrast effects: The inclusion/exclusion model. In M. P. Zanna (Ed.), Advances in experimental social psychology, (Vol. 42, pp. 319-373). San Diego, CA: Academic Press.
Brown, J. D., Novick, N. J., Lord, K. A., & Richards, J. M. (1992). When Gulliver travels: Social context, psychological closeness, and self-appraisals. Journal of Personality and Social Psychology, 62, 717–727. http://dx.doi.org/10.1037/0022-3514.62.5.717
Bruchmann, K. (2017). Compared to what? The importance of control groups in social comparison research. Basic and Applied Social Psychology, 39, 91–100. http://dx.doi.org/10.1080/01973533.2017.1281808
Chambers, J. R., & Windschitl, P. D. (2009). Evaluating one performance among others: The influence of rank and degree of exposure to comparison referents. Personality and Social Psychology Bulletin, 35, 776–792. http://dx.doi.org/10.1177/0146167209333044
Chien, Y. W., Wegener, D. T., Petty, R. E., & Hsiao, C. C. (2014). The flexible correction model: Bias correction guided by naïve theories of bias. Social and Personality Psychology Compass, 8, 275–286. http://dx.doi.org/10.1111/spc3.12105
Coren, S., & Enns, J. T. (1993). Size contrast as a function of conceptual similarity between test and inducers. Perception & Psychophysics, 54, 579–588. http://dx.doi.org/10.3758/BF03211782
Davoli, C. C., Brockmole, J. R., & Witt, J. K. (2012). Compressing perceived distance with remote tool-use: Real, imagined, and remembered. Journal of Experimental Psychology: Human Perception and Performance, 38, 80–89. http://dx.doi.org/10.1037/a0024981
Fagerline, A., Zikmund-Fisher, B. J., & Ubel, P. A. (2007). “If I’m better than average, then I’m ok?”: Comparative information influences beliefs about risk and benefits. Patient Education and Counseling, 69, 140–144. http://dx.doi.org/ 10.1016/j.pec.2007.08.008
Faul, F., Erdfelder, E., Buchner, A., & Lang, A.G. (2009). Statistical power analyses using G*Power 3.1: Tests for correlation and regression analyses. Behavior Research Methods, 41, 1149–1160. http://dx.doi.org/10.3758/BRM.41.4.1149
French, D. P., Hevey, D., Sutton, S., Kinmonth, A. L., & Marteau, T. M. (2006). Personal and social comparison information about health risk: Reaction to information and information search. Journal of Health Psychology, 11, 497–510.http://dx.doi.org/10.1177/1359105306063324
Gerber, J. P., Wheeler, L., & Suls, J. (2018). A social comparison theory meta-analysis 60+ years on. Psychological Bulletin, 144, 177–197. http://dx.doi.org/10.1037/bul0000127
Gibson, J. J. (1979). The ecological approach to visual perception. Boston, MA: Houghton Mifflin Co.
Helson, H. (1964). Adaptation-level theory: An experimental and systematic approach to behavior. New York: Harper and Row.
Herr, P. M., Sherman, S. J., & Fazio, R. H. (1983). On the consequences of priming: Assimilation and contrast effects. Journal of Experimental Social Psychology, 19, 323–340. http://dx.doi.org/10.1016/0022-1031(83)90026-4
Higgins, E. T., & Lurie, L. (1983). Context, categorization, and recall: The "change-of-standard" effect. Cognitive Psychology, 15, 525–547. http://dx.doi.org/10.1016/0010-0285(83)90018-X
Jesteadt, W., Luce, R. D., & Green, D. M. (1977). Sequential effects in judgments of loudness. Journal of Experimental Psychology: Human Perception and Performance, 3, 92–104. http://dx.doi.org/10.1037/0096-1523.3.1.92
Jones, E. E., & Berglas, S. (1978). Control of attributions about the self through self-handicapping strategies: The appeal of alcohol and the role of underachievement. Personality and Social Psychology Bulletin, 4, 200–206. http://dx.doi.org/10.1177/014616727800400205
Kahneman, D., & Tversky, A. (1982). The simulation heuristic. In D. Kahneman, P. Slovic, & A. Tversky (Eds.). Judgment under Uncertainty: Heuristics and Biases (pp. 201-208). Cambridge, England: Cambridge University Press.
Kassam, K. S., Morewedge, C. K., Gilbert, D. T., & Wilson, T. D. (2011). Winners love winning and losers love money. Psychological Science, 22, 602–606. http://dx.doi.org/10.1177/0956797611405681
Klein, W. M. P. (2003). Effects of objective feedback and “single other” or “average other” social comparison feedback on performance judgments and helping behavior. Personality and Social Psychology Bulletin, 29, 418–429. http://dx.doi.org/10.1177/0146167203251195
Loersch, C., & Payne, B. K. (2011). The situated inference model: An integrative account of the effects of primes on perception, behavior, and motivation. Perspectives on Psychological Science, 6, 234–252. http://dx.doi.org/10.1177/1745691611406921
Major, B. (2007). Attributional ambiguity. In R. F. Baumeister & K. D. Vohs (Eds.), Encyclopedia of social psychology (Vol. 1, pp. 73–74). Thousand Oaks, CA: SAGE Publications, Inc.
Manis, M., & Armstrong, G. W. (1971). Contrast effects in verbal output. Journal of Experimental Social Psychology, 7, 381–388. http://dx.doi.org/10.1016/0022-1031(71)90072-2
Markman, K. D., & McMullen, M. N. (2003). A reflection and evaluation model of comparative thinking. Personality and Social Psychology Review, 7, 244–267. http://dx.doi.org/ 10.1207/S15327957PSPR0703\_04
Matthews, W. J., & Stewart, N. (2009). Psychophysics and the judgment of price: Judging complex objects on a non-physical dimension elicits sequential effects like those in perceptual tasks. Judgment and Decision Making, 4, 64–81.
Medvec, V. H., Madey, S. F., & Gilovich, T. (1995). When less is more: Counterfactual thinking and satisfaction among Olympic medalists. Journal of Personality and Social Psychology, 69, 603–610. http://dx.doi.org/10.1037/0022-3514.69.4.603
Moore, D. A., & Klein, W. M. P. (2008). Use of absolute and comparative performance feedback in absolute and comparative judgments and decisions. Organizational Behavior and Human Decision Processes, 107, 60–74. http://dx.doi.org/10.1016/j.obhdp.2008.02.005
Morewedge, C. K., Zhu, M., & Buechel, E. C. (2018). Hedonic contrast effects are larger when comparisons are social. Journal of Consumer Research, 46, 286–306. http://dx.doi.org/10.1093/jcr/ucy070
Morse, S., & Gergen, K. J. (1970). Social comparison, self- consistency, and the concept of self. Journal of Personality and Social Psychology, 16, 148–156. http://dx.doi.org/ 10.1037/h0029862
Mussweiler, T. (2003). Comparison processes in social judgment: Mechanisms and consequences. Psychological Review, 110, 472–489. http://dx.doi.org/ 10.1037/0033-295X.110.3.472
Mussweiler, T., Rüter, K., & Epstude, K. (2004). The ups and downs of social comparison: Mechanisms of assimilation and contrast. Journal of Personality and Social Psychology, 87, 832–844. http://dx.doi.org/10.1037/0022-3514.87.6.832
Mussweiler, T., & Strack, F. (2000). The “relative self”: Informational and judgmental consequences of comparative self-evaluation. Journal of Personality and Social Psychology, 79, 23–38. http://dx.doi.org/ 10.1037//0022-3514.79.1.23
Olson, J. M., Buhrmann, O., & Roese, N. J. (2000). Comparing comparisons: An integrative perspective on social comparison and counterfactual thinking. In J. Suls & L. Wheeler (Eds.). Handbook of social comparison: Theory and research (pp. 379-398). Dordrecht, Netherlands: Kluwer Academic Publishers.
Osiurak, F. (2014). What neuropsychology tells us about human tool use? The four constraints theory (4CT): mechanics, space, time, and effort. Neuropsychology Review, 24, 88–115. http://dx.doi.org/10.1007/s11065-014-9260-y
Osiurak, F., & Badets, A. (2016). Tool use and affordance: Manipulation-based versus reasoning-based approaches. Psychological Review, 123, 534–568. http://dx.doi.org/ 10.1037/rev0000027
Osiurak, F., Jarry, C., & Le Gall, D. (2010). Grasping the affordances, understanding the reasoning: toward a dialectical theory of human tool use. Psychological Review, 117, 517–540. http://dx.doi.org/10.1037/a0019004
Osiurak, F., Morgado, N., Vallet, G. T., Drot, M., & Palluel-Germain, R. (2014). Getting a tool gives wings: overestimation of tool-related benefits in a motor imagery task and a decision task. Psychological Research, 78, 1–9. http://dx.doi.org/10.1007/s00426-013-0485-9
Osiurak, F., Navarro, J., Reynaud, E., & Thomas, G. (2018). Tools don’t—and won’t—make the man: A cognitive look at the future. Journal of Experimental Psychology: General, 147, 782–788. http://dx.doi.org/ 10.1037/xge0000432
Parducci, A. (1965). Category judgment: A range-frequency model. Psychological Review, 72, 407–418. http://dx.doi.org/10.1037/h0022602
Petty, R. E., & Wegener, D. T. (1993). Flexible correction processes in social judgment: Correcting for context-induced contrast. Journal of Experimental Social Psychology, 29(2), 137–165. https://doi.org/10.1006/jesp.1993.1007.
Roese, N. J. (1997). Counterfactual thinking. Psychological Bulletin, 121, 133–148. http://dx.doi.org/10.1037/0033-2909.121.1.133
Sherman, S. J., Ahlm, K., Berman, L., & Lynn, S. (1978). Contrast effects and their relationship to subsequent behavior. Journal of Experimental Social Psychology, 14, 340–350. http://dx.doi.org/10.1016/0022-1031(78)90030-6
Stevens, S. S. (1958). Adaptation-level vs. the relativity of judgment. American Journal of Psychology, 71, 633–646. http://dx.doi.org/10.2307/1420322
Suls, J., & Wheeler, L. (2007). Psychological magnetism: a brief history of assimilation and contrast in psychology. In D. A. Stapel, & J. Suls (Eds.). Assimilation and Contrast in Social Psychology (pp. 9–44). New York: Psychology Press.
Tversky, A., & Koehler, D. J. (1994). Support theory: A nonextensional representation of subjective probability. Psychological Review, 101, 547–567. http://dx.doi.org/10.1037/0033-295X.101.4.547
Upshaw, H. S. (1969). The persona1 reference scale: An approach to social judgment. In L. Berkowitz (Ed.). Advances in experimental social psychology (Vol. 4, pp. 315-371). New York: Academic Press.
Virgo, J., Pillon, J., Navarro, J., Reynaud, E., & Osiurak, F. (2017). Are you sure you’re faster when using a cognitive tool?. American Journal of Psychology, 130, 493–503. http://dx.doi.org/10.5406/amerjpsyc.130.4.0493
Wedell, D. H., Hicklin, S. K., & Smarandescu, L. O. (2007). Contrasting models of assimilation and contrast. In D. A. Stapel & J. Suls (Eds.). Assimilation and contrast in social psychology (pp. 45–74). New York: Psychology Press.
Wegener, D. T., & Petty, R. E. (1995). Flexible correction processes in social judgment: The role of naive theories in corrections for perceived bias. Journal of Personality and Social Psychology, 68(1), 36–51. https://doi.org/10.1037/0022-3514.68.1.36.
Wilson, T. D., & Brekke, N. (1994). Mental contamination and mental correction: Unwanted influences on judgments and evaluations. Psychological Bulletin, 116(1), 117–142. https://doi.org/10.1037/0033-2909.116.1.117.
Windschitl, P. D. (2002). Judging the accuracy of a likelihood judgment: The case of smoking risk. Journal of Behavioral Decision Making, 15, 19–35. http://dx.doi.org/10.1002/bdm.401
Windschitl, P. D., & Chambers, J. R. (2004). The dud-alternative effect in likelihood judgment. Journal of Experimental Psychology: Learning, Memory, and Cognition, 30, 198–215. http://dx.doi.org/10.1037/0278-7393.30.1.198
Windschitl, P. D., Martin, R., & Flugstad, A. R. (2002). Context and the interpretation of likelihood information: The role of intergroup comparisons on perceived vulnerability. Journal of Personality and Social Psychology, 82, 742–755. http://dx.doi.org/10.1037/0022-3514.82.5.742
Witt, J. K., & Proffitt, D. R. (2008). Action-specific influences on distance perception: A role for motor simulation. Journal of Experimental Psychology: Human Perception and Performance, 34, 1479–1492. http://dx.doi.org/10.1037/a0010781
Witt, J. K., Proffitt, D. R., & Epstein, W. (2005). Tool use affects perceived distance, but only when you intend to use it. Journal of Experimental Psychology: Human Perception and Performance, 31, 880–888. http://dx.doi.org/10.1037/0096-1523.31.5.880
Wood, J. V. (1989). Theory and research concerning social comparisons of personal attributes. Psychological Bulletin, 106, 231–248. http://dx.doi.org/10.1037/0033-2909.106.2.231
Wundt, W. (1894). Lectures on human and animal psychology (J. E. Creighton & E. B. Titchner, Trans.). London: Swan Sonnenschein.
Zell, E., & Alicke, M. D. (2010). The local dominance effect in self-evaluation: Evidence and explanations. Personality and Social Psychology Review, 14, 368–384. http://dx.doi.org/10.1177/1088868310366144
This document was translated from LATEX by HEVEA.