Judgment and Decision Making, Vol. 15, No. 1, January 2020, pp. 93-111
The false allure of fast luresYigal Attali* Maya Bar-Hillel# |
The Cognitive Reflection Test (CRT) allegedly measures the tendency to override the prepotent incorrect answers to some special problems, and to engage in further reflection. A growing literature suggests that the CRT is a powerful predictor of performance in a wide range of tasks. This research has mostly glossed over the fact that the CRT is composed of math problems. The purpose of this paper is to investigate whether numerical CRT items do indeed call upon more than is required by standard math problems, and whether the latter predict performance in other tasks as well as the CRT. In Study 1 we selected from a bank of standard math problems items that, like CRT items, have a fast lure, as well as others which do not. A 1-factor model was the best supported measurement model for the underlying abilities required by all three item types. Moreover, the quality of all these items – CRT and math problems alike – as predictors of performance on a set of choice and reasoning tasks did not depend on whether or not they had a fast lure, but rather only on their quality as math items. In other words, CRT items seem not to be a “special” category of math problems, although they are quite excellent ones. Study 2 replicated these results with a different population and a different set of math problems.
Keywords: dual-system theories, CRT, rational thinking, mathematical ability
The cognitive reflection test (CRT) is a set of three problems presented by Frederick (2005) as measuring “the ability or disposition to resist reporting the response that first comes to mind” (p. 35). Similarly, Cokely and Kelley (2009) associated the CRT with reflectiveness — careful, thorough, and elaborative cognition. It is also somewhat related to the concept of actively open-minded thinking (Baron, 2019; Campitelli & Labollita, 2010), which is a set of beliefs that it is good to question initially favored conclusions. Toplak, West, and Stanovich (2011) proposed that the CRT measures a distinct rational thinking cognitive ability.
CRT items have played a role in hundreds, if not thousands, of studies since 2005. Although their format and underlying structure is similar to other mathematical word problems, most researchers have not explicitly addressed the possibility that the CRT could simply be measuring mathematical problem solving ability (but see Baron, Scott, Fincher, & Metz, 2015; Frederick, 2005). This possibility seems to be rejected on the basis of the “consensus that CRT problems, unlike other mathematical problems, trigger an automatic response, which is then inhibited or not, and only if inhibition is successful would individuals use their mathematical knowledge to solve the problems” (Campitelli & Gerrans, 2014, p. 435).
Still, a few studies did consider the relation between the CRT and numeracy — i.e., the ability to reason and to apply simple numerical concepts. Liberali, Reyna, Furlan, Stein, and Pardo (2012) administered the 3 original CRT items together with numeracy items (such as, “If the chance of getting a disease is 20 out of 100, this would be the same as having a ____% chance of getting the disease”) and conducted exploratory factor analysis (EFA) on data from two samples of respondents. Results were mixed. In a sample of Brazilian students, the 11 numeracy items loaded on four different factors and the three CRT items loaded on one of them. In a sample of US students, the 11 numeracy items were distributed across six factors whereas the CRT items loaded on a separate factor. Weller et al. (2013) administered the CRT items together with 15 numeracy items and compared the fit of two confirmatory factor analysis (CFA) models: a 1-factor model including both kinds of items, and a 2-factor model, one of which was defined by the CRT items and the other by the numeracy items. CFA offers a much stronger analytic approach than EFA for investigating the construct validity of measures (Brown, 2014). The fit of both models was mediocre. But, importantly, the fit of the 2-factor model was not better than the 1-factor model, suggesting that CRT items measure the same underlying construct as numeracy items.
A different line of research (Böckenholt, 2012; Campitelli & Gerrans, 2014; Sinayev & Peters, 2015) acknowledges that the CRT items require mathematical knowledge to reach the correct answer, and attempts to separate the effects of reflection from mathematical knowledge by modeling the response process as consisting of two stages. In the first stage, respondents automatically arrive at an intuitive, but incorrect, response. If inhibitory control is exercised to suppress this response, then deliberate processing requiring mathematical knowledge occurs; and, depending on its success, either the correct or other incorrect responses are reached. Böckenholt (2012) proposed a psychometric item response theory (IRT) model that estimates two latent person abilities: one for inhibitory control, responsible for the result of stage 1, and another for deliberate numerical processing, responsible for stage 2. He reports satisfactory fit for this 2-factor model, but that a simpler 1-factor model also had satisfactory fit. Campitelli and Gerrans (2014) also found that a 2-factor model had better fit than a 1-factor model, but the degree of overlap between the two latent abilities was not analyzed, nor was the predictive validity of these latent abilities. Sinayev and Peters (2015), employing the same two-process model suggested by Böckenholt (2012), similarly found that the 2-factor model fit the data better than the 1-factor model. However, in testing the predictive validity of the two types of ability, they found that the inhibitory control ability (from stage 1) was not a significant predictor of various decision tasks beyond the deliberate numerical processing ability (stage 2), and beyond separate numeracy scores (based on a 6-item scale). With some tasks only numeracy was a significant predictor of performance.
Travers, Rolison and Feeney (2016) investigated the possibility of a two-stage process in solving CRTs using a totally different methodology — online mouse tracking. To the original 3 CRT items they added 5 items adapted fom Primi, Morsanyi, Chiesi, Donati and Hamilton (2016). By changing the numbers, they created variants in which the correct answer was also the intuitive answer. Their analysis “revealed that participants were initially drawn towards the incorrect…option even when the correct…option was ultimately chosen” (p. 109) — but not vice versa.
Finally, Baron et al. (2015) explored (Studies 3 and 5) the role of the intuitive lure in CRT-type items. By changing the numbers, they created more difficult variants of the CRT items that had no lure, fast or slow, but rather require reflection. In an exploratory factor analysis, they found that items tended to cluster based on content rather than on existence of lure, and indeed CRT versions with and without lure had similar correlations with endorsement of actively open-minded thinking and with measures of logical reasoning (with and without lures).
In summary, only a handful of studies investigated the relationship between the CRT and numeracy constructs. Studies that investigated the factor structure of CRT and numeracy items found mixed results (Baron et al., 2015; Liberali et al., 2012; Weller et al., 2013). Several studies found that a separation of CRT responses into two sub-scores, one for reflection and one for deliberate (numerical) processing, resulted in better fit than the traditional single score that is computed from CRT responses — although the predictive validity of the reflection score was later called into doubt (Sinayev & Peters, 2015). Travers et al. (2016) used mouse-tracking data to find support for CRT solving as a process of overriding initial error. In any case, this type of modeling does not have direct bearing on the question of what CRT scores measure in practice, because (traditional) CRT scores do not take into account the type of error given, but only whether the answer is correct or not. In other words, the reflection sub-score was never the basis for the claims made about the CRT.
CRT items are certainly different from typical numeracy items. Numeracy items involve simpler mathematical knowledge and concepts than those required to solve CRT items, and consequently are much easier overall. For example, in Weller et al. (2013), the median score on the Objective Numeracy Scale (Lipkus, Samsa, & Rimer, 2001) was 9 (of 11), but the median CRT score was 0 (of 3). All items on the numeracy scale are concerned only with straightforward conversions between probabilities and relative frequencies (e.g., the first item reads “Imagine that we roll a fair, six-sided die 1000 times. Out of 1000 rolls, how many times do you think the die would come up even [2, 4, or 6]?”).
In contrast, the bat-&-ball is a word problem with two unknowns; the widgets concerns work-per-time, namely is a rate problem; and the lily-pads is a problem of exponential growth. These are typical quantitative reasoning (Carroll, 2012) problems, such as found at the heart of the mathematics curriculum in middle school and junior high school. They are also the kinds of items that can be found in the quantitative reasoning sections of college admissions assessments, such as the SAT and GRE General test. Indeed, some researchers have turned CRT items into ordinary math word problems by keeping the cover story, and changing only the numbers so that there was no longer a fast lure. Baron et al. (2015) developed items that could be solved correctly only by doing the math, and so were approximately as difficult as the original CRT items. Travers et al. (2016) developed items in which the answer that comes quickly to mind is also the correct answer, and so were easier.
One might argue that the defining characteristic of CRT items, and what is supposed to make them both unique and distinct from other problems — including typical math reasoning ones — is that an intuitive and attractive lure presents itself immediately to many if not most problem solvers. But of course, all math problems vary with respect to the ease and rapidity with which possible answers come to mind as one attempts to solve them. With some problems (e.g., multi-digit multiplication, such as “297x34=?”), no answer spontaneously presents itself to most people during the computational process. With other problems (e.g., “What is the next prime number after 73?”), candidate answers do present themselves in the course of addressing the problem, and solvers must reflect on each, using their mathematical knowledge (“75? Nah. 77? Nah. 79? Maybe, let’s check.”). Moreover, even with the multiplication problem above, once an answer is reached, solvers still have to decide whether or not to further reflect on its accuracy (applying the maxim “check your answer!”). In this respect, every mathematical (and other cognitive) problem involves some degree of reflectiveness. The CRT may lie at the extreme of the reflectiveness continuum, but that needn’t make it unique. “Intelligence, considered as a mental trait, is the capacity to make impulses focal at their early, unfinished stage of formation. Intelligence … is an inhibitory process.” (Thurstone, 1924, p. 159)
To reiterate, although CRT items resemble other math word problems, the existence of an intuitive and attractive lure is seemingly a unique feature, alleged to make these items distinct from other more mundane math problems in their measurement properties. The present study questions this assumption. We seek to investigate whether CRT items are not really a special class unto themselves, but rather: (a) their defining characteristic (a fast lure) is shared by some standard math problems; (b) they essentially measure the same underlying ability as other math problems, with or without a fast lure; and (c) anything that can be done with CRT items can be done with comparable (in some appropriate sense to be explicated), but quite ordinary, math problems. In other words, the existence of an attractive lure is not enough to make CRT items distinct from other math items in terms of what they measure, or superior in predicting external criteria.
For this purpose, we needed to procure a suitable set of “ordinary” math items for comparison. The items we chose were originally developed for a well-known high-stakes standardized test commonly used for graduate-level admissions. One of the components of the test measures quantitative problem-solving ability, using concepts of Arithmetic, Algebra, Geometry and Data Analysis. A set of 365 publicly disclosed quantitative problems for the test had been piloted as part of a research study using students preparing for the operational test (Attali & van der Kleij, 2017). Hence, these problems already had a lot of respondent data associated with them. From these problems, we selected six with a fast lure and twelve more with no fast lure. Importantly, selection was not based on the quality of the items as evidenced by their psychometric discrimination, and in effect, the items selected were of average quality. To these 18 items, we added six previously published CRT items, to create a set of 24 items. The selection details are described in the Method section below.
The CRT literature maintains that CRT items, and possibly other math items with a fast lure, measure an underlying ability that is distinct from the ability measured by lureless math items. These two abilities might certainly be correlated (most cognitive abilities are), but they are not identical. In contrast, we hypothesize a more parsimonious theory, maintaining that all 24 items we chose measure a single underlying ability, namely mathematical ability.
These competing theories correspond to two alternative measurement models, which describe the relationship between observed measures, or indicators, and the latent abilities, or factors, underlying them. CFA is the primary tool for testing the validity of such theories and hence for comparing competing ones. In CFA, every aspect (i.e., parameter) of the measurement model is specified in advance, and the acceptibility of the model is evaluated by goodness-of-fit estimates. For example, in the present context, the difference between the two competing theories boils down to a single parameter: the correlation between the two factors. Under the 2-factor model, this correlation is freely estimated from the data, whereas the 1-factor model is mathematically equivalent to a 2-factor model where the correlation between the two factors is set to 1.
In addition to an investigation of the two alternative measurement models, we asked whether standard math problems predict performance in other tasks as well as the CRT. To this end we assembled a battery of reasoning and choice tasks that were previously used to validate the predictive power of the CRT and investigated the quality of CRT as well as math problems as predictors of performance on the reasoning and choice tasks.
Respondents were 252 Amazon’s Mechanical Turk workers who were paid $10 for their participation (five additional participants did not finish the session). Data was collected on Monday morning, Feb. 25, 2019. Respondents were given 2 hours to complete the session, and spent a median duration of 40 minutes at it. Ages ranged from 21 to 70 years (M = 35, SD = 9), 41% were women, and 88% declared at least some college education.
Not many CRT items have been used to date in published empirical research. Many studies used only Frederick’s (2005) original three items. Some (e.g., Finucane & Gullion, 2010) developed their own variants of the three items, mathematically isomorphic to the originals, but with a different cover story and different numbers, which others then also used (e.g., Baron et al., 2015). This strategy of developing variants is used and endorsed by Frederick himself (e.g., Primi et al., 2016; Frederick, personal communication, 2019). We count a single CRT and its variants as one; namely, we count CRT items by type, not by token. Finally, some authors invented their own CRTs (e.g., Toplak, West, & Stanovich, 2014). Our set of six CRT-like items was used by Toplak et al. (2014), which consist of Finucane and Gullion’s variants, plus three other CRT-like items with numeric answers (two of which were developed by Frederick).1 Hereafter we refer to all six as CRT (Appendix A).
To unconfound math versus CRT from lureless items versus items with lures, we decided to seek and incorporate math items with a fast lure. We searched the item bank based on a comparison of median response times (MRT) for correct and incorrect answers. The search was restricted to the 207 easier items (out of 365), those solved correctly by 65% or more of the student test population, since we suspected the MTurk population might have overall lower ability than the test candidates, who were active students. Among them were 14 items whose MRT for wrong answers was at least 10 seconds shorter than for correct answers. For 12 of these items, closer inspection found that a single wrong answer accounted for this pattern of RTs. This answer we call fast lure. For example, MFL item 1 (Appendix B) reads 33−32/3=?. The intuitive but incorrect answer 1 was the most common wrong answer in our data. Six of these 12 items (two each of Geometry, Algebra, and Arithmetic) were freely chosen for inclusion in the study (Appendix B). Although these items each have a single most popular lure the MRT for which is at least 10 seconds faster than that for the correct answer, stylistically they are quite distinct from the CRT items, primarily because they are not word problems, and so do not have the riddle-like flavor of the CRT items.
Out of the 207 easier items, 112 items had an MRT for all wrong answers that was at least 10 seconds longer than MRT for correct answers. Twelve of these items were freely chosen for inclusion in the study, with approximately equal numbers from Geometry, Algebra, and Arithmetic (Appendix C).
A battery of reasoning and of choice tasks, that were previously used to validate the predictive power of the CRT, was assembled:
These last two choice tasks were interspersed as two blocks among the 13 reasoning problems (see Appendix D).
At the start of the R&C section, respondents were told they would be given questions that “represent a wide range of more or less realistic reasoning and choice situations.” At the start of the math+CRT section respondents were instructed that to answer the open-ended problems, they would have to “type a number in a text box that may be an integer, a decimal, or a fraction (using the / sign), and it might be negative”. They were allowed to use an on-screen calculator, and were also asked to prepare scrap paper and pen or pencil to perform hand calculations.
The order of the math+CRT problems within that section was randomized for each participant. The R&C problems were divided into two blocks. Block 1 consisted, in this order, of: sample-size I; temporal-discounting; framing I; risk-preference; regression to the mean; gambler’s fallacy I; conjunction effect; covariation detection; sample-size II. Block 2 consisted, in this order, of: methodological reasoning; sunk cost; Bayesian updating; framing II; gambler’s fallacy II; denominator neglect; probability matching. The order of the two blocks of the R&C section was randomized. In addition, the order of the math+CRT and the R&C sections was also randomized, resulting in four section/block orders. At the end of the session, respondents gave their age, gender, and years of education.
Study 1 (N=252) Study 2 (N=567) Task Bayes Conjunction effect Covariation detection Delay preference Denominator neglect Framing Gambler’s fallacy I Gambler’s fallacy II Methodological reasoning Probability matching Regression to the mean Risk aversion in losses Risk seeking in gains Sample-size I Sample-size II
We begin with descriptive results for the R&C and the math+CRT tasks, followed by analyses that pertain to three research questions. 1. Is the defining characteristic of CRT items unique to these items? We present results about the extent and the MRTs of the fast lure responses; of other incorrect responses; and of correct ones — separately for CRT and for MFL items. 2. Do CRT items measure an underlying ability that differs from that required by other math items? We present results of three CFA models of the data. 3. Do CRT items predict reasoning and choice better than standard math items? We present the correlations of each of the 24 individual items with the R&C score.
All but two of the 13 reasoning items had a straightforward correct answer, and were scored 1 for correct and 0 for incorrect answers. The exceptions were the two framing problems, and the two sunk-cost problems, which elicit preferences rather than judgments. These have no “correct” responses, but from a normative point of view, the frame in the former pair, and the sunk cost in the latter pair, should be ignored, and the two questions within each pair should yield the same answer. Hence, these items were scored in pairs: 1 for identical answers within a pair, and 0 for different answers within a pair.
From the temporal discounting items a single delay preference score was computed: the number of items with a preference for delay, divided by the total number of items, 5. From the risk preference items two scores were computed: risk aversion in losses is the number of loss items with a preference for a sure choice, divided by 5, the number of items; and risk seeking in gains is the number of gain items with a preference for a risky choice, divided by 5, the number of items. Altogether, 3 scores were computed for the choice tasks.
Table 1 summarizes performance on the R&C items, via two statistics — score in percent and the point-biserial (i.e., item-with-total correlation, where the item is excluded from total score), a measure of the item’s quality in discriminating between high-scoring and low-scoring examinees. The sunk-cost item showed a negative point-biserial. Consequently, we discarded this item in computing the total reasoning score. The total reasoning score for respondents was defined as their average score for the other 15 scores. This final reasoning score had a Cronbach’s alpha estimate of reliability of .63.
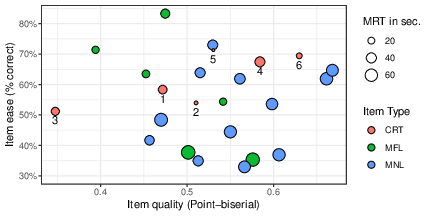
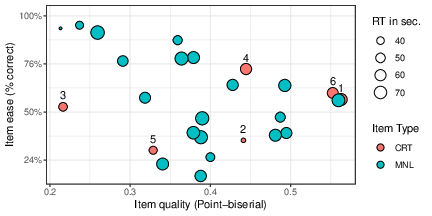
Figure 1 summarizes performance on the 24 individual items. All items had relatively high point-biserials (ranging from .35 to .67). Their Cronbach’s alpha estimate of reliability was a high .91. Some differences can be seen among the three item types. The MNL items were somewhat more difficult (52% correct on average) than either the MFL (58%) or the CRT (62%) items; the point-biserials of MNL items (median of .56) are slightly higher than those of CRT items (median of .52) followed by MFL items (median of .49); and the MRTs (across all answer types) of MNL items (49 seconds) are typically longer than those of MFL (33 seconds) or CRT (20 seconds) items.2
This section is concerned with research question 1: Is the defining characteristic of CRT items unique to these items?
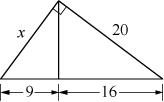
Lure results for CRT and MFL items are analyzed in terms of lure popularity and MRTs for lure answers. We expected the fast lure to be the most popular wrong answer, and to be given more quickly than other answers. Table 2 presents results pertaining to lure popularity for the CRT and the MFL items. The rightmost column — % lure out of all errors — is important, because unlike the preceding column, it normalizes for item difficulty, which ranges between 83% correct responses to just 35%. Unfortunately, 2 out of the 12 chosen items did not “work” as intended according to our apriori selection criteria. In CRT item 4 (soup and salad), the incorrect answer 4.5, given by 7% of respondents, turned out to be more popular than the supposed fast lure (2.5%). In MFL item 2 (right triangle), several errors were more popular than 5, the fast lure in the item bank from which this item was drawn. The most popular error, 12, was given by 12% of respondents. For the purpose of answering question 1, we excluded these items.
Although, obviously, we could not apriori match CRT items to MFL items on the dependent variables — aposteriori they are surprisingly well matched (see Table 2, especially the rows “All except…”). These numbers, therefore, give no basis to claim a difference between our CRT and MFL items.
Item % Correct % Lure CRT 1. barrel of water 58 16 2. students in class 54 20 3. pig 51 34 4. soup and salad 67 3 5. nurses 72 24 6. tea concentration 69 18 All 62 19 All except #4 61 22 MFL 1. powers of 3 63 17 2. right triangle 38 4 3. square perimeter 71 18 4. adjacent products 35 31 5. divisor of 264 83 12 6. 4-16-256 54 35 All 57 19 All except #2 61 23
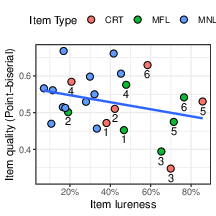
We computed a continuous measure of item “lureness”, namely, the popularity (in %) of its most common error out of all errors. For 5 of the CRTs and 5 of the MFLs, item lureness is the value in the rightmost column of Table 2 (the exceptions are CRT item 4 and MFL item 2). As shown in Table 2, its range is 38%-56%. For the other items, which don’t have a fast lure, lureness ranges between 7% and 45%. Figure 2 shows only a small overlap in lureness between items with lures (CRT and MFL) and without (MNL). The figure also shows that lureness is clearly unrelated to the item’s quality, as measured by its point-biserial (r= −.28, p=.18).
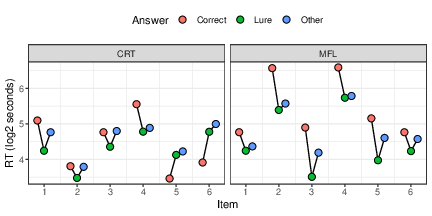
Next, we compare RTs for fast lure responses to other correct or incorrect responses, for both the CRT and the MFL items. The dual-systems explanation of CRT responses implies that respondents need to first overcome the initial attraction of the lure and then engage in further deliberation in order to reach a different answer (Böckenholt, 2012; Campitelli & Gerrans, 2014; Sinayev & Peters, 2015; Travers et al., 2016). This should lead to longer RTs for correct as well as for other incorrect responses. Some studies have found support for this expected pattern (Böckenholt, 2012). Figure 3 shows the mean log RT for each CRT and MFL item with respect to each of the three response types (correct, fast lure, and other error). Without a single exception, the RT for the fast lure was shorter than for other errors; and with just two exceptions (CRT items 5 and 6) it was also shorter than the RT for the correct answer.
In summary, the dual-systems view as it pertains to RTs receives considerable support here (22 of 24 possible comparisons are in the direction it predicts, one-tailed sign test, p < .001; if CRT 4 and MNL 2 are excluded, then 18 of 20 possible comparisons follow the prediction, one-tailed sign test, p < .001) — but it is actually stronger for MFL items than for CRT items, wherein the 2 exceptions lie! So, from this perspective, too, CRT items don’t look unique.
Model χ2 df CFI TLI RMSEA r12 χdiff2 1. 1-factor, math 251.0 252 .978 .976 .039 — – 2a. 2-factor, 6 reflection vs. 18 math 234.3 251 .982 .980 .036 .900 10.5 2b. 2-factor, 5 reflection vs. 19 math 234.2 251 .982 .980 .036 .897 12.3 3a. 2-factor, 12 with lure vs. 12 without 247.7 251 .979 .977 .039 .965 3.1 3b. 2-factor, 10 with lure vs. 14 without 241.8 251 .980 .978 .038 .941 6.9 Note. N = 252. r12 is factor correlation. χdiff2 is the Sattora scaled test for 1- and 2-factor models. In models 2b and 3b the soup-and-salad and right-triangle items were re-classified to the second group.
This section is concerned with research question 2: Do CRT items measure an underlying ability that differs from that required by other math items? To answer this question, CFA was carried out using the Lavaan package in R (Rosseel, 2012), and based on the standard characterization of an item as answered correctly (1) or not (0). We used diagonally weighted least-squares estimation with correction to means and variances, regarded as the best estimator for categorical data.
The following measurement models were specified:
The 2-factor solutions represent the prevailing view that CRT items measure a different ability (i.e., reflection) than math ability, even if correlated with it. The 1-factor solution represents our hypothesis that CRT items only measure math ability.
Table 3 summarizes the fit of the models, and includes the Comparative Fit Index (CFI), the Tucker Lewis Index (TLI), and the Root Mean Square Error of Approximation (RMSEA). Typically, TLI and CFI larger than .95 alongside RMSEA lower than .05 suggest excellent fit of data to model. The table shows that all three models have excellent fit. The differences in fit between the models are negligible (all differences are .004 or smaller). In addition, the estimated correlations between the factors in the 2-factor models are very high: 0.90 for both models 2a and 2b and at least .94 for both models 3a and 3b (where the b version classifies the two problematic items as MNL). This is a case of poor discriminant validity (Campbell & Fiske, 1959) — the degree that two separate scales are actually unrelated. Factor correlations that exceed .85 are often used as a cutoff criterion for problematic discriminant validity (Brown, 2014, p. 166). When factors overlap to a higher degree, it is often recommended to combine the factors for a more parsimonious solution (Brown, 2014).
We conducted a significance test for the difference in fit between the 1-factor and the 2-factor models, using the Satorra (2000) scaled χdiff2 test for nested models. For three of the four 2-factor models the difference is significant (p<.05). However, although χ2 is routinely reported in CFA research (it was the original fit index for structural equation models), the other fit indices discussed above were developed to overcome its limitations (Hu & Bentler, 1999; Thompson & Daniel, 1996): Namely, the assumption that a model is either accepted for providing good fit to the data, or rejected for poor fit. This assumption is replaced with quantifying the degree of fit along a continuum. The binary classification of model fit also confounds fit with sample size (the larger the sample is, the easier it is to obtain a statistically significant result and reject a model for poor fit). As a result, the other fit indices discussed above are usually relied on more heavily in the evaluation of model fit (Brown, 2014; Hu & Bentler, 1999).
In summary, the statistically significant difference between 1-factor and 2-factor models notwithstanding, it is of no other significance. The comparative fit results and the very high factor correlations suggest that all items, including the CRT items, measure the same ability (regardless of how one classifies the two problematic items), rendering the idea that CRT items are a special type of cognitive problem unnecessarily unparsimonious.
This section is concerned with research question 3: Do CRT items predict R&C scores any better than standard math items? An implication of the 1-factor model is that all systematic variance measured by the items is due to their quality as math items. Whereas in the context of traditional item analysis item quality is captured by the item’s point-biserial, in the context of the CFA analysis, item quality is captured by the 1-factor model item loadings (point-biserials and loadings are highly correlated, r= .97). Either way, it is the quality of the items that should determine their relation to any other measure.
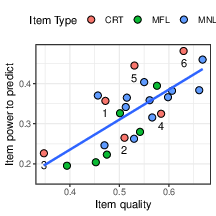
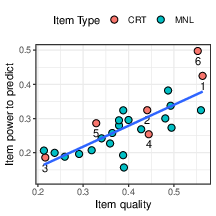
Support for this expectation is seen in Figure 4, which shows that item-with-R&C correlations follow the point-biserials of the items (r= .73). We also conducted a regression analysis predicting item-with-R&C correlation from both the quality of the item (point-biserial) and its “lureness” — the popularity of the most common error, to examine whether lureness contributes to the predictive power of the item. Whereas the point-biserial was highly significant (β = 0.77, se=0.16, p<.01), lureness was not (β = 0.02, se=0.05, p=.67).
It is notable that the correlations of the math+CRT items with the R&C scores (presented in the figure) are very high — most of them are higher than the point-biserials of the R&C items themselves, shown in Table 1 — which are also correlations between an item and the total R&C score. Indeed, all the math+CRT items are powerful predictors of the R&C scores. This is also evident from the correlation between the math+CRT score and the R&C score, r= .57. This value approaches the upper limit for any correlation with the R&C scores, since the latter’s reliability coefficient, Cronbach’s alpha, is estimated as α = .63. Taking into account the reliability coefficient of the math+CRT score (α = .91), the disattenuated correlation between the math+CRT and R&C scores is .76.
Finally, given that individually, the CRT and MNL items have similar point-biserials, they are also similarly predictive of R&C scores as a group. Summary scores from the 5 proper CRT items and the 5 MNL items with the highest point-biserials had exactly the same correlation with the R&C: .52.
Study 2 is a replication of Study 1 using a different population of participants, and a new set of math problems. Data were collected as part of a research study, similar to the one described in Attali and van der Kleij (2017), with the same population of students preparing to take the admissions test. Study 2 has a larger number of participants, albeit less control over participant procedures, as explained below.
Candidates registered to take the operational test were emailed an invitation to participate in a study that would allow them to take practice tests and to receive instructional support for the quantitative section of the admissions test for which they were preparing. Invitations were sent during the week of March 18, 2019, 1-3 weeks before the operational test. Upon their first login to the system, participants completed a first test section of 20 items. Then they could freely engage in the system for up to four additional practice test sections, watch instructional videos (with pre-and post-lesson questions), and study an interactive review book, with accompanying questions attached to the different sections.
A total of 1286 participants answered the 20 MNL items and the six CRT items3 and consisted of 66% females. Ages ranged from 17 to 50 years (M = 27, SD = 6). Of all participants, 567 (44%) chose to complete the R&C tasks as well. Despite self-selection, they did not differ from those that did not complete the R&C tasks in terms of percent of correct answers on the 26 items: 56% vs. 57%, respectively.
All practice test items were selected from the same item bank described in Study 1. Items in this bank all have both an open-ended and a multiple-choice version. The first test was comprised of 20 multiple-choice items, without a fast lure, hence MNL (we saw no further need for MFL items). None of these items were used in Study 1. Subsequent tests were composed of the open-ended item versions and were adaptive — namely, items were sequentially selected by an algorithm on the basis of test-takers’ ability estimates after each item. The six CRT items from Study 1 were embedded within the second test section. Thus, the data for Study 2 are the answers to the 20 MNL items used in the first test, and to the six CRT items embedded in the second. Most of the participants answered the first CRT item within an hour of answering the last item of the first test.
The R&C problems — same as those used in Study 1 — were offered to participants as part of what they could voluntarily explore after completing the pretest. As in Study 1, the sunk-cost item had a negative point-biserial and was removed from the R&C score. The right-hand columns of Table 1 summarize performance on the remaining R&C items. The R&C score had a Cronbach’s alpha of .61, similar to that in Study 1.
Figure 5 summarizes performance on the math+CRT items. Compared to Study 1, items had somewhat lower point-biserials with total math+CRT score (in the range .21–.56), hence also a lower Cronbach’s alpha of .85 for all 26 math+CRT items. A possible explanation is that multiple-choice items — due to the possibility of guessing — tend to have lower discrimination than open-ended items, such as were used in Study 1. The variability in item difficulties in Study 2 (SD = .23) was also greater than in Study 1 (SD = .14), with some very easy and some very difficult items. However, Figure 5 shows that the CRT items are on average similar to the MNL items in terms of both difficulty and point-biserial.4 To our surprise, college students solved the six CRT items correctly at a lower rate than the MTurk workers (52% versus 62%), possibly as a result of MTurk workers’ prior experience with the CRT (Bialek & Pennycook, 2018).
Since there were no MFL items in this study, a CFA comparing only models 1 and 2 (2a with, and 2b without, CRT item 4) was conducted. Table 4 shows that all models have excellent fit. The differences in fit between them are again negligible. In addition, the estimated correlation between the factors in the 2-factor models is again a very high .92. Although the comparative fit indices are almost identical, the Satorra (2000) scaled χdiff2 test for nested models (model 1 versus models 2a or 2b) is again significant (p<.05), probably due to the large sample size.
In summary, the comparative fit results, and high correlations between factors, again suggest that CRT items measure the same thing the MNL items do — which presumably is mere math ability.
Model χ2 df CFI TLI RMSEA r12 χdiff2 1. 1-factor, math 492.2 299 .972 .970 .029 — – 2a. 2-factor, 6 reflection vs. 20 math 469.7 298 .975 .972 .028 .917 24.5 2b. 2-factor, 5 reflection vs. 21 math 477.9 298 .974 .971 .028 .924 17.7 Note. N = 1286 . r12 is factor correlation. χdiff2 is the Sattora scaled test for 1- and 2-factor models. In model 2b the soup-and-salad item was re-classified to the second group.
Figure 6 presents the relationship between the items’ quality (i.e., point-biserials) and their predictive power (i.e., item-with-R&C correlations). As in Study 1, the correlation between the two measures is high (r= .78), but the item-with-R&C correlations themselves are somewhat lower than in Study 1. A possible explanation lies in the number of very easy and very hard items in this set.5 However, these correlations still tend to be higher than the point-biserials of the R&C items (medians of .27 vs. .22, respectively, shown in Table 1, the point-biserial columns).
In addition, and similarly to Study 1, the correlation between the math+CRT score and the R&C score is .59, very close to the upper limit set by the R&C score’s Cronbach’s reliability of .61. Taking into account the reliability coefficient of the math+CRT score (α = .85), the disattenuated correlation between the math+CRT and R&C scores is .81.
Finally, correlations of R&C scores with summary scores from the 5 proper CRT items (.54) were slightly higher than with the 5 MNL items with the highest point-biserials (.48), but the difference was not significant (p=.07).
In two studies, with two different populations of respondents and two different sets of math problems, we found that a 1-factor measurement model, which treats CRT items as regular math problems, showed excellent fit to the data. The fit of the 2-factor measurement model was almost identical; furthermore, the correlation between the two factors in the 2-factor model was .90 or higher, too high to warrant a meaningful distinction between math ability and a separate ability uniquely measured by CRT items. Consequently, the idea that CRT items are a special kind of cognitive problem, one that measures reflection, is superfluous.
An implication of the 1-factor model is that all systematic variance measured by the math items (CRT or other) is due to their quality as math items. In other words, the items’ relation to the underlying math factor (which is captured by the items’ point-biserial, or their 1-factor model loadings) should determine their relation to any other measure. This implication was supported in both studies, both of which found a strong relationship between the point-biserials of the math+CRT items and the item-with-R&C correlations. Whether or not CRT solutions require some willingness to reject immediate answers, our data show that this is not important in accounting for prediction of the R&C tasks.
Our results do indicate that the CRT items are quite excellent math items (as evidenced by their point-biserials), equal to or better than the other math problems we used. As a result, the ability of individual CRT items to predict the R&C scores was better, on average, than that of other math items. However, our results also make it clear that it would be relatively easy to select from a large item bank math items with higher discrimination values (as opposed to our selection of average items), and to find items that would outperform the CRT items in terms of predicting external measures such as the R&C scores. In other words, although CRT items are excellent items, high quality math items that could never pass as CRT items can serve as well in the predictive role of the CRT. And of course, it is much easier to find or create “good” math items, than to find or create “good” CRT items. The former go well into the thousands and beyond, whereas the latter have yielded only a handful of published items in over a dozen years of research.
The uniqueness of CRT items was also called into question in another way. Study 1 showed that the existence of fast lures is not unique to CRT items. The math problems we identified as having a fast lure behaved similarly to CRT items. Regardless of whether CRT item 4 and MFL item 2 are included or excluded, the CRT items in Table 2 are essentially indistinguishable from the MFL items. Moreover, the common assumption in the CRT literature that respondents go through a deterministic two-stage process, by which the lure must be considered and rejected before any other answer is considered, was even more strongly supported by the RT results of the MFL items than by the CRT items (see Figure 2).
Although we could not find support for the view that CRT items are distinct from other math items — with or without lure — it is possible that other contexts would engender more pronounced distinction between CRT and math items. For example, the reasoning and choice tasks we used, although distinct from mathematical problem solving, still require cognitive abilities that may be similar to those required by math items. The CRT has been found to be a meaningful predictor of other key psychological outcomes in diverse areas of everyday life, such as skepticism about religion, and less traditional moral values (Pennycook, Fugelsang & Koehler, 2015), and we are presently expanding this study to such non-cognitive outcomes. As another example, in our research CRT items were presented intermixed with regular math items. Might answering CRT items in a stand-alone context give rise to responses that are less influenced by mathematical knowledge?
Developing new items with the elegant properties of the original CRT items is not an easy task. However, as the failure of the soup-&-salad variant demonstrates, even developing successful variants of old item types is not trivial. Nevertheless, the nurses and sun-tea variants we used (as well as others with still different numbers and cover stories) are equivalent to the original widgets and lily-pads variants, respectively, in terms of both the popularity of the lure and the mathematical operations needed to solve the problems.
We propose that one specific set of items should not be used anymore to study the nature of reflection (they can still be used for other purposes), at least not on the MTurk platform: the original widgets, lily-pads, and bat-&-ball items used by Frederick (2005). They have become so well known that we believe many respondents (especially MTurk respondents) no longer figure out the solution, instead retrieving the answer from memory. Evidence for this (apart from the sheer number of friends who know the questions and of studies which have used them) comes from unpublished data the first author has recently collected, using Frederick’s original CRT items. The MRTs for answering these items were very short, as low as 7 seconds — faster even than typical answers to easy general knowledge questions such as: “In what country would you find the cities Ankara and Istanbul?” or “What is the largest planet in the solar system?”. Moreover, correct answers to all three original items were produced more quickly even than lure answers.
We are not disputing the research that has found that repeated exposure to the original CRT items had little effect on the items’ ability to predict other measures (Bialek & Pennycook, 2018; Meyer, Zhou, & Frederick, 2018). Thus, the original items apparently can still be used as an excellent short cognitive ability measure. However, we suspect that their fame has rendered many of the responses to these items less about reflection, of any kind, and more about retrieval. Indeed, even the variants we used here may be known to many in the MTurk workers community, as evidenced by the large discrepancy in the difficulty of item types between the student and MTurk populations. And these items are certainly not useful when response time is of interest.
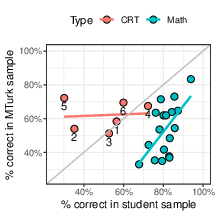
As Figure 7 shows, whereas the 18 math items were all easier for the student population (based on the sample from Attali & van der Kleij, 2017) than for the MTurk population (from Study 1), the CRT items are at least as hard for the students (from Study 2) as for the Mturkers (from Study 1). In addition, whereas a strong relationship in item difficulty can be found for the 18 math items (r=.60, p=.01), no such relationship exists for the 6 CRT items (r=.08, p=.88). Note that, for the only time in this paper, Figure 7 shows a striking difference between CRT and other math items, a difference that does not result from the nature of the items, but from the over-exposure of the CRT items in the MTurk population.
A different discrepancy between the two populations relates to RTs for the CRT items: In Study 1, with MTurk workers, an MRT of 20 seconds was found across all answers to the 6 items; in Study 2, with the student population, an MRT of 50 seconds was found.
Our study is a validation study of the CRT. Specifically, we attempted to find evidence of discriminant validity of the CRT in comparison to mere math. We used CFA to estimate the correlation between the underlying factors measured by CRT and other math items (and found it to be too high to warrant a separate reflection factor). The strength of the CFA approach is that estimates of discriminant and convergent validity are adjusted for measurement error. This provides a stronger analytic framework than traditional correlational or regression analyses, which assume that variables are free of measurement error. An alternative simpler method to account for measurement error in the correlation rxy between two measures is to compute the disattenuated correlation, defined as rxy / √rxxryy, where rxx and ryy are the estimated reliabilities of the measures. For example, in Study 2 the simple correlation between scores on the six CRT items and for the other 20 math items is rxy = .66. Cronbach’s alpha estimates of reliability for the CRT and for the math items are .64 and .81, respectively. Therefore, the disattenuated correlation between the two measures is .92 — identical to the CFA factor correlation found in Study 2.
Note that some established cognitive abilites do show evidence of discriminant validity. As an example involving math ability, Klieger, Bridgeman, Tannenbaum, Cline and Olivera-Aguilar (2018) report a disattenuated correlation of .73 between the Quantitative and Verbal scores of the GRE General Test, and a disattenuated correlation of .45 between the Quantitative and Analytical Writing scores (the disattenuated correlation between Verbal and Analytical Writing scores is .60).
Recently, Thomson and Oppenheimer (2016) offered an alternative set of brainteasers that do not rely on numeracy, yet also appear to have a fast lure. An example is: “Emily’s father has three daughters. The first two are named April and May. What is the third daughter’s name?” Based on evidence of positive correlations between performance on these brainteasers with the traditional CRT, with various reasoning tasks, and with SAT scores, those authors regard these brainteasers as an alternate form of the Cognitive Reflection Test, and call it CRT-2. However, the questions we asked about the CRT can similarly be asked about the CRT-2. Namely, what are the underlying abilities measured by these brainteasers? In what way are brainteasers with an intuitive incorrect answer — a fast lure — different in their measurement properties from other brainteasers? For example, in the same Forbes Magazine article from which some of the CRT-2 questions were drawn (Green, 2012), other brainteasers that do not seem to immediately elicit a wrong, or any, intuitive answer are listed. For example: “A clerk at a butcher shop stands five feet ten inches tall and wears size 13 sneakers. What does he weigh?”, or “Before Mt. Everest was discovered, what was the highest mountain in the world?” How do these brainteasers differ, if at all, from other brainteasers?
It is possible that this lack of theoretical construct validation may have been driven by practical advantages of the CRT. The measure is extremely short and easy to administer, and at the same time shows impressive correlations with other JDM measures. However, these practical advantages cannot substitute for a deeper understanding of what accounts for the predictive power of the CRT. In this respect, our results concerning the R&C measure showed similar evidence of measurement limitations, with low reliability and weak construct validity support (also noted by Toplak et al., 2014).
In conclusion, the role of construct validation of JDM measures cannot be overemphasized. Studies of convergent and discriminant validity of theoretical constructs support the inferences made on the basis of measurements and ultimately explicate and provide meaning to these measurements. Our paper contributes to this literature by showing that CRT items are first and foremost mathematical problems.
CRT items are very appealing in some stylistic, aesthetic sense. Many of them can be found in collections of riddles. Frederick found a version of bat-&-ball in a 1919 Jewish puzzle book. Bar-Hillel knows variants of the other two from her childhood days, almost 70 years ago. It is no wonder that people are inclined to spread them among their friends and colleagues. It is no wonder that the New York Times wrote about the CRT already in 2006. Add that to the fact that it is so short and easy to administer, and nevertheless predicts variables of interest and consequence way beyond riddle-solving ability — and one might understand how the literature using the CRT is growing nowadays at the rate of hundreds of new articles a year. It has come to be regarded as a kind of instant IQ test, of almost magical predictive power. And the existence of an immediately available, seemingly apt, but wrong answer — the fast lure — that needs to be rejected in spite of its allure, is itself part of the CRT’s allure.
Alas, that allure is false.
The main claim of this paper is a downer compared to this mystique. We claim that insofar as we tested, CRT items are essentially just ordinary math word problems. It is perhaps even more disappointing that we are not in a position at this point to offer a theory of what it is about such math problems that affords the kind of predictive power that is found. Is it math ability? Is it g — general intelligence? Is it reflective cognitive style? We can state only one conclusion with any confidence: it does not rely on the existence of a lure, and the need to overcome it en route to a correct solution. Baron et al. (2015) similarly concluded “that the CRT does not measure a general trait involving reflective suppression of an initial response tendency” (p. 277), but also cautioned that “More tests with no-lure items are needed before these can be considered fully equivalent to items with lures in their predictive power” (p. 277). The present studies may well provide these additional tests. Existing theories in the literature that explain the CRT’s achievements whilst relying on its most characteristic feature — the existence of a lure — now need to acknowledge that having a lure is not a necessary condition for the CRT’s power. Future research will have to say what, then, is.
Attali, Y., & van der Kleij, F. (2017). Effects of feedback elaboration and feedback timing during computer-based practice in mathematics problem solving. Computers & Education, 110, 154–169. doi:10.1016/j.compedu.2017.03.012
Baron, J. (2019). Actively open-minded thinking in politics. Cognition, 188, 8–18.
Baron, J., Scott, S., Fincher, K., & Metz, S. E. (2015). Why does the cognitive reflection test (sometimes) predict utilitarian moral judgment (and other things)? Journal of Applied Research in Memory and Cognition, 4(3), 265–284.
Bialek, M., & Pennycook, G. (2018). The cognitive reflection test is robust to multiple exposures. Behavior Research Methods, 50(5), 1953–1959.
Böckenholt, U. (2012). The cognitive-miser response model: Testing for intuitive and deliberate reasoning. Psychometrika, 77(2), 388–399.
Brown, T. A. (2014). Confirmatory factor analysis for applied research. Guilford Publications.
Campbell, D. T., & Fiske, D. W. (1959). Convergent and discriminant validation by the multitrait-multimethod matrix. Psychological Bulletin, 56(2), 81–105.
Campitelli, G., & Gerrans, P. (2014). Does the cognitive reflection test measure cognitive reflection? A mathematical modeling approach. Memory & Cognition, 42(3), 434–447.
Campitelli, G., & Labollita, M. (2010). Correlations of cognitive reflection with judgments and choices. Judgment and Decision Making, 5(3), 182–191.
Carroll, J. B. (2012). Mathematical abilities: Some results from factor analysis. In R. J. Sternberg & T. Ben-Zeev (Eds.), The nature of mathematical thinking (pp. 19–42). Routledge.
Cokely, E. T., & Kelley, C. M. (2009). Cognitive abilities and superior decision making under risk: A protocol analysis and process model evaluation. Judgment and Decision Making, 4, 20–33.
Finucane, M. L., & Gullion, C. M. (2010). Developing a tool for measuring the decision-making competence of older adults. Psychology and Aging, 25(2), 271–288.
Frederick, S. (2005). Cognitive reflection and decision making. Journal of Economic Perspectives, 19(4), 25–42.
Green, H. (2012). 10 brainteasers to test your mental sharpness. Https://Www.forbes.com. Retrieved from https://www.forbes.com/sites/work-in-progress/2012/05/15/10-brainteasers-to-test-your-mental-sharpness/
Hu, L.-t., & Bentler, P. M. (1999). Cutoff criteria for fit indexes in covariance structure analysis: Conventional criteria versus new alternatives. Structural Equation Modeling: A Multidisciplinary Journal, 6(1), 1–55.
Klieger, D. M., Bridgeman, B., Tannenbaum, R. J., Cline, F. A., & Olivera-Aguilar, M. (2018). The validity of gre general test scores for predicting academic performance at us law schools. ETS Research Report Series, 2018(1), 1–28.
Liberali, J. M., Reyna, V. F., Furlan, S., Stein, L. M., & Pardo, S. T. (2012). Individual differences in numeracy and cognitive reflection, with implications for biases and fallacies in probability judgment. Journal of Behavioral Decision Making, 25(4), 361–381.
Lipkus, I. M., Samsa, G., & Rimer, B. K. (2001). General performance on a numeracy scale among highly educated samples. Medical Decision Making, 21(1), 37–44.
Meyer, A., Zhou, E., & Frederick, S. (2018). The non-effects of repeated exposure to the cognitive reflection test. Judgment and Decision Making, 13(3), 246–259.
Pennycook, G., Fugelsang, J. A., & Koehler, D. J. (2015). Everyday consequences of analytic thinking. Current Directions in Psychological Science, 24(6), 425–432.
Primi, C., Morsanyi, K., Chiesi, F., Donati, M. A., & Hamilton, J. (2016). The development and testing of a new version of the cognitive reflection test applying item response theory (irt). Journal of Behavioral Decision Making, 29(5), 453–469.
Rosseel, Y. (2012). lavaan: An R package for structural equation modeling. Journal of Statistical Software, 48(2), 1–36. Retrieved from http://www.jstatsoft.org/v48/i02/
Satorra, A. (2000). Scaled and adjusted restricted tests in multi-sample analysis of moment structures. In D. Heijmans, D. Pollock, & A. Satorra (Eds.), Innovations in multivariate statistical analysis (pp. 233–247). Springer.
Sinayev, A., & Peters, E. (2015). Cognitive reflection vs. Calculation in decision making. Frontiers in Psychology, 6, 532.
Thompson, B., & Daniel, L. G. (1996). Factor analytic evidence for the construct validity of scores: A historical overview and some guidelines. Educational and Psychological Measurement, 56(2), 197–208.
Thomson, K. S., & Oppenheimer, D. M. (2016). Investigating an alternate form of the cognitive reflection test. Judgment and Decision Making, 11(1), 99–113.
Thurstone, L. (1924). The nature of intelligence. Harcourt.
Toplak, M. E., West, R. F., & Stanovich, K. E. (2011). The cognitive reflection test as a predictor of performance on heuristics-and-biases tasks. Memory & Cognition, 39(7), 1275–1289.
Toplak, M. E., West, R. F., & Stanovich, K. E. (2014). Assessing miserly information processing: An expansion of the cognitive reflection test. Thinking & Reasoning, 20(2), 147–168.
Travers, E., Rolison, J. J., & Feeney, A. (2016). The time course of conflict on the cognitive reflection test. Cognition, 150, 109–118.
Weller, J. A., Dieckmann, N. F., Tusler, M., Mertz, C., Burns, W. J., & Peters, E. (2013). Development and testing of an abbreviated numeracy scale: A rasch analysis approach. Journal of Behavioral Decision Making, 26(2), 198–212.
The first three items were used by Toplak et al. (2014, two of which were developed by Shane Frederick) and the last three items are parallel versions of the original CRT items (Finucane & Gullion, 2010).
| 33 − 323 = |
|
Mostly used by Toplak, West, & Stanovich (2011) and Frederick (2005).
First five items used by Frederick (2005) (Table 2) and also by Toplak, West, & Stanovich (2014).
Do you prefer to receive:
We use simple preference (Frederick, 2005) between the two options.
These items were used by Frederick (2005) (Table 3a). The first set compares certain gains to gambles with higher expected value (higher CRT scorers tended to prefer the gamble). The second set compares certain losses with gambles of lower expected value (higher CRT scorers tended to prefer the certain loss).
What do you prefer?
key: 2, from Tversky & Kahneman (1974).
A certain town is served by two hospitals. In the larger hospital about 45 babies are born each day, and in the smaller hospital about 15 babies are born each day. As you know, about 50% of all newborns are boys. However, the exact percentage varies from day to day. Sometimes it may be higher than 50%, sometimes lower.
For a period of 1 year, each hospital recorded the days on which more than 60% of the newborns were boys. Which hospital do you think recorded more such days?
key: 2, from Kahneman & Tversky (1982).
A game of squash can be played either to 9 or to 15 points. If A is a better player than B, which scoring system will give A a better chance of winning?
key: 3, from Lehman, Lempert, & Nisbett (1988).
After the first 2 weeks of the major league baseball season, newspapers begin to print the top 10 batting averages. Typically, after 2 weeks, the leading batter has an average of about .450. However, no batter in major league history has ever averaged .450 at the end of the season. What is the most likely explanation for this?
key: 0.1, from Toplak et al. (2011), source is not provided.
When playing slot machines, people win something about 1 in every 10 times. Julie has just won on her first three plays. What are her chances of winning the next time she plays? [open-ended question]
key: 3, from Toplak et al. (2011), source is not provided.
Imagine that we are tossing a fair coin (a coin that has a 50/50 chance of coming up heads). It has just come up heads 5 times in a row. For the 6th toss do you think that:
key: 2 more likely than 3, based on Tversky & Kahneman (1983), originally the problem asked about Borg in the Wimbledon finals of 1981 (the study was run in 1980).
Suppose the top performing basketball team reaches the NBA finals series in 2019. To win the series they have to win at least 4 games out of 7. Rank order the following outcomes from most to least likely.
key: negative judgments, from Toplak et al. (2011).
A doctor had been working on a cure for a mysterious disease. Finally,
she created a drug that she thinks will cure people of the disease.
Before she can begin to use it regularly, she has to test the drug. She
selected 300 people who had the disease and gave them the drug to see
what happened. She selected 100 people who had the disease and did not
give them the drug to see what happened. The table below indicates what
the outcome of the experiment was:
| Treatment | Cured | Not cured |
| Present | 200 | 100 |
| Absent | 75 | 25 |
Was this treatment positively, negatively, or not at all associated with the cure for this disease? [21 options labelled -10 to 10 in increments of 1 with an added description of “(strong negative association)” and “(strong positive association)” to the first and last options, respectively]
key: 1, from Lehman et al. (1988).
The city of Middleopolis has had an unpopular police chief for a year and a half. He is a political appointee who is a crony of the mayor, and he had little previous experience in police administration when he was appointed. The mayor has recently defended the chief in public, announcing that in the time since he took office, crime rates decreased by 12%. Which of the following pieces of evidence would most deflate the mayor’s claim that his chief is competent?
key: 2 is irrelevant, from Beyth-Marom & Fischhoff (1983).
Maxwell is a member of the Bear’s Club. You have met Maxwell at a party to which only university professors and business executives were invited. You are asked to assess the probability that Maxwell is a university professor, by using 1, 2, 3, or 4 of the questions given below. However, before asking them, you are asked to evaluate their relevancy for your task. A relevant question is one the answer to which will help you in your assessment. Evaluate each of the questions separately and indicate whether it is relevant or irrelevant for your task.
Both versions are presented in different screens (Toplak et al., 2011), key: descriptive invariance, from Tversky & Kahneman (1981).
Imagine that the U.S. is preparing for the outbreak of an unusual Asian disease, which is expected to kill 600 people. Two alternative programs to combat the disease have been proposed. Assume that the exact scientific estimate of the consequences of these programs is as follows:
Version 1
If program A is adopted, 200 people will be saved. If program B is adopted, there is a one-third probability that 600 people will be saved and a two-thirds probability that no people will be saved.
Version 2
If program A is adopted, 400 people will die. If program B is adopted, there is a one-third probability that nobody will die and a two-thirds probability that 600 people will die.
Which of the two programs would you favor?
key 1, from Kirkpatrick & Epstein (1992).
Assume that you are presented with two bags of black and white marbles: a large bag that contains 100 marbles and a small bag that contains 10 marbles. The marbles are mixed within each bag. You must draw out one marble (without peeking, of course) from either bag. If you draw a black marble, you win $2. Consider a condition in which the small bag contains 1 black marble and 9 white marbles, and the large bag contains 8 black marbles and 92 white marbles. What bag gives you a better chance of winning?
key 3, from West & Stanovich (2003).
A die with 4 red faces and 2 green faces will be rolled 60 times. Before each roll you will be asked to predict which color (red or green) will show up once the die is rolled. You will be given one dollar for each correct prediction. What strategy would earn you the most money, on average?
Both versions are presented on the same screen (Toplak et al., 2011), key: descriptive invariance, from Frisch (1993).
Version 1
You are staying in a hotel room on vacation. You paid $6.95 (non-refundable) to see a movie on pay TV. After 5 minutes you are bored and the movie seems pretty bad. Would you continue to watch the movie or not?
Version 2
You are staying in a hotel room on vacation. You turn on the TV and there is a movie on. After 5 minutes you are bored and the movie seems pretty bad. Would you continue to watch the movie or not?
Copyright: © 2020. The authors license this article under the terms of the Creative Commons Attribution 3.0 License.
This document was translated from LATEX by HEVEA.