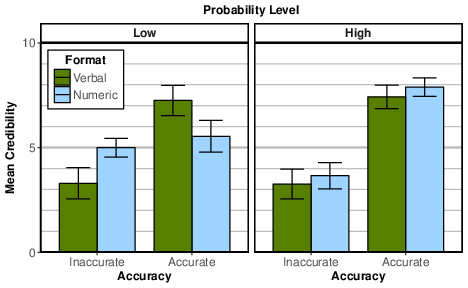
| Figure 1: Mean credibility with 95% confidence intervals by format, probability level, and accuracy. |
Judgment and Decision Making, Vol. 14, No. 6, November 2019, pp. 683-695
Cultivating credibility with probability words and numbersRobert N. Collins* David R. Mandel# |
Recent research suggests that communicating probabilities numerically rather than verbally benefits forecasters’ credibility. In two experiments, we tested the reproducibility of this communication-format effect. The effect was replicated under comparable conditions (low-probability, inaccurate forecasts), but it was reversed for low-probability accurate forecasts and eliminated for high-probability forecasts. Experiment 2 further showed that verbal probabilities convey implicit recommendations more clearly than probability information, whereas numeric probabilities do the opposite. Descriptively, the findings indicate that the effect of probability words versus numbers on credibility depends on how these formats convey directionality differently, how directionality implies recommendations even when none are explicitly given, and how such recommendations correspond with outcomes. Prescriptively, we propose that experts distinguish forecasts from advice, using numeric probabilities for the former and well-reasoned arguments for the latter.
Keywords: credibility, numeric probability, verbal probability,
directionality, forecasts, accuracy
Prediction and control are vital to all organisms, but as social animals, humans also strive to communicate their predictions to others. For most people, the perceived fidelity of their claims to others confers a degree of social credit. If their forecasts prove accurate and help others make good decisions, then their judgments and advice are likely to be heeded in the future — if not, their credibility may suffer, and they may be seen as untrustworthy sources of information in the future. For some, however, communicating predictions is a profession and their reputational success may depend on the degree to which they communicate forecasts clearly and accurately. For instance, patients call on physicians to estimate the chances of responding effectively to therapies and the chances of incurring harms from those treatments. National security policymakers routinely call on intelligence organizations to forecast geopolitical events of strategic importance. And, the public call on meteorologists to predict weather systems with both minor consequences (e.g., “should I carry an umbrella today?”) and major consequences (e.g., “should the government call for the evacuation of citizens from high-threat regions?”).
Both senders and receivers have a vested interest in ensuring credibility, but their interests are not perfectly aligned. Senders — as reputation-protecting intuitive politicians (Tetlock, 2002) — want to cultivate credibility, whereas receivers — as both knowledge-sniffing intuitive scientists and cost-minimizing intuitive economists — want to verify that assigned credibility is justified. Research on credibility has identified two key components: trust and expertise (Hovland, Janis & Kelley, 1953; Wiener & Mowen, 1986). Trust reflects the perception that a communicator is accurate, reliable, and unbiased (Dieckmann, Mauro & Slovic, 2010), while perceived expertise reflects a communicator’s knowledgeability (Guilamo-Ramos, Jaccard, Dittus & Bouris, 2006). Whether a forecaster is perceived as credible or not determines how individuals react to a forecast (Wachinger, Renn, Begg & Kuhlicke, 2013). If the forecaster is credible, receivers consider their forecasts more seriously and act more readily upon their recommendations. If a forecaster lacks credibility, receivers may disregard the forecast entirely.
The accuracy of a forecaster’s predictions will affect their credibility. For “clairvoyants” who do not qualify their forecasts with probabilities, accuracy is all or none. Either the prediction is accurate or it is inaccurate. In contrast, when forecasts are qualified by degrees of probability, accuracy is graded. A forecaster who predicted rain with a 60% chance when it did in fact rain might be seen as less accurate than another who predicted rain with a 90% chance. Conversely, a forecaster who predicted rain with a 10% chance when it did in fact rain might be seen as less accurate than another who predicted rain with a 40% chance. This is in fact how formal scoring rules such as Brier scores (Yaniv, Yates & Smith, 1991) and mean absolute error (Willmott & Matsuura, 2005) capture probabilistic accuracy (for related scoring rules, see Armstrong, 2001). They reward greater certainty when that certainty proves to be reflective of the true state of the world; and punish greater certainty when it does not.
Given that information about probability can be communicated numerically or verbally, the way probabilistic forecasts are communicated might also affect perceived credibility. For instance, a forecaster might communicate the probability of precipitation as ‘a 20% chance of rain’ or, alternatively, as ‘an unlikely chance of rain’ (Murphy, Lichtenstein, Fischhoff & Winkler, 1980). Although related, these forecasts do not convey identical information. Numeric point estimates are more precise, and this precision may be taken as a cue for expertise or credibility (Jerez-Fernandez, Angulo & Oppenheimer, 2014) unless the precision is perceived to be unwarranted (Budescu & Wallsten, 1995). In contrast, verbal-probability expressions openly acknowledge vagueness, ambiguity and imprecision (Budescu & Wallsten, 1995; Wallsten, Budescu, Rapoport, Zwick & Forsyth, 1986).
Furthermore, verbal probabilities convey stronger directionality cues than numeric probabilities. Directionality is a characteristic of probabilistic statements that calls attention to the potential occurrence or non-occurrence of an event (Brun & Teigen, 1988; Sher & McKenzie, 2006; Teigen & Brun, 1995, 1999, 2003). The choice of directionality signals to the receiver information about the strength of the communicator’s implicit expectations and revealing their attitudes, beliefs, and recommendations regarding the prediction. For instance, if someone tells you there is some chance they will make it to an event, you will probably be more inclined to expect them to attend than if they had said it was doubtful, even though both terms tend to be understood as conveying low probabilities. The choice of term may even affect your own behaviour — some chance may encourage you to prepare for their attendance whereas doubtful may not (Schmeltzer & Hilton, 2014). Although the directionality of verbal probabilities varies across terms, numeric probabilities tend to convey positive directionality even when they are low (i.e., less than 0.5) in value (Teigen & Brun, 2000). Regardless of format, if the directionality of the forecast is congruent with the outcome it may boost credibility relative to an otherwise identical forecast with incongruent directionality.
Jenkins, Harris and Lark (2017, 2018) examined the effect of communication format on the perceived credibility of forecasters. In a series of experiments, they compared forecasters who communicated risk using numeric or verbal probabilities. The forecasts were always inaccurate in the sense that the event that occurred was the one forecasted to be less probable than its complement. In Jenkins et al. (2017, 2018), a forecasted low-probability event occurred or a forecasted high-probability event did not occur. Forecasters who provided inaccurate, low-probability forecasts (i.e., unlikely in the verbal-probability condition) were rated as more credible if they used numeric rather than verbal probabilities. This was true for both numeric point estimates (20%) and range estimates (10%-30%). The latter finding suggests that the preference for numeric formats was not merely a result of cues of precision and expertise mentioned earlier (Jerez-Fernandez et al., 2014). Indeed, prior to receipt of outcome information (which, to recall, indicated the forecast’s inaccuracy) there was no significant difference among the communication formats.
These findings are informative and suggest that forecasters might do well to use numeric probabilities in their assessments for others. Indeed, Jenkins et al.’s (2017, 2018) findings have already served as evidence to support such claims. For example, Mandel (2019) argued that Jenkins et al.’s evidence calls into question the assumption that the intelligence community will be better buffered from blame if they use verbal rather than numeric probabilities in intelligence assessments. The importance of these findings for policy decisions regarding how organizations should communicate probabilities in assessments warrants further independent research to test their replicability and generalizability.
In the present research, we tested the conceptual replicability of the effects reported by Jenkins et al. (2017, 2018) and we further tested their generalizability to conditions unexplored in the earlier research. Our emphasis on conceptual replicability using a novel task draws on Stroebe and Strack’s (2014) argument in favor of conceptual rather than exact replicability as an effective and efficient use of replications in basic research. We are primarily concerned with the replicability of the effect shown by Jenkins et al. (i.e., numeric-probability formats bolstering credibility more than verbal-probability formats), rather than with the specific stimuli those authors used. Accordingly, in Experiment 1, we used a novel, hypothetical investment scenario that focused on participants’ judged credibility of a stock advisor’s forecast. We manipulated the accuracy of the advisor’s forecast (i.e., inaccurate or accurate), the probability level of the advisor’s forecast (i.e., low or high), and the communication format of the advisor (i.e., numeric or verbal). Experiment 2 comprised a well-powered test of the replicability of findings from Experiment 1 and additionally examined the perceived clarity of the advisor’s communication. Specifically, we examined two aspects of communication clarity: the clarity of the advisor’s communication about the probability of the relevant outcome and the clarity of the advisor’s implicit recommendation (i.e., whether or not to buy the stock described in the scenario). Finally, in Experiment 2, we examined how participants translated the verbal or numeric probability in the advisor’s forecast into the alternative format. These additional measures allowed us to conduct more focused tests of key hypotheses we pitted against each other in this research.
Initially, we tested two competing hypotheses. One hypothesis is that Jenkins et al. (2017, 2018) identified a stable preference for numeric probabilities over verbal probabilities. Several studies show that receivers typically prefer numeric communications of probability to linguistic probabilities despite the tendency for communicators to prefer using verbal probabilities (Brun & Teigen, 1988; Erev & Cohen, 1990; Murphy et al., 1980; Olson & Budescu, 1997; Wallsten, Budescu, Zwick & Kemp, 1993). According to the receivers-prefer-numbers hypothesis, we would expect forecasters who use numeric-probability forecasts to be judged more credible than those who use verbal predictions regardless of accuracy or probability level.
An alternative hypothesis is that differences in credibility observed by Jenkins et al. (2017, 2018) are due to the congruence between the forecast’s directionality and the observed outcome. Unlike the receivers-prefer-numbers hypothesis, the directionality hypothesis predicts that credibility is influenced by the interaction of communication format, forecast accuracy, and probability level. First, consider the case of low probabilities. When a low-probability term such as unlikely is communicated, it has negative directionality. If the unlikely event is positive (such as earning substantial dividends on a stock investment), then the forecast suggests a recommendation against buying the stock (i.e., you probably won’t earn substantial dividends by buying that stock and shouldn’t buy it) even if no explicit recommendation is given. Conversely, if a low numeric probability such as 20% chance is used instead, it may be perceived as directionally equivocal. Although the percentage implies that the complementary event (an undesirable stock value) is more likely (i.e., 80%), saying that there is a 20% chance of the stock’s value rising may still be seen as a recommendation to buy the stock due to the positive directionality of numeric estimates (Teigen & Brun, 2000), especially if the base-rate for outcome success in the reference class is judged to be considerably lower than the estimate.
Accordingly, the directionality hypothesis predicts that, if the forecast is inaccurate (e.g., stock value actually rises), the clearer implicit recommendation against buying conveyed by the verbal-probability forecast will lower credibility more than the numeric-probability forecast, which less clearly conveys to the receiver that the stock should not be purchased. However, if the forecast is accurate, then the directionality hypothesis predicts a reversal in which the verbal-probability format would bolster credibility more than the numeric format. The directionality hypothesis goes further by predicting that the putative two-way (accuracy × format) interaction just described will be qualified by probability level. At high probabilities, both numeric (e.g., 75% chance) and verbal (e.g., likely) formats are unequivocally positive in terms of their directionality and implicit recommendations. Therefore, the directionality hypothesis does not predict a two-way interaction effect for high probabilities. In support of this hypothesis, Jenkins et al. (2017, Experiment 2) found that when the term likely was used instead of unlikely the effect of format on credibility was not significant.
The directionality and receivers-prefer-numbers hypotheses, however, cannot be neatly distinguished in Jenkins et al.’s (2017, 2018) research because those studies examined only inaccurate forecasts. Moreover, in all but one experiment (Jenkins et al., 2017, Experiment 2), the focus was on low-probability inaccurate forecasts — precisely the condition in which the two hypotheses make the same prediction (favoring the numeric-probability format). The present research examined the pattern of findings over the fuller factorial design required to pit the directionality and receivers-prefer-numbers hypotheses in a test of strong inference (Platt, 1964).
The primary aim of Experiment 1 was to test the competing directionality and receivers-prefer-numbers hypotheses. Recall that the directionality hypothesis predicts a three-way interaction effect between format (i.e., verbal or numeric), accuracy (inaccurate or accurate) and probability level (low or high) on credibility, whereas the receivers-prefer-numbers hypothesis predicts a main effect of format on credibility favoring numeric probabilities. Under the directionality hypothesis, when communicated probabilities are low, it is expected that verbal probabilities will bolster credibility for accurate forecasts and numeric probabilities will do so for inaccurate forecasts. And, when communicated probabilities are high, no interaction between format and accuracy is expected to occur.
A secondary aim of Experiment 1 is methodological. Jenkins et al. (2017, 2018) examined the effect of communication format on credibility by analyzing differences in credibility ratings before and after the accuracy of a forecaster’s prediction was known. Given that the authors used brief hypothetical scenarios, we question whether participants had an adequate basis for judging credibility prior to outcome information. Asking participants to rate a forecaster’s credibility while lacking sufficient evidence to do so violates the maxim of quality (Hilton, 1990; Schwarz, 1999). We aimed to avoid putting participants in a pragmatically awkward situation that might threaten the test validity of the resultant data. Asking questions about credibility prior to receiving outcome information might also draw attention to the credibility construct and this could influence post-outcome credibility ratings. Accordingly, we measured credibility only after outcome information was provided and the implications of such information for hypothetical decisions undertaken by the participant in the scenario were known.
Two hundred fifty-eight participants (151 males) were recruited using the online crowdsourcing service Qualtrics Panels. Participants were required to be between 18–60 years of age (M = 44.59, SD = 11.29), fluent in English, either a Canadian or American citizen, and possess at least a high-school diploma. Participants were also not allowed to complete the experiment on a smartphone. Participants who provided the same or equivalent answer for every Likert scale were replaced. The sample size reflects the final post-replacement count.
Participants were randomly assigned to eight conditions in a 2 (Format: verbal, numeric) × 2 (Probability level: low, high) × 2 (Accuracy: inaccurate, accurate) between-subject design. For the numeric condition, we used point estimates rather than ranges or confidence intervals. We consulted three systematic reviews (Barnes, 2016; Mosteller & Youtz, 1990; Theil, 2002) to select a set of equivalent verbal and numeric probabilities in both the high- and low-probability level conditions. For the low-probability level, we used unlikely for the verbal expression and about a 20% chance for the numeric expression. For high-probability level, we used likely for the verbal expression and about a 70% chance for the numeric expression. These values correspond to the approximate mean interpretation of unlikely and likely (rounded to the nearest 5%) identified in the reviews.
Participants first gave consent and were screened for inclusion/exclusion criteria. The experiment was embedded within a larger online survey consisting of two other unrelated experiments. The order of the experiments was counterbalanced, and participants were debriefed on all experiments at the end of the survey. In the relevant experiment, participants read a vignette about a personal investment opportunity. A financial advisor communicated the probability that a fictional stock would substantially increase in value. Participants were asked to imagine that they acted upon this advice, resulting in either significant personal gain or loss depending on the accuracy of the prediction. The specific vignette showing the manipulation of factors follows; the format and level manipulations are shown in square brackets and the accuracy manipulation is shown in curly brackets:
You are looking to invest in the stock market in the hopes of returning substantial profits. You’re looking for stocks that offer favourable odds of substantial profit and you’re looking to avoid stocks that don’t fit this description. You consult a financial advisor recommended to you by a close friend regarding your investment plan for the next year, and you explain your objectives. Among other information, the advisor draws your attention to a key forecast: Bayosia Corp’s stock [is unlikely/is likely/has about a 20% chance/has about a 70% chance] to substantially increase over the next year. [emphasis in original]You act on the analyst’s forecast and [do not invest/invest] in Bayosia Corp. At the end of the year, you find that the stock substantially{increased/decreased} in value. As a result, you are now much {richer/poorer} than you would have been {had you not/had you} purchased the stock.
Participants responded to the following questions presented in the order shown below. Response scales are shown in parentheses. (1) “Given the advisor’s forecast that Bayosia Corp’s stock [is unlikely/is likely/has about a 20% chance /has about a 70% chance] to substantially increase, how surprising is the outcome?” (0 = not at all, 10 = completely). (2) “How accurate do you think the advisor’s forecast was?” (−5 = completely inaccurate, +5 = completely accurate). (3) “How much {blame/credit} does the advisor deserve for your {worsened/improved} financial position at the end of the year?” (0 = none at all, 10 = completely). (4) “How much trust would you place in this advisor in the future?” (0 = none at all, 10 = completely).1
We first combined our measures into a credibility scale that served as our dependent measure. We initially tested a four-item scale comprised of surprise, accuracy, credit (responses were reverse coded for subjects who judged blame), and trust. A three-item credibility scale including accuracy, credit, and trust was found to be highly reliable (Cronbach’s α = .82, ωt = .86; Revelle & Zinbarg, 2008). However, the inclusion of surprise lowered the reliability and was excluded.
To test the effects of format, probability level and accuracy on credibility, we conducted a three-way factorial analysis of variance (ANOVA), which revealed a main effect of accuracy (F(1, 250) = 198.18, p < .001, ηp2 = .442), and no main effect of format or probability level (i.e., p > .10). As one might expect, participants judged accurate forecasts (M = 6.97, SD = 2.04) to be more credible than inaccurate forecasts (M = 3.92, SD = 2.04). There were two significant two-way interactions — accuracy × format (F(1, 250) = 13.30, p < .001, ηp2 = .050) and accuracy × probability level (F(1, 250) = 18.60, p < .001, ηp2 = 0.067) — both of which were qualified by a significant three-way interaction effect (F(1, 250) = 14.44, p < .001, ηp2 = .055). As shown in Figure 1, which plots the three-way interaction, the findings strongly favor the directionality hypothesis in three important respects. First, when low-probability forecasts were inaccurate, the numeric-probability format bolstered credibility significantly more than the verbal-probability format (t(68) = 4.07, p < .001, d = 0.96). Second, when the low-probability forecast was accurate, the verbal-probability format bolstered credibility significantly more than numeric-probability format (t(62) = 3.13, p = .003, d = 0.80). Third, for high-probability forecasts, format did not affect credibility, regardless of whether the forecast was accurate or not (p > .10).
Figure 1: Mean credibility with 95% confidence intervals by format, probability level, and accuracy.
Experiment 1 provided a successful conceptual replication of Jenkins et al.’s (2017, 2018) key findings. Within the low-probability, inaccurate condition, participants in the numeric-probability condition rated credibility higher than participants in the verbal-probability condition. And within the high-probability, inaccurate condition, consistent with Jenkins et al. (2017, Experiment 2), perceived credibility did not differ by format. However, going beyond Jenkins et al.’s findings, Experiment 1 provides strong support for the directionality hypothesis by confirming the predicted three-way interaction effect on credibility. Specifically, we observed the predicted reversal of format effects in the low-probability accurate condition in which the advisor’s verbal-probability forecast bolstered credibility more than the corresponding numeric-probability forecast. Moreover, we observed the elimination of format effects in high-probability condition in which the directionality of both formats is expected to agree. The results unambiguously lend greater support to the directionality hypothesis than to the receivers-prefer-numbers hypothesis. Nevertheless, it is vital to test whether the three-way interaction effect observed in Experiment 1 is repeatable, a task we performed in Experiment 2.
Experiment 2 was motivated by five aims. The first aim of Experiment 2 was to replicate Experiment 1 in order to test whether the three-way (Format × Probability level × Accuracy) interaction effect on perceived credibility obtained in Experiment 1 was repeatable. A second, related aim was to provide a more incisive test of the directionality hypothesis, which that three-way interaction supported. In Experiment 1, the effect of accuracy on credibility was substantial with one notable exception: the low-numeric-probability condition. The directionality hypothesis predicts this effect because low, numeric probabilities are directionally ambiguous. Accordingly, we hypothesized that such ambiguity will affect participants’ judgments of the extent to which the advisor provided a clear recommendation. We expected that the effect of format to be more pronounced in the low-probability condition. That is, we predicted that recommendation clarity would be judged to be greater in the verbal-probability condition than in the numeric-probability condition, especially when the advisor gave a low-probability forecast. Moreover, we predicted that credibility would vary as function of the accuracy × recommendation-clarity interaction. Specifically, we predicted that if recommendations are judged to be clear and they prove to be accurate, credibility would be bolstered. Conversely, we predicted that if recommendations are judged to be clear but they prove to be inaccurate, credibility would be diminished.
A third aim of Experiment 2 was to examine whether participants judged the numeric-probability format to provide clearer indications of forecast probability than the verbal-probability format. Several studies have shown that receivers prefer numeric probabilities to verbal probabilities (Brun & Teigen, 1988; Erev & Cohen, 1990; Murphy et al., 1980; Olson & Budescu, 1997; Wallsten et al., 1993) and this is believed to be due in part to the greater clarity that numeric probabilities convey. Therefore, although we expected verbal probabilities to convey implicit recommendations more clearly than numeric probabilities due to their salient directionality cues, we expected numeric probabilities to convey clearer information about probability levels due to their precision.
A fourth aim of Experiment 2 was to test an alternative accuracy-monitoring hypothesis that could potentially explain the three-way interaction effect observed in Experiment 1. Recall that in Experiment 1 we matched the terms unlikely and likely with numeric probabilities of .2 and .7, respectively, based on the findings of two systematic reviews. It is possible that participants in the verbal-probability condition deviated from these expected equivalents in a systematic manner. Such variation in the interpretation of the verbal probabilities might affect their perceived accuracy in ways that could not be tested in Experiment 1. In particular, if participants tended to interpret unlikely as substantially lower than .2 (i.e., the low-probability value in the numeric-probability condition), it would increase the inaccuracy relative to the numeric-probability condition of the advisor’s forecast in the inaccurate condition just as it would increase the relative accuracy of the forecast in the accurate condition. Conversely, the absence of format effects in the high-probability conditions might occur if most participants interpreted likely as about .7. The accuracy-monitoring hypothesis is less elegant than the directionality hypothesis because it requires arbitrary conditions to hold (i.e., unlikely is not interpreted as roughly .2 but likely is interpreted as roughly .7) for it to explain the three-way interaction effect on credibility predicted by the directionality hypothesis and observed in Experiment 1. Nevertheless, it is important to test (and possibly rule out).
A fifth aim of Experiment 2 was to examine the extent to which accuracy measured using an objective scoring rule — namely, mean absolute error (MAE; Mandel, Karvetski & Dhami, 2018) — would covary with judged credibility. We hypothesized that MAE would be more strongly correlated with credibility in the numeric-probability condition than in the verbal-probability condition because the former was expected to make probability information clearer, whereas the latter was expected to make implicit recommendations for stock-purchase decision-making clearer.
An a priori power analysis simulation was conducted for Experiment 2. We determined that at least 600 participants (75 per condition) would be necessary to ensure a greater than 95% probability of replicating the observed main and interaction effects on credibility in Experiment 1. We recruited 601 (305 males) participants using Qualtrics Panels using the identical inclusion/exclusion criteria as in Experiment 1. The sample size reflects the final post-replacement count.
The design used for Experiment 2 was identical to Experiment 1.
Participants first gave consent and were screened for inclusion/exclusion criteria. Like Experiment 1, the experiment was embedded within a larger online survey consisting of unrelated experiments. The order of the experiments was counterbalanced, and participants were debriefed on all experiments at the end of the survey. In the relevant experiment, participants read the same vignette as in Experiment 1, but with an important difference. Specifically, participants were not immediately informed about the outcome. Instead, following the advisor’s forecast participants answered questions about their interpretation of the forecast.
Participants responded to the following questions presented in the order shown below. Format and probability level manipulations are shown in square brackets, and response scales are shown in parentheses. (1) “How clearly did the advisor’s forecast communicate the probability that outcome [would/would not] occur?” (0 = not at all, 10 = exceptionally well). (2) “How clearly did the advisor’s forecast communicate a recommendation [to invest/to not invest]?” (0 = not at all, 10 = exceptionally well). Participants assigned to the verbal-probability condition answered (3a) “What numeric probability (in percent chances) do you think best captures the meaning of [unlikely/likely]?” (0 to 100 in unit increments), whereas those assigned to the numeric-probability condition answered (3b) “What verbal probability expression do you think best captures the meaning of ‘about a [25%/75%] chance?’” (‘remote chance’, ‘highly unlikely’, ‘unlikely’, ‘even chance’, ‘likely’, ‘highly likely’, or ‘almost certain’). In Experiment 2, we slightly altered the numeric probability equivalents so that they equally represent prototypical fractions (i.e., 25% = 1/4 and 75% = 3/4).
On the following screen, participants were reminded of the forecast and told that they acted upon it (i.e., they invested if the probability level was high and did not if the probability level was low) before learning the outcome before learning the outcome. Participants then responded to the following questions presented in the order shown below. Accuracy conditions are shown in curly brackets, and response scales are again shown in parenthesis. (1) “How accurate do you think the advisor’s forecast was?” (−5 = completely inaccurate, +5 = completely accurate). (2) “How much {blame/credit} does the advisor deserve for your {worsened/improved} financial position at the end of the year?” (0 = none at all, 10 = complete). (3) “How much trust would you place in this advisor in the future?” (0 = none at all, 10 = complete).
As a manipulation check, we verified that the low- and high-probability numeric probabilities we used were, on average, interpreted as unlikely and likely, respectively. In fact, the modal and median translations of “about a 25% chance” and “about a 75% chance” were unlikely and likely, respectively.
To examine the replicability of our findings from Experiment 1, we computed the three-item credibility scale used in the previous experiment (α = .84, ωt = .85) and then ran a three-way (Format × Probability Level × Accuracy) factorial ANOVA on credibility ratings. We found a significant main effect of accuracy (F (1, 593) = 306.29, p < .001, ηp2 = .341), and no main effect of format or probability level. As expected, participants rated accurate forecasts (M = 5.50, SD = 2.16) as more credible than inaccurate forecasts (M = 2.61, SD = 2.18). Both of the two-way interactions that were significant in Experiment 1 were also significant in Experiment 2: for accuracy × format (F(1, 593) = 29.29, p < .001, ηp2 = .047); for accuracy × probability level (F(1, 593) = 62.82, p < .001, ηp2 = .096). These interactions were qualified by a significant three-way interaction (F (1, 593) = 6.21, p = .013, ηp2 = .010). As shown in Figure 2, the results replicate the precise pattern of findings in Experiment 1 and support the directionality hypothesis. When low-probability forecasts were inaccurate, the numeric-probability forecast was judged to be significantly more credible than the verbal-probability forecast (t(146) = 4.90, p < .001, d = 0.80). Conversely, when the low-probability forecast was accurate, the verbal-probability forecast were judged to be significantly more credible than numeric-probability forecast (t(143) = 2.75, p = .007, d = 0.46). Finally, credibility did not differ by format in either high-probability condition.
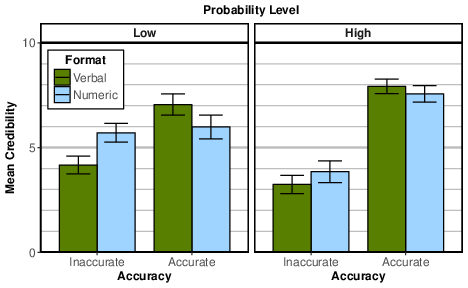
Figure 2: Mean credibility with 95% confidence intervals by format, probability level, and accuracy.
Next, we ran a mixed ANOVA on clarity of the advisor’s forecast. Format and probability level were between-subject factors and aspect of clarity (probability, recommendation) was a repeated measure. There was a main effect of probability level (F(1, 597) = 45.29, p < .001, ηp2 = .071). Forecasts with high probabilities (M = 6.74, SD = 2.23) were judged to provide both clearer indications of probability and clearer recommendations than low probability forecasts (M = 5.58, SD = 2.99). There were two significant two-way interactions: for format × probability level (F(1, 597) = 6.27, p = .013, ηp2 = .010); and for format × aspect (F(1, 597) = 46.94, p < .001, ηp2 = .073). The two-way interactions were qualified by a significant three-way interaction (F (1, 597) = 19.14, p < .001, ηp2 = .031). As can be seen in Figure 3, verbal-probability forecasts were rated as providing greater recommendation clarity than probability clarity for low-probability forecasts (t(140) = 4.60, p < .001, d = 0.46), and marginally so for high-probability forecasts (t(152) = 1.66, p = .100, d = 0.12). In contrast, numeric-probability forecasts were rated as providing greater probability clarity than recommendation clarity for both low-probability forecasts (t(151) = 4.31, p < .001, d = 0.48), and for high-probability forecasts (t(154) = 2.07, p = .040, d = 0.15). This interaction confirms our hypothesis that numeric-probability forecasts provided greater probability clarity than recommendation clarity whereas verbal-probability forecasts provided greater recommendation clarity than probability clarity. The interaction also further supports the directionality hypothesis. Specifically, recommendation clarity of numeric-probability forecasts was greater than for verbal-probability forecasts in the low-probability condition (t(291) = 5.43, p < .001, d = 0.64), but the two formats did not differ in the high-probability condition, p < .6. The low-probability condition was also least affected by the accuracy manipulation in the analysis of credibility.
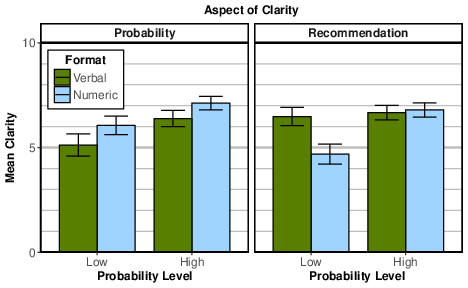
Figure 3: Mean clarity with 95% confidence intervals by format, probability level, and aspect of clarity.
To provide a direct test of the interactive effect of recommendation clarity and accuracy on credibility, we computed the product of recommendation clarity and a centered accuracy vector (i.e., −1 = inaccurate, 1 = accurate). Further supporting the directionality hypothesis, this interaction term was strongly correlated with perceived credibility (r(599) = .60, p < .001).
Next, we tested the competing accuracy-monitoring hypothesis. Recall that to account for the three-way interaction effect on credibility obtained in Experiments 1 and 2, the accuracy-monitoring hypothesis predicts that the term unlikely would be interpreted as more extreme than the numeric equivalent we had set (i.e., .2), whereas the term likely would be interpreted as comparable to the numeric equivalent we had set (i.e., .7). Contrary to that hypothesis, among participants in the verbal-probability condition, the low-probability term unlikely (M = 48.30, SD = 27.00) was translated to values that were, on average, significantly higher than the translation value we had set (i.e., 25%) (t(140) = 10.25, p = .001). Also contrary to the accuracy-monitoring hypothesis, the term likely (M = 63.24, SD = 19.70) was translated to values that were, on average, significantly lower than the translation value of 75% (t(152) = −7.38, p < .001).
Although the average interpretation of unlikely does not support the accuracy-monitoring hypothesis, one might still expect that an objective measure of accuracy — namely, one that is independent of participants’ accuracy ratings, would be positively correlated with credibility. Accordingly, we calculated MAE by subtracting truth values (i.e., 0 if the forecasted event did not occur and 1 if it did occur) from the advisor’s numeric-probability forecast in the numeric-probability conditions and from participants’ numeric-probability equivalents in the verbal-probability conditions. Due to the different bases of forecasted probability in the two format conditions, we analyzed the correlations separately for numeric- and verbal-probability formats. In both cases, MAE yields a score from 0 (perfect accuracy) to 1 (maximal inaccuracy). As expected, the correlation between MAE and credibility was significant in the numeric-probability condition (r(305) = −.40, p < .001) and in the verbal-probability condition (r(292) = −.26, p < .001), although the latter correlation was marginally smaller in absolute value than the former (z = 1.92, p = .055). Recall that the recommendation clarity × accuracy interaction also correlated with credibility. Accordingly, we examined the partial correlation between credibility and MAE controlling for this interaction. The partial correlation was not significant and virtually nil in both the numeric-probability condition (r(304) = .04, p = .51) and the verbal-probability condition (r(291) = −.03, p = .56). In contrast, controlling for MAE, the recommendation clarity × accuracy interaction significantly correlated significantly with credibility in both the numeric-probability condition (r(304) = .25, p < .001) and the verbal-probability condition (r(291) = .70, p < .001). The difference between these correlations was significant (z = 7.46, p < .001).
The preceding findings raise a related question — are participants’ judgments of the advisor’s forecast accuracy similarly influenced more strongly by the compatibility of implicit recommendations and outcomes than by an objective measure of accuracy (i.e., MAE)? In fact, the results were virtually identical: Controlling for the recommendation clarity × accuracy interaction, the partial correlation between MAE and judged accuracy was not significant in both the numeric-probability condition (r(304) = −.06, p = .29) and the verbal-probability condition (r(291) = .03, p = .56). In contrast, controlling for MAE, the recommendation clarity × accuracy interaction was significantly correlated with judged accuracy in both the numeric-probability condition (r(304) = .17, p = .003) and the verbal-probability condition (r(291) = .68, p < .001).
Using a sample size more than double that of Experiment 1, Experiment 2 demonstrated the repeatability of the higher-order (format × probability level × accuracy) interaction effect on the perceived credibility of forecasters. Indeed, the specific form of that interaction, which the directionality hypothesis predicts, was replicated. Experiment 2 provided additional support for the directionality hypothesis by ruling out a competing accuracy-monitoring hypothesis. Contrary to the latter hypothesis, translations of unlikely were, on average, less rather than more extreme than our translation value of 25%, and interpretations of likely were also significantly regressive relative to our reference value of 75%. Providing even stronger support for the directionality hypothesis, we found that the interaction between recommendation clarity and accuracy strongly covaried with credibility. That interaction dwarfed the effect of objective accuracy on credibility assessments and even on subjective accuracy. Evidently, accuracy monitoring does little to shape judgments of credibility once people have factored in the congruence between outcome information and what they pragmatically inferred to be the implicit recommendation of the advisor. In the present research, this is striking given the fact that the advisor in the scenario did not make an explicit recommendation but did state a probabilistic forecast that could be scored for accuracy.
The present research yielded several important findings that shed light on how probability format affects the perceived credibility of advisors’ forecasts. First, in two experiments with over 850 participants we verified that the effects reported by Jenkins et al. (2017, 2018) are replicable. The fact that we conceptually replicated their effects with several variants in our design speaks to the robustness of those effects. However, the findings also clearly show that the effects reported by Jenkins et al. (2017, 2018) are subsumed within a larger, replicable pattern of results. For instance, whereas we showed that numeric probabilities are credibility bolstering compared to verbal probabilities for forecasts that involve low-probability, incorrect estimates, we also showed that this effect is reversed if the low-probability estimates are correct. We also showed that far from being an anomalous result, as Jenkins et al. (2017) suggested, the lack of a format effect for high-probability forecasts is replicable both for inaccurate and accurate forecasts.
Secondly, our findings helped to judge support for two viable competing hypotheses. Jenkins et al.’s (2017, 2018) findings could be explained in terms of a general preference for receiving numeric- rather than verbal-probability information or it could be explained in terms of effects owing to the differential directionality of these modes of communicating probabilities. The results of both experiments unambiguously support the directionality hypothesis. Neither experiment yielded an unqualified format effect showing that numeric probabilities maintain credibility better than verbal probabilities. Rather, in both experiments we obtained a specific form of three-way interaction between communication format, probability level, and forecast accuracy that is predicted by the directionality hypothesis.
The directionality hypothesis entails the following propositions. First, it posits that verbal and numeric probabilities alike communicate directionality, which in turn leaks information about an advisor’s implicit recommendations even if no explicit recommendation is given (Teigen & Brun, 1999). Rather than proposing a stable probability-format preference, the directionality hypothesis posits that perceptions of credibility and accuracy reflect the degree of congruence between directionality of the prediction and the manifested outcome. In the present research, high-probability words and numbers pointed in the same direction and suggested similar inferences about the advisor’s recommendation for action. However, for low probabilities, the two formats differed in directionality. The term unlikely is pessimistic and may have suggested a recommendation against investing. However, the “low” numeric probability—low in the sense that it assigned a lower probability to the focal event than to its complement—may have signalled optimism (Teigen & Brun, 2000), especially if the assumed base-rate for stock-market success was judged to be very low (Bilgin & Brenner, 2013). If it was not perceived as outright positive in directionality, then it was at least likely to be directionally ambiguous, causing uncertainty about recommended courses of action. In fact, Experiment 2 confirmed this by showing that forecasts comprised of low, numeric probabilities were judged to be less clear in their recommendations than low, verbal-probability forecasts. These findings cohere well with Bilgin and Brenner’s (2013) findings that low numeric probabilities are directionally ambiguous and their interpretation is more susceptible than high numeric probabilities to the base-rate of focal events.
Whereas probability level moderates the directionality disparity between numeric and verbal probability formats, accuracy moderates the effect of that disparity on credibility. If no more than a weak disparity exists, credibility is influenced by accuracy but not by format. This simple effect of accuracy was evident in both experiments: as one might expect, credibility was greater in the accurate condition than in the inaccurate condition. When there are disparities in directionality, as in the case of low-probability forecasts, the effect is determined by the accuracy of forecasts. Forecasts conveying clear recommendations that prove to be accurate will bolster credibility, whereas forecasts conveying clear recommendations that prove to be inaccurate weaken credibility. In short, the clearer signalling of directionality that verbal probabilities convey can cut both ways — it depends on whether the implicit recommendations that the directional cues signal to would-be decision makers prove to be good advice or not. This was shown directly in Experiment 2 by the strong correlation between credibility and the interaction between accuracy and recommendation clarity — a correlational effect that dwarfed the corresponding effect of objective accuracy on credibility.
A third noteworthy finding of the present research is that numeric probabilities are judged to be clearer than verbal probabilities in terms of their ability to convey probability information. This result held for both low- and high-probability forecasts and it may explain why receivers of probabilistic estimates tend to prefer to receive numeric estimates rather than verbal estimates (e.g., Brun & Teigen, 1988; Erev & Cohen, 1990; Murphy et al., 1980; Olson & Budescu, 1997; Wallsten et al., 1993): the former better inform them about relevant likelihoods that they may have to factor into their decision processes. For instance, when seeking a weather forecast, one might be more interested to know the probability of precipitation than if the forecaster thinks you should carry an umbrella or stay home. Of course, in unusual or extreme circumstances, such as a tornado threat, receivers might prefer advice that guides their action and is likely to mitigate risk. Future research could test whether, in such cases, one observes a corresponding shift in preference towards receiving verbal-probability estimates or whether the preference for numeric estimates is maintained. For instance, in support of the “maintenance hypothesis”, in high-risk situations such as an impending hurricane, vague communications about threat probabilities might augment fear and anxiety more than point the way to action.
A fourth key result was that objective accuracy (i.e., scored on the basis of MAE) covaried less strongly with credibility when the advisor’s forecast was conveyed using verbal rather than numeric probabilities. This is to be expected given that, compared to participants in the verbal-probability condition, participants in the numeric-probability condition found the forecast to provide clearer information about probability and less clear information about the advisor’ recommendation. Scoring rules like MAE are sensitive to variations in assigned probability and not to variations in recommendation signal. Our correlational results suggest that participants’ ratings of clarity were valid as those provided with numeric-probability forecasts were in fact better equipped to track accuracy. However, even among participants who received numeric-probability forecasts, objective accuracy was uncorrelated with credibility once the interaction between recommendation clarity and accuracy was partialled out. Even more remarkably, after controlling for this interaction, objective and subjective accuracy measures were virtually uncorrelated. Taken together, the findings suggest that implicit recommendation accuracy — namely, the degree to which the participant’s inferred recommendation of the forecaster coheres with eventual outcomes — is a much more influential determinant of credibility than objective accuracy.
A limitation of our studies was that they used a single vignette-style task. It would be useful in future research to manipulate task characteristics that probe the generalizability of these findings and test hypotheses about moderators of those effects. Much could be accomplished with additional vignettes. Given that our present experiment exclusively used a prediction of a positive event- a chance for financial profit- an obvious candidate for future investigation would be to manipulate the type of outcome to explore content effects (Rettinger & Hastie, 2001). For instance, given that losses loom larger than gains (Kahneman & Tversky, 1979), we might predict a greater preference for ‘correct’ directionality if the prediction concerned the chance of avoiding a substantial loss. Furthermore, cases involving threats to human life might yield different results. Evidence suggests that decisions involving saving human life activate the dorsal striatum, whereas decisions to save money activate the posterior insula (Vartanian, Mandel & Duncan, 2011). The dorsal striatum has been implicated in context-dependent reward processing (Delgado, Locke, Stenger & Fiez, 2003), whereas the posterior insula has been implicated in probability signalling and risk prediction (O’Doherty et al., 2004). One might therefore predict even stronger support for the directionality hypothesis if the vignettes concerned decisions about saving lives. Behavioral tasks could also be used to build on the present research. For example, participants could be asked to choose between two advisors, one that gave probabilistic estimates numerically and another than gave them verbally. Error rates for each advisor could be held constant or systematically manipulated to allow researchers to study their trajectories of trust — namely, the decisions they make about which advisor to turn to over repeated trials.
Another limitation of the present research is that we examined only two verbal probability expressions — unlikely and likely. These expressions are important because they are among the most frequently employed by individuals (Mosteller & Youtz, 1990; Theil 2002) and organizations (Barnes, 2016; Ho, Budescu, Mandel & Dhami, 2015; Morgan, 1998). However, other terms will be useful to employ for the purpose of putting the directionality hypothesis to other empirical tests. In particular, the verbal probabilities we used have directionality consistent with their probability level. That is, unlikely conveys low probability and negative directionality, whereas likely conveys high probability and positive directionality. In contrast, low probability phrases such as a small chance conveys positive directionality, whereas high probability verbal phrases such as not entirely certain conveys negative directionality (Teigen & Brun, 1993, 1999, 2000). Such “incongruent” phrases could be used in future research to test the robustness of the directionality hypothesis. For instance, one might hypothesize that a small chance may be perceived more similarly to about a 25% chance than to unlikely. Conversely, the difference between not entirely certain and about a 75% chance may yield a format by accuracy interaction effect akin to that observed in the low-probability condition of the present research. Such findings would strengthen the link between the present research and the broader literature on reasoning in responses to agreement or disagreement between directionality and the probabilistic information conveyed (Oaksford & Chater, 2019; Schmeltzer & Hilton, 2014).
A third limitation of the present research involves its reliance on attempting to equate probability levels across numeric- and verbal-probability formats. As our results showed, it is no easy task to set even an average probability equivalent. We drew on multiple systematic reviews (Barnes 2016; Mosteller & Youtz, 1990; Theil 2002) to set equivalents and yet we found that participants’ estimates regressed toward the midpoint of the probability scale, especially for the term unlikely. We are unsure why this occurred. One possibility is that many translation studies ask for the numeric equivalents of decontextualized probability terms, whereas we asked participants for translations of terms that were embedded in statements that, in turn, were meaningful within the context of the described scenario. Some studies that used a contextualized method have found numeric-probability translations to exhibit less inter-individual agreement (Beyth-Marom, 1982; Brun & Teigen, 1988; Wallsten et al., 1986) and to yield more regressive average or peak equivalents (e.g., Ho et al., Study 1; Budescu, Por, Broomell & Smithson, 2014), although at least one study (Mandel, 2015) that used a contextualized method found average estimates close to those indicated by the systematic reviews. The context in which verbal probabilities are used can also affect translation values, especially in samples that do not possess a high degree of forecasting expertise (Mellers, Baker, Chen, Mandel & Tetlock, 2017). Verbal-probability translations might have also been regressive because the focal term was not contrasted with other focal terms that might help to determine credible location on the probability scale (for discussion of this issue, see Hamm, 1991). In future research, a more controlled procedure might elicit probability equivalents in the first phase of an experiment and then test the effect of format within subjects across multiple scenarios that could be fully crossed with format. Such a design is not without limitations either because the translation process followed by exposure to both formats might cue participants to the experimental aims. Moreover, intra-individual reliability in such translations might still be low (Budescu & Wallsten, 1985). Nevertheless, triangulating results from studies using multiple methods should be informative.
Finally, a caveat about the “word-number” distinction we invoke in this paper is in order. We use the terms “words” and “numbers” as a linguistic device to highlight a key distinction. However, we are aware that both formats are nonetheless elements of language. “Numbers” as we have used them here are strictly speaking numeric quantifiers, whereas the “words” we have examined are fuzzy quantifiers (Zadeh, 1983). Both are embedded in sentential and semantic contexts in our studies, and both the numbers and words we examined are inextricably entangled with other words that together provide input for meaning. It would therefore be wrong to think of numeric probabilities used in language as non-linguistic devices, just as it has been wrong in framing research to assume that a numeric quantifier such as “200” means “exactly 200” in a statement like “If Program A is adopted, 200 lives will be saved” (Mandel, 2014; Teigen & Nikolaisen, 2009). More often than not, quantities are lower-bounded and given an “at least” interpretation (Halberg & Teigen, 2009).
In the present research, the probability level or “chance” modified by fuzzy quantifiers was left implicit, whereas it was made explicit for the numeric quantifiers. That is, we did not state in the verbal-probability condition that there was a likely or unlikely chance of the relevant outcome as we did in the numeric-probability condition (e.g., 25% chance). This experimental confound was intentional, as it tracks common usage in natural language. It is common to say x is likely, whereas one is uncommon to use numeric probabilities in statements without an explicit referent, such as chance, probability, or likelihood. However, as a reviewer of this paper noted, the term chance may have been interpreted as conveying positive directionality in itself. If so, it would cast doubt on our interpretation of the present findings. We do not share the reviewer’s view and instead hypothesize that words like chance or probability are directionally neutral and also less stable in their directionality than the modifiers that give them “location”. The disagreement might be tested as follows: if the root term chance is directionally positive and its modifier is negative (e.g., unlikely), those sharing the reviewer’s view might expect a term such as unlikely chance to be perceived as weakly positive (due to attenuation of positivity in the root term by the modifier), neutral (due to cancellation), or ambiguous (due to fluctuation). In contrast, we expect it will be interpreted as directionally negative much like the term unlikely on its own. Future research along such lines could easily test these competing hypotheses.
Our findings have implications for organizations mandated to provide expert judgment to decision-makers. For example, as noted earlier, intelligence organizations routinely provide probabilistic estimates on a wide range of future events of national security interest to policymakers. Virtually all intelligence organizations use curated sets of verbal probability terms to do so (a tradition that traces back to Kent, 1964) despite the well-documented shortcomings of this approach, most of which could be obviated by the use of numeric probabilities (Barnes, 2016; Dhami, Mandel, Mellers & Tetlock, 2015; Friedman, 2019; Ho et al., 2015; Irwin & Mandel, 2019). The main reason for such calls — voiced also in other areas such as medicine (Nakao & Axelrod, 1983; Robertson, 1983), climate science (Budescu et al., 2014), and public policy (Morgan, 1998) — has been to mitigate the vagueness of verbal probabilities and the corresponding lack of agreement in their interpretation. However, our findings provide another basis for skepticism — namely, that verbal probabilities are substantially clearer than numeric probabilities when it comes to implying recommendations that are not explicitly stated. In cases where nudging behavior or influencing opinion is a goal of communication this may be desirable, and there is some evidence that using verbal probabilities may provide a tactical advantage over numeric probabilities (Piercey, 2009). However, intelligence and many other areas of expert judgment are supposed to be policy neutral, not influence-centric. In such cases, the main assessment function is to inform the decision maker about critical uncertainties (Friedman & Zeckhauser, 2012).
Policymakers may certainly call on analysts to provide advice, but in such cases the recommendations should be explicit, as should their warrants, and these should not be conflated with probabilistic assessments. The latter should always be communicated in ways that mitigate implicit recommendations, which could bias policymakers towards the analysts’ policy preferences or, conversely, bias analysts to use probabilistic language that better aligns with policymakers’ known preferences. Our findings show that not only do numeric probabilities more clearly convey probabilistic information they also less clearly convey the sort of high-deniability, implicit recommendations that are out of scope in intelligence assessments and other expert forecasts that claim to be value neutral. Both of these features recommend the use of numeric probabilities in communicative contexts where information and advice should be clearly delineated.
Armstrong, J. S. (2001). Standards and practices for forecasting. Principles of forecasting: A handbook for researchers and practitioners. Norwell, MA: Kluwer Academic Publishers.
Barnes, A. (2016). Making intelligence analysis more intelligent: using numeric probabilities. Intelligence and National Security, 31, 327–344
Beyth-Marom, R. (1982). How probable is probable? Numerical translation of verbal probability expressions. Journal of Forecasting, 1, 257–269.
Bilgin, B. & Brenner, L. (2013). Context affects the interpretation of low but not high numeric probabilities: A hypothesis testing account of subjective probability. Organizational Behavior and Human Decision Processes, 121, 118–128.
Brun, W. & Teigen, K. H. (1988). Verbal probabilities: ambiguous, context-dependent, or both? Organizational Behavior and Human Decision Processes, 41, 390–404.
Budescu, D. V., Por, H., Broomell, S., & Smithson, M. (2014). Interpretation of IPCC probabilistic statements around the world. Nature Climate Change, 4, 508–512.
Budescu, D. V. & Wallsten, T. S. (1985). Consistency in interpretation of probability phrases. Organizational Behavior and Human Decision Processes, 36, 391–405.
Budescu, D. V., & Wallsten, T. S. (1995). Processing linguistic probabilities: General principles an empirical evidence. Psychology of Learning and Motivation, 32, 275–318.
Delgado, M. R., Locke, H. M., Stenger, V. A., & Fiez, J. A. (2003). Dorsal striatum responses to reward and punishment: Effects of valence and magnitude manipulations. Cognitive, Affective, & Behavioral Neuroscience, 3, 27–38.
Dhami, M. K., Mandel, D. R., Mellers, B. A., & Tetlock, P. E. (2015). Improving intelligence analysis with decision science. Perspectives on Psychological Science, 106, 753–757.
Dieckmann, N. F., Mauro, R., & Slovic, P. (2010). The effects of presenting imprecise probabilities in intelligence forecasts. Risk Analysis, 30, 987–1001.
Erev, I., & Cohen, B. L. (1990). Verbal versus numerical probabilities: Efficiency, biases, and the preference paradox. Organizational Behavior & Human Decision Processes, 44, 1–18.
Friedman, J. A. (2019). War and chance: Assessing uncertainty in international politics. New York, NY: Oxford University Press.
Friedman, J. A., & Zeckhauser, R. (2012). Assessing uncertainty in intelligence. Intelligence and National Security, 27, 824–847.
Guilamo-Ramos, V., Jaccard, J., Dittus, P., & Bouris, A. M. (2006). Parental expertise, trustworthiness, and accessibility: parent-adolescent communication and adolescent risk behavior. Journal of Marriage and Family, 68, 1229–1246.
Halberg, A.-M., & Teigen, K. H. (2009). Framing of imprecise quantities: When are lower interval bounds preferred to upper bounds? Journal of Behavioral Decision Making, 22, 490–509.
Hamm, R. M. (1991). Selection of verbal probabilities: A solution for some problems of verbal probability expression. Organizational Behavior and Human Decision Processes, 48, 193–223.
Hilton, D. J. (1990). Conversational processes and causal explanation. Psychological Bulletin, 107, 65–81.
Ho, E. Budescu, D. V., Dhami, M. K., & Mandel, D. R. (2015). Improving the communication of uncertainty in climate science and intelligence analysis. Behavioral Science & Policy, 1, 43–55.
Hovland, C. I., Janis, I. L., & Kelley, H. H. (1953). Communication and persuasion: Psychological studies of opinion change. New Haven, CT: Yale University Press.
Irwin, D. & Mandel, D. R. (2019). Improving information evaluation for intelligence production. Intelligence and National Security, 34, 503–525.
Jenkins, S. C., Harris, A. J. L., & Lark, R. M. (2017). Maintaining credibility when communicating uncertainty: The role of communication format. In G. Gunzelmann, A. Howes, T. Tenbrink, & E. J. Davelaar (Eds.), Proceedings of the 39th Annual Conference of the Cognitive Science Society (pp. 582–587). Austin, TX: Cognitive Science Society.
Jenkins, S. C., Harris, A. J. L., & Lark, R. M. (2018). When unlikely outcomes occur: the role of communication format in maintaining communicator credibility. Journal of Risk Research, 22, 537–554.
Jerez-Fernandez, A., Angulo, A. N., & Oppenheimer, D. M. (2014). Show me the numbers: Precision as a cue to others’ confidence. Psychological Science, 25, 633–635.
Kent, S. (1964). Words of estimative probability. Studies in Intelligence, 8(4), 49–65.
Mandel, D. R. (2019). Can decision science improve intelligence analysis? In S. Coulthart, M. Landon-Murray, & D. Van Puyvelde (Eds), Researching national security intelligence: Multidisciplinary approaches (pp. 117–140). Washington, DC: Georgetown University Press.
Mandel, D. R. (2014). Do framing effects reveal irrational choice? Journal of Experimental Psychology: General, 143, 1185–1198.
Mandel, D. R. (2015). Accuracy of intelligence forecasts from the intelligence consumer’s perspective. Policy Insights from the Behavioral and Brain Sciences, 2, 111–120.
Mandel, D. R., Karvetski, C. W., & Dhami, M. K. (2018). Boosting intelligence analysts’ judgment accuracy: what works, what fails? Judgment and Decision Making, 13, 608–621.
Mellers, B. A., Baker, J. D., Chen, E., Mandel, D. R., & Tetlock, P. E. (2017). How generalizable is good judgment? A multi-task, multi-benchmark study. Judgment and Decision Making, 12, 369–381.
Morgan, M. G. (1998). Commentary: Uncertainty analysis in risk assessment. Human and Ecological Risk Assessment, 4, 25–39.
Mosteller, F., & Youtz, C. (1990). Quantifying probabilistic expressions. Statistical Science, 5, 2–12.
Murphy, A. H., Lichtenstein, S., Fischhoff, B., & Winkler, R. L. (1980). Misinterpretation of precipitation probability forecasts. Bulletin of the American Meteorological Society, 6, 695–701.
Nakao, M. A., & Axelrod, S. (1983). Numbers are better than words: Verbal specifications of frequency have no place in medicine. American Journal of Medicine, 74, 433–442.
Oaksford, M., & Chater, N. (2019). New paradigms in the psychology of reasoning. Annual Review of Psychology.
O’Doherty, J., Dayan, P., Schultz, J., Deichmann, R., Friston, K., & Dolan, R. J. (2004). Dissociable roles of ventral and dorsal striatum in instrumental conditioning. Science, 304, 452–454.
Olson, M. J., & Budescu, D. V. (1997). Patterns of preference for numerical and verbal probabilities. Journal of Behavioral Decision Making, 10, 117–131.
Piercey, M. D. (2009). Motivated reasoning and verbal vs. numeric probability assessment: Evidence from an accounting context. Organizational Behavior and Human Decision Processes, 108, 330–341.
Platt, J. R. (1964). Strong inference. Science, 146, 347–353.
Rettinger, D. A., & Hastie, R. (2001). Content effects on decision making. Organizational Behavior and Human Decision Processes, 85, 336–359.
Revelle, W., & Zinbarg, R. E. (2008). Coefficients alpha, beta, omega and the glb: comments on Sijtsma. Psychometrika, 74, 145–154.
Robertson, W. O. (1983). Quantifying the meaning of words. Journal of the American Medical Association, 249, 2631–2632.
Schmeltzer, C., & Hilton, D. J. (2013). To do or not to do? A cognitive consistency model for drawing conclusions from conditional instructions and advice. Thinking & Reasoning, 20, 16–50.
Schwarz, N. (1999). Self-reports: how the questions shape the answers. American Psychologist, 54, 93–105.
Sher, S. & McKenzie, C. R. M. (2006). Information leakage from logically equivalent frames. Cognition, 101, 467–494.
Smith, S. W. & Jucker, A. H. (2014). “Maybe, but probably not”: Negotiating likelihood and perspective. Language and Dialogue, 4, 284–298.
Stroebe, W., & Strack, F. (2014). The alleged crisis and the illusion of exact replication. Perspectives on Psychological Science, 9, 59–71.
Teigen, K. H., & Brun, W. (1995). Yes, but it is uncertain: Direction and communicative intention of verbal probabilistic terms. Acta Psychologica, 88, 233–258.
Teigen, K. H., & Brun, W. (1999). The directionality of verbal probability expressions: Effects on decisions, predictions, and probabilistic reasoning. Organizational Behavior and Human Decision Processes, 80, 155–190.
Teigen, K. H., & Brun, W. (2000). Ambiguous probabilities: when does p = 0.3 reflect a possibility, and when does it express a doubt? Journal of Behavioral Decision Making, 13, 345–362.
Teigen, K. H., & Brun, W. (2003). Verbal probabilities: a question of frame? Journal of Behavioral Decision Making, 16, 53–72.
Teigen, K. H., & Nikolaisen, M. I. (2009). Incorrect estimates and false reports: How framing modifies truth. Thinking & Reasoning, 15, 268–293.
Theil, M. (2002). The role of translations of verbal into numeric probability expressions in risk management: a meta-analysis. Journal of Risk Research, 5, 177–186.
Tetlock, P. E., (2002). Social functionalist frameworks for judgment and choice: Intuitive politicians, theologians, and prosecutors. Psychological Review, 109, 451–471.
Vartanian, O., Mandel, D. R., & Duncan, M. (2011). Money or life: Behavioral and neural context effects on choice under uncertainty. Journal of Neuroscience, Psychology, and Economics, 4, 25–36.
Wachinger, G., Renn, O., Begg, C. & Kuhlicke, C. (2013). The risk perception paradox — implications for governance and communication of natural hazards. Risk Analysis, 33, 1049–1065.
Wallsten, T. S., Budescu, D. V., Rapoport, A., Zwick, R., & Forsyth, B. (1986). Measuring the vague meanings of probability terms. Journal of Experimental Psychology: General, 115, 348–365.
Wallsten, T. S., Budescu, D. V., Zwick, R., & Kemp, S. M. (1993). Preferences and reasons for communicating probabilistic information in verbal or numerical terms. Bulletin of the Psychonomic Society, 31, 135–138.
Wiener, J. L., & Mowen, J. C. (1986). Source credibility: On the independent effects of trust and expertise. Advances in Consumer Research, 13, 306–310.
Willmott, C. J., & Matsuura, K. (2005). Advantages of the Mean Absolute Error (MAE) over the Root Mean Square Error (RMSE) in assessing average model performance. Climate Research, 30, 79–82.
Yaniv, I., Yates, J. F., & Smith, J. K. (1991). Measures of discrimination skill in probabilistic judgment. Psychological Bulletin, 110, 611–617.
Zadeh, L. A. (1983). A computation approach to fuzzy quantifiers in natural languages. Computers & Mathematics with Applications, 9, 149–184.
This research was supported by Department of National Defence projects #05da and #05fa, and Canadian Safety and Security Program project #2018-TI-2394. We thank Brenda Fraser, Tonya Hendriks, Daniel Irwin, and Serena Tran for their assistance with this research, and we thank Denis Hilton, Karl Teigen and William Skylark for helpful comments on an early draft of this article.
Copyright: © 2019. The authors license this article under the terms of the Creative Commons Attribution 3.0 License.
This document was translated from LATEX by HEVEA.