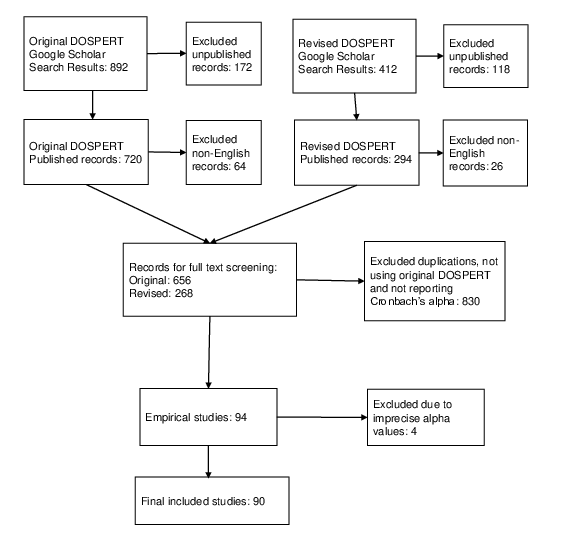
| Figure 1: Flow of screening studies. |
Judgment and Decision Making, Vol. 15, No. 1, January 2020, pp. 112-134
Assessing a domain-specific risk-taking construct: A meta-analysis of reliability of the DOSPERT scaleYiyun Shou* Joel Olney# |
The DOSPERT scale has been used extensively to understand individual differences in risk attitudes across varying decision domains since 2002. The present study reports a reliability generalization meta-analysis to summarize the internal consistency of both the initial and the revised versions of DOSPERT. It also examined factors that can influence the reliability of the DOSPERT and its subscales. A total of 104 samples (N = 30,109) that reported 465 coefficient alphas were analyzed. Results of meta-regression models showed that the overall coefficient alpha of the DOSPERT total scores was satisfactory, regardless of the scale and study characteristics. Coefficient alphas varied significantly across domain subscales, with values ranging from .68 for the social domain to .80 for the recreational domain. In addition, the alpha coefficients of subscales varied significantly depending on various study characteristics. Finally, we report the meta-analysis of the intercorrelations among DOSPERT subscales and reveal that intercorrelations among the subscales are heterogeneous. We discuss the theoretical implications of the present findings.
Keywords: risk attitudes, domain specific risk taking scale, meta-analysis,
reliability generalization
In everyday life, people make judgments and decisions under uncertainty in a variety of uncertain situations. Their decisions are essentially influenced by their attitudes toward risk and uncertainty, which in turn influences how they perceive and evaluate the utility of the decisions. Early work viewed risk attitudes as synonymous with risk-taking tendency, and as a domain general, stable personality trait (e.g., Bromiley & Curley, 1992; Streufert, 1986). This view was challenged by the fact that individuals’ behaviors under risk could vary greatly across situations. A person who is comfortable taking a risky financial investment may not be comfortable or willing to engage in a high-risk extreme sport activity. Weber, Blais and Betz (2002) argued that attitudes towards risk should be treated as domain-specific, since decision makers demonstrate different levels of risk-taking between different decision domains, such as gambling, finance, and personal decisions (e.g., social, health, recreation, and ethical decisions; Nicholson, Soane, Fenton-O’Creevy & Willman, 2005; Schoemaker, 1990). Essentially, individuals vary in their perceived risk and benefit in each situation, and have different subjective values on the outcomes. These characteristics can interact with the semantic content of the stimuli, or the situation in which a decision maker is placed, and results in the observed patterns of inconsistent risk-taking across different domains in life. Consequently, risk attitudes and risk-taking tendency can vary across decision domains.
Weber and colleagues proposed a domain-specific framework for conceptualizing and measuring risk attitudes, and developed the domain-specific risk-taking (DOSPERT) scale (Blais & Weber, 2006; Weber et al., 2002). Since its introduction, Weber and colleagues’ work has been cited more than 2000 times. The DOSPERT can be assessed via three aspects of risk attitudes, including risk-taking (likelihood of partaking in a particular activity), perceived risk and expected benefits of different behaviours. The original DOSPERT was developed to broadly cover risk-taking activities that young adults (i.e., undergraduates) in Western societies may experience across five content domains: ethics, finance, health, recreation, and social (Weber et al., 2002). Blais and Weber (2006) proposed a revised version of the DOSPERT with the aim of making the scale more applicable to a diverse range of demographics (culture, age, and education).
Both the original and revised versions of the DOSPERT have been used extensively across different populations (i.e., professional, student and community samples) and language groups, including a variety of European languages (e.g., French: Blais & Weber, 2006; Spanish: Horcajo, Rubio, Aguado, Hernández & Márquez, 2014; Polish: Jochemczyk, Pietrzak, Buczkowski, Stolarski & Markiewicz, 2017; German: Schmitz, Kunina-Habenicht, Hildebrandt, Oberauer & Wilhelm, 2018), and non-Euro-American samples (e.g., Chinese: Du, Li & Du, 2014; Persian: Khodarahimi & Fathi, 2016; Japanese: Krockow, Takezawa, Pulford, Colman & Kita, 2017; Hebrew: Yechiam & Telpaz, 2013).
Despite the widespread use of the DOSPERT scale, there are no studies that synthesize the evidence concerning its validity across studies. Synthesizing the evidence concerning DOSPERT’s validity is important for understanding the generalizability of the scale in terms of any potential boundaries that may exist in its application across populations and test settings (Messick, 1995; Wasserman & Bracken, 2013). According to Standards for Educational and Psychological Testing, validity entails various aspects of a scale, including content validity and reliability, and there are a number of sources of evidence for validity such as relating to other variables, internal structure and response processes (AERA, APA & NCME, 1999). The main goal of the current study is to use reliability generalization (RG) to evaluate DOSPERT’s internal consistency reliability, which is one important source of validity derived from the internal structure of the scale (Sireci & Sukin, 2013). On one hand, as the most commonly used and reported type of reliability, internal consistency reliability informs the extent to which the observed scores of the measure are capturing the true scores of the latent trait (Geisinger, 2013; Revelle & Condon, 2017). Reliability is a precondition for many other types of validity such as criterion-related validity, and of deriving any subsequent conclusions with regards to the psychological construct captured by a measure (Shrout & Lane, 2012; Vacha-Haase, Henson & Caruso, 2002). On the other hand, as a source of evidence for the internal structure of a scale, internal consistency reliability indicates the extent to which a set of test items in a measure is measuring a coherent construct in a single test setting (Geisinger, 2013). Low internal consistency may suggest a high variability of measurement errors in the items and therefore that the observed total scores may be influenced by factors other than a single, coherent latent trait.
Reliability generalization (RG) is a meta-analytic methodology to characterize test reliability across studies (Vacha-Haase, Henson & Caruso, 2002). Applied to DOSPERT, it may identify potential variation of the internal consistency reliability estimates, which would imply that DOSPERT scores are influenced by factors other than the proposed latent trait of domain-specific risk-taking. Understanding these potential factors would assist in the further refinement of the theoretical framework of risk-taking as well as of the scale itself. In addition, reliability is sample and test setting dependent (Geisinger, 2013). The level of precision in capturing latent traits can vary across samples. A synthesis of reliability is essential for understanding how the internal consistency reliability of DOSPERT may vary across studies and for determining if the measure is applicable to a particular population. An RG study would help identify the potential measurement errors of the DOSPERT and its subscales in a subpopulation or test setting, which can inform researchers regarding how their research findings and effect sizes can be generalized. Thus, a meta-analytic evaluation of the internal consistency reliability of the DOSPERT scales would be beneficial for better understanding the theoretical construct of domain-specificity, and the development and improvement of the measure of domain-specific risk-taking.
There has been an accumulation of evidence regarding the validity of the DOSPERT from its relations to other variables. For example, a recent study with 1507 participants showed that the DOPSERT has high correlations with other risk attitudes scales (Frey, Pedroni, Meta, Rieskamp & Hertwig, 2017). With regards to other conceptually related constructs, previous studies have shown that the DOSPERT and its subscales significantly converged with scales that assess sensation-seeking (Gabriel & Williamson, 2010; Roalf, Mitchell, Harbaugh & Janowsky, 2012; Weber et al., 2002), intolerance of ambiguity (Blais & Weber, 2006), intolerance of uncertainty (Koerner, Mejia & Kusec, 2017), self-reported impulsiveness (Roalf et al., 2012), and need for cognitive closure (Faraji-Rad, Melumad & Johar, 2017; Schumpe, Bélanger, Dugas, Erb & Kruglanski, 2018). These findings suggest that the DOSPERT captures the important risk attitude construct in terms of attitudes toward uncertainty, novelty and stimuli.
However, some studies reported that the correlations between the DOSPERT and conceptually relevant scales might hinge on the study samples or subscale versions. For example, Gabriel and Williamson (2010) found that both the DOSPERT risk perception and expected benefits variations of the scale were significantly correlated with the Barrett Impulsiveness Scale for men but not for women, while Roalf et al. (2012) reported that the DOSPERT risk-taking scale was only significantly correlated with impulsiveness in older populations. On the other hand, Hung and Tangpong (2010) found that general ambiguity tolerance, measured by the Multiple Stimulus Types Ambiguity Tolerance scale, was correlated with DOSPERT financial and health risk-taking, but not correlated with either social or gambling risk-taking. Faraji-Rad et al. (2017) found that the refined version of the Need for Cognitive Closure scale only correlated significantly with the ethical risk-taking subscale. These inconsistent findings can be due either to natural variations in risk-taking tendencies across behavioural domains, or due to variation in the measurement accuracy of different subscales or across different samples. In order to explore why such discrepancies exist, it is necessary to examine evidence of the validity concerning the internal structure of the DOSPERT, which includes the internal consistency reliability, factorial structure, and measurement invariance across testing samples (Sireci & Sukin, 2013).
Most studies that report the internal consistency reliability of the DOSPERT endorsed Cronbach’s α, however these reliability estimates seem to vary across different studies, depending on scale and sample characteristics. The original studies by Weber et al. (2002) and Blais and Weber (2006) demonstrate varying α values across subscales (Blais & Weber, 2006: α s = 0.75, 0.83, 0.71, 0.86, and 0.79; Weber et al., 2002: α s = 0.78, 0.84, 0.77, 0.83, and 0.70, for ethical, financial, health, recreational and social risk taking scales, respectively). Both studies found that the financial and recreational domains had generally higher α values than the health or social domains. Other papers also suggest that the α values are generally higher for the ethical, financial and recreational domains (α > .80) (e.g., Buelow & Brunell, 2014; Lorian & Grisham, 2010), than for the health and social domains (α < .70) (e.g., Du et al., 2014; Lozano et al., 2017). Such differences demonstrate that it is unclear whether or not internal consistency or measurement accuracy is comparable across different subscales/domains. Therefore, the conclusion that a construct such as cognitive closure is linked to risk-taking in one specific domain (such as ethical) but not others (e.g., Faraji-Rad et al., 2017) relies on the assumption that all domain scales measure domain-specific risk-taking in a similarly accurate manner. However, as demonstrated, internal consistency reliability may vary substantially across these different subscales of the DOSPERT, thus undermining any conclusions made about the subscales in relation to each other.
Reliability estimates also vary across different versions of the DOSPERT. Although the revised DOSPERT is a refined version of the scale, it is unclear whether the revised version has better psychometric properties than the original DOSPERT. Several studies have reported low α estimate values for the revised DOSPERT (e.g., Padilla, Doncel, Gugliotta, & Castro, 2018; Weller & Tikir, 2011). Furthermore, different studies using DOSPERT also vary in terms of the Likert scale they use, despite Weber and colleagues (2002) recommending a 5-point Likert scale and Blais and Weber (2006) recommending a 7-point scale. In the literature, studies that applied DOSPERT were varying the type of Likert scale used, from 5-point scales to 9-point scales (Reynaud & Couture, 2012). However, simulation studies have demonstrated that Cronbach’s α values may not increase with the increase in Likert points, and may in fact be optimal when the number of Likert points is 5 (Fong, Ho & Lam, 2010; Leung, 2011; Lissitz & Green, 1975).
Third, reliability estimates of the DOSPERT could also be influenced by sample characteristic variables such as target populations, age, gender and cultural background. The level of difficulty of DOSPERT items to a particular sample can influence the reliability of the DOSPERT for that sample. This sense of difficulty in DOSPERT items can relate to the level of knowledge or experience of the subject matter or activities indicated in the items. Typical university students may have limited knowledge or have never experienced the situations described in some DOSPERT items (Pietri, Fazio & Shook, 2013). For example, the financial domain contains investment options that may require specific financial knowledge. A sample of professionals working in the financial industry may find these items more meaningful than a sample of first year psychology students who do not have any experience with mutual funds or foreign currency. Thus, the sample type, student versus non-student, may also influence the reliability of the DOSPERT.
Similarly, other sample related factors such as age, gender and cultural background could also influence the reliability of the DOSPERT as a result of different levels of familiarity and knowledge of the item contents. Tax return, which is an item in the ethical domain of the DOSPERT, is not a common practice in many East Asian countries. Participants who are lacking conceptual and/or experiential knowledge of tax returns may find it difficult to respond to the item on the risk-taking tendency of tax return matters.
Sources of validity from the internal structure also include the factorial structure (Sireci & Sukin, 2013). A few studies have reported the factorial structure of the DOSPERT in terms of the five domain factors via confirmatory factor analysis (CFA). While the original domain-specific framework emphasizes on the concept that risk-taking behaviours are domain-specific phenomena rather than a single trait construct, the DOSPERT did not show a factor model with five independent factors (i.e., CFA results showed poor model fit; Highhouse, Nye, Zhang & Rada, 2017; Wu & Cheung, 2014). Different domain factors usually show a certain degree of overlap with each other, which may imply a general underlying risk tendency across domains (Zhang, Foster & Mckenna, 2018).
Although a meta-analysis to summarize the evidence regarding the structure of DOSPERT is difficult due to only a small number of studies reporting the factorial structure of DOSPERT, the internal structure may be reflected by the intercorrelations among the domains. The intercorrelations among DOSPERT subscales informs as to how different domain factors relate to each other, and the extent to which the different domains are assessing independent or related constructs. The intercorrelations among DOSPERT subscales reported in the literature vary across the paired subscales, ranging from the strong correlation between the ethical and health domain (r = .71, Byrne et al., 2016) to a negative correlation between the social and financial domain (r = −.07, Weber et al., 2002).
The primary purpose of the current study is to investigate the internal consistency reliability of the DOSPERT and its subscales across different studies. We focused on Cronbach’s α estimates, which is the most widely used and reported method of assessing reliability. We first examined the average α values of the DOSPERT total (the total scores of the DOSPERT scale) and subscales. Given the widespread use of DOSPERT in the literature, we expected that the overall α values for the DOSPERT total and subscales would be satisfactory (> .70). In addition, if different subscales had similar levels of measurement accuracy, we expected that the α values would be similar across different subscales/domains.
Second, we examined the variability of the reliability estimates, and investigated moderators that may contribute to this variability. We considered both scale related moderators and sample characteristic moderators. The scale related moderators included the DOSPERT version (original vs revised), the aspect of rating (risk-taking, risk perception and expected benefits), and the Likert scales. We expected that the revised DOSPERT, as the purportedly refined version of the scale, would have higher average α values than the original DOSPERT. In addition, we expected that the α values would be similar across the different aspects of the DOSPERT. Finally, we expected that the 5-point Likert scale would have higher reliability estimates than other Likert scale types.1
The sample characteristic variables being investigated included sample type, mean sample age, language of the sample, gender proportions and sample size. As content familiarity would influence the reliability of the DOSPERT, we expected that the α values would be generally lower for samples that were students and had lower mean age than for samples that were non-students and had older mean age. This is because non-student and more mature samples (usually community and professional samples) generally have greater knowledge and experience with the contents of many DOSPERT items than the student and younger samples. Similarly, we expected that the α values of the DOSPERT would be higher for the English-speaking than for the non-English speaking samples, as the items may be less applicable to non-English speaking populations. With regards to gender proportion, a recent study by Zhang, Foster and McKenna (2019) found that the DOSPERT may not measure risk-taking equally in terms of scalar invariance between men and women. We therefore hypothesized that gender proportion might have an impact on reliability estimates of the DOSPERT. In addition, we explored the impact of sample size on reliability and expected that a larger sample size might result in a higher α value (Henson & Hwang, 2002; Kieffer & Reese, 2002; Vacha-Haase, 1998). We also explored the mean scores of the sample on the scales to see if the level of measurement errors would vary depending on the level of the latent trait. If the α values vary across different levels of mean scores, it may imply that measurement errors vary across different levels of the latent trait itself. Finally, we explored the intercorrelations among subscales and examined the extent to which different domain factors were related to each other.
Figure 1: Flow of screening studies.
The literature was searched using Google scholar, which has the most comprehensive collection of published data and articles. The search was conducted by searching through the articles and studies that have cited the DOSPERT (original and revised DOSPERT versions). There were 2368 titles that cited the original DOSPERT and 815 titles that cited the revised DOSPERT. Within the articles, the following search query was used: “domain specific risk” + (alpha OR α ). The search returned 892 titles for the original DOSPERT and 412 titles for the revised DOSPERT. The search was concluded in April 2019.
In the current search, we focused on articles that (1) were peer reviewed publications (journal articles or full paper conference proceedings) and (2) at least had the title and abstract in English. This screening resulted in 656 titles for the original DOSPERT and 268 titles for the revised DOSPERT, of which the full texts were examined for further eligibility. We selected studies that (1) used the DOSPERT scales or subscales; (2) were empirical studies using original data sets; (3) reported exact Cronbach’s α value(s); and (4) used the original scale without modifying, adding or deleting any items. The study selection process is presented in Figure 1. Among the 924 titles, 90 publications met the inclusion criteria and were retained for the final analysis. The 90 publications reported 104 independent studies with a total of 465 α values.
The Cronbach’s αs were obtained for the total scale as well as for the subscales when reported in the studies. For the 465 α values, the following scale related variables were extracted and coded: (a) scale rating aspect (risk-taking, risk perception, or expected benefits); (b) domain/subscale; (c) DOSPERT version (original or revised); and (d) number of Likert scale points. In addition, the following sample feature variables were extracted and coded: (e) sample type (e.g., student, community or specific profession); (f) sample size; (g) proportion of males (% male) in the sample; (h) language version (English version or non-English version); (i) the mean (or median)2 age of participants; and (j) sample mean scale average scores.
For studies of which details were not reported, attempt was made by email contact with the authors to obtain the missing values such as mean age, language version, total scale α value and proportion of male participants. Emails were sent to the corresponding authors for the request of details. If the authors did not respond in 3 weeks, a follow up email was sent to the corresponding author and the coauthors of the article. Missing values in the present study were excluded pairwise in the data analysis.
The first author developed the coding manual. The second author (first coder) and a trained research assistant (second coder) completed the extraction and coding of the included studies. The first author examined the coding results, and rechecked all studies for any inconsistency between the two coders to resolve potential coding errors. The final intercoder agreement was satisfactory, with weighted Cohen’s Kappa coefficients all above 0.95 for all categorical moderators. The final disagreed entries were resolved by discussion among authors and coders.
Because the α value is a doubly bounded variable and does not follow a normal distribution, the raw α values are not appropriate for being directly modeled by meta regressions that are based on normal distribution. Therefore, Bonett (2002)’s formula, T=−ln(1−α), was used to transform the α values such that the transformed values were monotonically increasing with the raw α values. The amount of heterogeneity was estimated via Restricted Maximum Likelihood Estimators due to its reasonable properties such as low bias and being suitable for both small and large study sizes across various data conditions (Langan et al., 2019). Sampling variance (for testing the significance of heterogeneity) was estimated using the scale length (i.e., number of items in a scale) and sample size: v=2m/((m−1)(n−2)), where v is the sampling variance, m is the scale length, and n is the sample size. The Q statistic (Cochran, 1954) was used to examine the significance of the heterogeneity between studies. The Q statistic is a weighted sum of the squared deviations (from the overall effect) of individual studies’ effects with the weighting function being the inverse sampling variance Q = ∑i=1k (yi − µ/vi)2, where yi is the individual study’s effect, µ is the overall effect across studies and k is the number of studies. As the Q statistic is influenced by the number of studies included in the meta-analysis, I2 index and H2 statistic (Higgins & Thompson, 2002) were also used to quantify the heterogeneity. I2 index, I2 = Q−k+1/Q, represents the percentage of the observed total between-study variability being accounted for by the true between-subject variability rather than by the sampling error (Huedo-Medine, Sánchez-Meca, Marín-Martínez & Botella, 2006). The value ranges from 0 percent to 100 percent, with a higher value indicating less influence of sampling error in estimating the heterogeneity. Finally, H2 index H2=Q/k−1 represents the ratio of the observed total between-study variability to the amount of sampling variance, with greater value indicating greater heterogeneity.
We first used random-effects models to report overall weighted α values for different scales, and for different subgroups (e.g., different sample types). The random-effect model has a formulation, y=µ+ui+ei, where ui ∼ Norm(0,τ2) is deviation of the individual study effect and the overall effect, and is the ei ∼ Norm(0,σ2) sampling error. We then applied mixed effects models to evaluate if each moderator variable significantly moderated the α values. The mixed-effects model has the formulation, y=µ+∑βjxij+ui+ei, where ∑βjxij is the linear combination of jth moderator xij and its regression coefficient βj. Knapp and Hartung’s adjustment was applied to estimate standard errors and to construct the omnibus test for the significance of a mix-effects model (Knapp & Hartung, 2003; Viechtbauer, López-López, Sánchez-Meca & Marín-Martínez, 2015). We reported the model coefficient, F statistic for testing significance, and R2 (amount of heterogeneity accounted for) for each moderator variable.
Publication bias was assessed using funnel plot and Begg and Mazumdar’s rank test (Begg & Mazumdar, 1994). Begg and Mazumdar’s rank test is based on Kendall’s rank correlation between the standardized transformed α values and the sampling variance. A significant test result indicates that the selection of the publication is dependent on the observed α values and therefore indicates a publication bias. Potential outlier cases were assessed using six outlier detection statistics recommended by Viechtbauer and Cheung (2010), including standardized residuals, Cooke’s distance, DFFITS values, DFbetas, leave-one-out test for amount of residual heterogeneity and for statistics for the test of heterogeneity, and covariate ratio under the random effect model framework. A case was identified as an outlier if it was found to be influential by all six detection methods.
Finally, to examine the intercorrelations among subscales, Fisher’s transformation was used to transform correlation coefficients to normalized z values (Field, 2001). Sampling variance was estimated based on the sample size. We carried out random effects models to estimate the mean correlations and their confidence intervals of the 10 paired correlations among the five subscales. All analyses were carried out in R program 3.6.2 for Windows using the ‘metafor’ package version 2.1–0 (Viechtbauer, 2010) and the ‘psych’ package (Revelle, 2017).
Table 1: Correlations of characteristic variables of the included studies
Version Likert Sample type Language Age Sample size Male% Version 97 95 94 89 95 90 Likert .99** 99 104 93 91 99 Sample type .28 .10 101 88 85 97 Language -.31 -.08 -.44* 97 95 94 Age .04 -.01 .92** -.18 92 93 Sample size .2 .16 .27* -.02 .04 101 Male% .16 .12 .28* -.19 .19 .06 Note. The lower diagonal are correlation coefficients, the upper diagonal are number of studies included in the analysis. For Version, the base group is the original DOSPERT and the comparison group is the revised DOSPERT. For sample type the base group is student and the comparison group is non-student. For language, the base group is English and the comparison group is non-English. ** p < .001; * p < .05.
The 90 publications reported 104 independent studies/samples with a total of 30,109 participants. Sample sizes ranged from 30 to 2157 with a median of 205. Forty-eight studies used student samples, 52 used non-student samples (including 43 community samples, four professional samples3, two psychiatric patient samples and three forensic samples), and four had samples that were a mixture of students and community participants. In the follow data analysis, the community samples and professional samples were coded as non-student (normal population) samples to be compared with the 48 student samples in later sample type analysis. We did not include the patient and forensic samples due to their small numbers.
The mean proportion of males was 46% (k = 101 studies reported the gender composition). The sample size weighted mean age was 27.96 (k = 94 studies reported mean or median age of the participants). Ninety-nine studies reported the language version the DOSPERT was employed in, with 72 of these studies employing the English version of the DOSPERT. Among the samples that used non-English versions, the top three languages were German (k = 7), Chinese (k = 5) and Spanish (k = 4).
We also explored the dependence among the study characteristic variables, which can shed light on findings about the shared effects or moderation effects of some variables. We used polychoric correlations for paired binary variables, biserial correlations for paired binary and continuous variables, and Spearman correlation for paired continuous variables. Table 1 shows the correlations among the variables. For the scale relevant variables, we found a strong correlation between measurement version and the Likert point (r = .99, p < .001), as most studies using the revised DOSPERT endorsed the recommended 7-point scale (71 out of 77 studies) while all studies using the original DOSPERT endorsed the 5-point scale (n = 21).
With regards to the dependence among the sample characteristic variables, the sample type was strongly associated with the mean/median age of the sample (r = .92, p < .001), where the non-student samples were predominantly older than the student samples. In addition, non-student samples had significantly higher mean sample size (r = .27, p < .05), and proportion of males than the student samples (r = .28, p < .05).
For the included 465 α values, 324 were based on ratings of risk-taking tendency, 47 were on ratings of expected benefits and 94 were on ratings of risk perception. Ninety-one α values were based on the original DOSPERT and 374 were based on the revised DOSPERT. The number of α values for the ethical, financial, health, recreational, social and DOSPERT total were, 79, 65, 85, 81, 86 and 69, respectively. The frequency distribution of the α values for the different subscales/total scales were not significantly different across the three rating aspects, χ 2 = 2.75, df = 10, p = .987, nor between the two DOSPERT versions, χ 2 =5.50, df = 5, p = .358.
A total of 444 α values had information on the number of Likert scale points, and 341 values were based on 7-point Likert scale, of which all were using the revised DOSPERT. On the other hand, 103 values were based on 5-point scale, of which most (n = 82) were using the original DOSPERT.
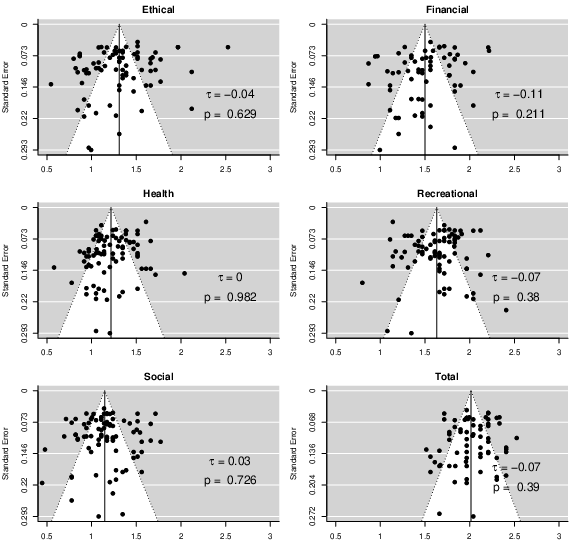
Figure 2: Funnel plot of the transformed α coefficients for DOSPERT total and subscales.
Among the variables, three had more than 15 missing values for all subscales and more than 5 per subscale: Likert points (total missing n = 21), mean/median age (total missing n = 49), and total scale score average (total missing n = 108). Single factor meta-regression was used to assess the impact of these missing values on the α values. There was no significant difference between the estimated α values for all subscales between the studies with missing information and studies without missing information for all three types of missing information.
Figure 2 displays the funnel plots for the DOSPERT total and subscales. The rank test for testing the symmetricity of the plots suggested that no asymmetry was detected for DOSPERT total and subdomains. There is no evidence of publication bias in terms of the reported α values.
Visually inspecting the funnel plots in Figure 2 revealed several potentially influential cases (e.g., the far right side in the ethical domain plot). We examined the potentially influential cases for DOSPERT total and subscales via six outlier detection methods. Using the data including all rating aspects, one case was identified as highly influential (being influential for all six detection methods): the risk perception rating of the ethical domain (α = .92) in Weller, Ceschi, and Randolph (2015). The influential case detection was also carried out separately for the risk-taking and risk perception aspects.4 A further three cases were identified as highly influential in the risk perception aspect: the social (α = .78) and recreational (α = .88) domains in Weller et al. (2015), and the social domain (α = .83) in Blais and Weber (2006).
To test the sensitivity and robustness of the meta-analysis results, all moderation analyses were performed both including and excluding the influential cases. Results were reported with the cases if inclusion of the cases did not influence the significance of the moderation. Results were reported without the cases if the inclusion of the cases significantly impacted the conclusion of the moderation (i.e., from a statistically significant result to non-significant result, or vice versa).
Table 2 shows the estimated α values, heterogeneity and Q statistics for the total and subscales of DOSPERT. The α value for the DOSPERT total scale was .87 (95% CI = [.86, .87]). The α values for subscales ranged from .68 (social domain; 95% CI = [.66, .70]) to .80 (recreational domain; 95% CI = [.79, .82]). Q statistics were significant for all scales, indicating significant heterogeneity among the α values across studies. Means and confidence intervals (CIs) of weighted αs for DOSPERT total and subscales across moderator variables are presented in Figure 3.
Table 2: Mean weighted αs for DOSPERT and subscales.
Scale k Mean 95% CI τ 2 Q p I2 H2 Total 69 .87 .86–.87 .04 384.89 <.001 83.72 6.14 Ethical 79 .73 .71–.75 .11 1483.20 <.001 94.05 16.80 Financial 65 .78 .76–.80 .09 818.72 <.001 91.72 12.08 Health 85 .71 .69–.72 .04 538.89 <.001 84.73 6.55 Recreational 81 .80 .79–.82 .06 869.75 <.001 89.92 9.92 Social 86 .68 .66–.70 .06 681.52 <.001 88.94 9.04
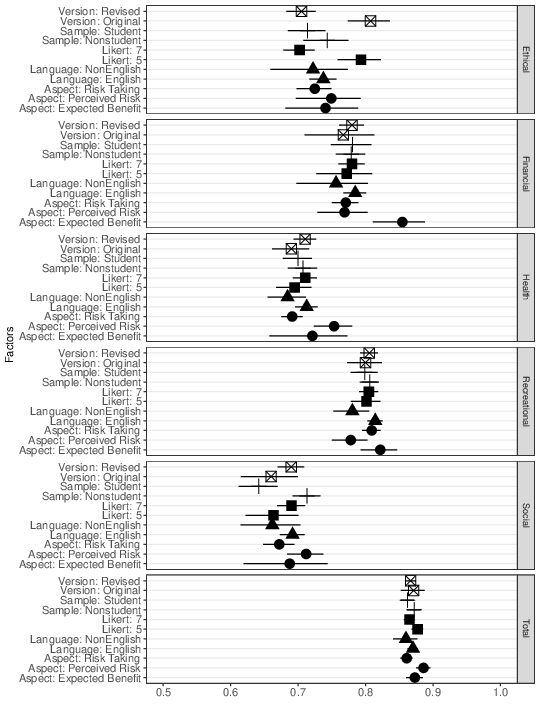
Figure 3: Means and CIs of weighted αs for DOSPERT total and subscales across moderator variables. Shapes represent different moderator variables: Blank squares = scale aspect; vertical bars = sample type; black squares = measure version; triangles = likert point; circles = language.
Table 3 shows the estimated α values for the total and subscales of DOSPERT based on scale aspect. The α values for DOSPERT total were .86, .89 and .87, for risk-taking, risk perception and expected benefits, respectively. Among the subscales, the risk-taking scale of the social domain had the lowest α value (α = .67), while the expected benefits scale of the financial domain had the highest value (α = .85).
Table 3 also shows the estimated α values for the two versions of the DOSPERT. The α values were similar (i.e., difference ≤ 0.01) between the two versions for the financial, recreational and total DOSPERT scales. However, the α values for the ethical domain were substantially lower in the revised DOSPERT (α = .71) compared to the original DOSPERT (α = .81).
With regards to the estimated α values for different Likert scales, the α values were similar for the financial, recreational and total scale between the 5-point and 7-point versions, while α values for the ethical and social domains were lower for the 7-point scale than for the 5-point scale. This is partially due to the fact that Likert scale use depended on the DOSPERT version used.
Table 3: Mean αs for different subscales across scale moderator levels and moderation test results.
Subscale Variable rating aspect k Mean 95% CI F R2 Ethical Expected benefit 9 .74 .68–.79 F(2, 76) = 0.49 .000 Risk perception 16 .75 .70–.79 p = .615 Risk taking 54 .72 .70–.75 Financial Expected benefit 5 .85 .81–.89 F(2, 62) = 6.02 .161 Risk perception 14 .77 .73–.80 p = .004 Risk taking 46 .77 .75–.79 Health Expected benefit 8 .72 .66–.77 F(2, 82) = 6.81 .139 Risk perception 15 .75 .72–.78 p = .002 Risk taking 62 .69 .68–.71 Recreational Expected benefit 9 .82 .79–.85 F(2, 78) = 2.72 .058 Risk perception 17 .78 .75–.80 p =.072 Risk taking 55 .81 .79–.82 Social Expected benefit 11 .69 .62–.74 F(2, 83) = 1.74 .012 Risk perception 18 .71 .68–.74 p = .182 Risk taking 57 .67 .65–.69 Total Expected benefit 5 .87 .86–.88 F(2, 66) = 4.57 .133 Risk perception 14 .89 .87–.90 p = .014 Risk taking 50 .86 .85–.87 Ethical Revised version 61 .71 .68–.73 F(1, 77) = 27.88 .277 Original version 18 .81 .77–.84 p < .001 Financial Revised 59 .78 .76–.80 F(1, 63) = 0.28 .000 Original 6 .77 .71–.81 p = .599 Health Revised 67 .71 .69–.73 F(1, 83) = 1.29 .005 Original 18 .69 .66–.72 p = .259 Recreational Revised 65 .81 .79–.82 F(1, 79) = 0.14 .000 Original 16 .80 .77–.82 p = .714 Social Revised 67 .69 .67–.71 F(1, 84) = 1.70 .002 Original 19 .66 .62–.70 p = .195 Total Revised 55 .87 .86–.87 F(1, 67) = 0.23 .000 Original 14 .87 .85–.89 p = .636 Ethical 5 point scale 21 .79 .76–.82 F(1, 74) = 20.93 .226 7 point scale 55 .70 .68–.72 p < .001 Financial 5 8 .77 .73–.81 F(1, 60) = 0.18 .000 7 54 .78 .76–.80 p = .676 Health 5 21 .69 .67–.72 F(1, 80) = 0.85 .000 7 61 .71 .69–.73 p = .360 Recreational 5 19 .80 .78–.82 F(1, 76) = 0.06 .000 7 59 .80 .79–.82 p = .801 Social 5 22 .66 .62–.70 F(1, 81) = 1.47 .000 7 61 .69 .67–.71 p = .23 Total 5 12 .88 .87–.89 F(1, 61) = 2.42 .014 7 51 .87 .86–.87 p = .125 Note. Significant results are in bold. * Signifies that results are based on when outliers were excluded.
Table 4 shows the estimated α values for the total and subscales of DOSPERT for student and non-student samples. The DOSPERT total α values for student and non-student samples were .86 and .87, respectively. The α values for different subscales ranged from .71 (social and health domains) to .81 (recreational domain) for the nonstudent samples. The α values were slightly lower for the student samples, ranging from .64 (social domain) to .80 (recreational domain).
Table 4 also shows the estimated α values for the total and subscales of DOSPERT for English and non-English speaking samples. The α values for DOSPERT total were .87 and .86 for the English and non-English speaking samples, respectively. The α values for different subscales ranged from .69 (social domain) to .81 (recreational domain) for the English-speaking samples. The α values were slightly lower for the non-English speaking samples, ranging from .66 (social domain) to .78 (recreational domain).
Table 4: Mean α values for different subscales across sample moderator levels and moderation test results.
Subscale Variable k Mean 95%CI F R2 Sample type Ethical Student 35 .71 .68–.74 F(1, 70) = 1.78 .013 Nonstudent 37 .74 .71–.77 p = .186 Financial Student 27 .78 .75–.81 F(1, 56) = 0.02, .000 Nonstudent 31 .78 .76–.80 p = .880 Health Student 35 .70 .68–.72 F(1, 75) = 0.26 .000 Nonstudent 42 .71 .68–.73 p = .609 Recreational Student 32 .80 .78–.82 F(1, 71) = 0.36, .000 Nonstudent 41 .81 .79–.82 p = .551 Social Student 35 .64 .61–.67 F(1, 76) = 16.13 .203 Nonstudent 43 .71 .69–.73 p < .001 Total Student 38 .86 .85–.87 F(1, 64) = 1.97 .000 Nonstudent 28 .87 .86–.88 p = .166 Language Ethical English 58 .74 .72–.76 F(1, 76) = 0.28 .000 Non English 20 .72 .66–.77 p = .597 Financial English 50 .78 .77–.80 F(1, 63) = 1.56 .008 Non English 15 .76 .70–.80 p = .216 Health English 65 .71 .70–.73 F(1, 83) = 2.64 .021 Non English 20 .68 .65–.71 p = .108 Recreational English 55 .81 .80–.83 F(1, 79) = 6.93, .073 Non English 26 .78 .75–.81 p = .010 Social English 62 .69 .67–.71 F(1, 84) = 1.98 .015 Non English 24 .66 .61–.70 p = .163 Total English 47 .87 .86–.88 F(1, 62) = 1.33 .007 Non English 17 .86 .84–.88 p = .254 Note. Significant results are in bold. Sample type tests were based on the comparison between student and non-student sample (community and professional) only.
Single factor mix-effects models were carried out to examine if the α values differed significantly across the five subscales of the DOSPERT. Results suggested that the α values differed significantly across subscales (k = 394, F(4, 391) = 38.13 , p < .001, R2 = .31). Using the ethical domain as the base comparison group, the recreational (b = 0.31, p < .001) and financial (b = 0.19, p < .001) domains had significantly higher α values than the ethical domain, while the social domain (b = −0.17, p < .001) had significantly lower α values than the ethical domain.
Further analyses were carried out for the risk-taking, risk perception and expected benefits aspects separately. Results suggest similar findings for all ratings aspects. That is, the α values differed significantly across subscales for all rating aspects (F(4, 269) = 34.86, p < .001, R2 = .384; F(4, 71) = 4.26, p = .004, R2 = .221; F(4, 37) = 8.61, p < .001 , R2 = 0.445 for risk-taking, risk perception and expected benefits aspects, respectively). The α values were similar between social, ethical and health domains, but all three were lower than the financial and recreational domains.
Single factor mix effects meta regression analyses were carried out to examine how the α values of DOSPERT scales were influenced by the scale aspect, version of DOSPERT and the number of Likert rating points for each subscale. Table 3 shows the model results. The α values were significantly different across the rating aspect for the financial domain (k = 65, F = 6.02, p = .004), health domain (k = 85, F = 6.81, p =.002) and DOSPERT total (k = 69, F = 4.57, p = .014), accounting for 16.1% and 13.9% and 13.3% of the heterogeneity in the data, respectively. As shown in Table 3, the financial domain had higher α estimates for expected benefits (α = .85) than both risk perception and risk-taking (α = .77). By contrast, the health domain had higher α estimates for risk perception (α = .75) than for risk-taking (α = .69) or expected benefits (α = .72). DOSPERT total had higher α estimates for risk perception (α = .89) than for risk-taking (α = .86).
The DOSPERT version also had significant moderation effects on the α values for the ethical subscale (k = 79, F = 27.88, p < .001), accounting for 27.7% of heterogeneity in the data. The α values for the ethical subscales were significantly lower for the revised DOSPERT than they were for the original DOSPERT. The scale version effect was also partially reflected in the effect of the Likert point, where the Likert point also accounted for a significant amount of heterogeneity in the ethical domain (k = 76, F = 20.93, p <. 001).
Table 4 also shows the single factor meta-analysis results for the various categorical sample characteristic factors and Table 5 shows results for the continuous sample characteristic variables. α values were significantly moderated by sample type for the social domain (k = 78, F = 16.13, p <. 001), accounting for 20.3% of heterogeneity. The student samples generally had lower α estimates on the social domain than the non-student samples. A related finding was reflected in the moderation effect of the mean/median age of the samples (see Table 5), where the higher mean/median age of the sample is associated with higher α values for the social domain (k = 77, F = 6.52, p = .013, R2 = 0.100).
The language of the samples had a significant moderation effect on the alpha values of the recreational domain (k = 81, F = 6.93, p =.01, R2 = .073). English speaking samples generally had higher α estimates on the recreational domain than the non-English speaking samples. For the continuous sample characteristics, the proportion of males in the sample had a significant and positive association with α estimates for the DOSPERT total and health domain, accounting for 13.3% and 7.2% amount of heterogeneity, respectively. Finally, sample size had a slightly smaller effect on the alpha values for the financial domain, accounting for 5.2% of the heterogeneity. Larger sample size was associated with higher α values for these domains.
Table 5: Results of the meta-regression analysis by the continuous moderator variables.
Moderator variable kj bj F p R2 Ethical Mean Age 70 .003 0.30 .588 .000 Sample size* 78 .02 2.26 .137 .017 Percentage of males 78 .278 1.42 .238 .006 Financial Mean Age 57 −.006 1.57 .215 .016 Sample size 65 .028 4.23 .044 .052 Percentage of males 64 −.079 0.11 .744 .000 Health Mean Age 76 .000 0.00 .969 .000 Sample size 85 .014 3.40 .069 .004 Percentage of males 84 .327 5.53 .021 .072 Recreational Mean Age 72 .000 0.00 .956 .000 Sample size 81 −.001 0.01 .939 .000 Percentage of males 80 .127 0.49 .485 .000 Social Mean Age 77 .008 6.52 .013 .100 Sample size 86 .005 0.24 .625 .000 Percentage of males 85 .307 2.96 .089 .043 Total Mean Age 64 .003 0.81 .371 .000 Sample size 69 .008 0.62 .434 .000 Percentage of males 66 .616 7.92 .007 .133 Note. Significant results are bold. The degrees of freedom for each F statistic is 1 and k-1. * signifies that results are based on when outliers were excluded.
Additional analyses were carried out for the risk-taking aspect to explore the effect of scale and sample characteristics, as well as the mean scale average scores. We did not analyze the results of expected benefits due to many of the factors for these results being based on less than 15 studies and therefore may not be stable (Guolo & Varin, 2017). Results are shown in Table 6. For the risk-taking aspect, most results were similar to the results in the previous section. Additionally, however, we found language had a significant moderation effect on the social domain (k = 57, b = −0.24; F = 8.6, p = .005). The α values for English speaking samples were significantly higher than the non-English speaking samples for these two domains. Finally, a small but significant effect was found for Likert point on the DOSPERT total (k = 44, b = −0.08; F = 4.85, p = .033). The 7-point scale had significantly lower α estimates than the 5-point scale.
Table 6: Significant moderators for risk taking and risk perception aspects.
Moderator variable kj bj F p R2 Risk Taking Ethical Measure version 54 −0.19 11.65 .001 .178 Likert point 51 −0.16 9.79 .003 .158 Health Sample size 62 0.02 6.35 .014 .137 Percentage of males 61 0.33 5.64 .021 .123 Recreational Language 55 −0.23 7.59 .008 .134 Social Sample Type 52 −0.09 6.78 .012 .131 Language 57 −0.24 8.6 .005 .181 Total Likert point 44 −0.08 4.85 .033 .067 Percentage of males 47 0.71 8.77 .005 .208 Risk Perception Ethical Measure version 16 −.26 8.19 .013 .326 Likert point 16 −.26 8.19 .013 .326 Note. The degrees of freedom for each F statistic is 1 and k-1.
A total of 28 publications reported correlations among subscales. Table 7 displays the results of the random effect models, including the estimated mean and confidence intervals of these correlations across all rating aspects. The mean intercorrelations among DOSPERT domains ranged from 0.18 to 0.47. The ethical and health subscales had the highest correlation (r = 0.47), followed by the recreational and health subscales (r = 0.38). The social domain had relatively low correlations with the other four domains (rs<0.3, average r =0.21), while the other four domains had moderate correlations with each other on average.
Table 7: Mean and confidence intervals of correlations between subscales.
Ethical Financial Health Recreational Social Note. The lower left diagonal shows the mean and confidence intervals of the correlation estimates. The upper right diagonal shows the number of correlations included in the meta analysis.
The present study investigated the reliability of DOSPERT across different samples and test settings. There was substantial heterogeneity in the reported α values of the DOSPERT across different studies, indicating the internal consistency reliability of DOSPERT can depend on the test setting and target populations. The internal consistency of DOSPERT total scores was generally satisfactory (α s > .80), regardless of factors related to the scale and sample. However, the internal consistency of different domains was less satisfactory, with the lowest average α value being .68 (social domain), and varying depending on different factors.
We hypothesized that internal consistency measured by Cronbach’s α would be similar across different domains if different domains have similar measurement accuracy. The results showed that the average α values were substantially different among different domains. The average alpha values were significantly higher for the financial and recreational domains (α ≥ .78) than for the health and social domains (α ≤ .71). The estimated social domain had the lowest weighted α value (α = .68), especially when the scale was rated on the risk-taking tendency aspect (α = .67). On the other hand, the recreational domain had highest weighted α values regardless of the scale version and rating aspects. The pattern of the α values seemed to be comparable to those reported in Weber et al. (2002) and Blais and Weber (2006). Such patterns were also commonly observed in studies that used all five subscales of the DOSPERT (e.g., Egelmen & Peer, 2015; Highhouse et al., 2017; Jochemczyk et al., 2017; Johnson, Wilke & Weber, 2005). However, authors of these studies do not discuss the issue of heterogeneous internal consistency reliability across domains.
It may be that the health and social domains contain items that are more ambiguous and complex in terms of the potential outcomes and their likelihoods. Responses on the behavioral tendency on those items may be influenced by a variety of factors, including factors from other domains. For example, the subject matter of three items in the health domain, “Illegal drugs”, “Not wearing seatbelt”, and “Not wearing helmet” can be related to both legal and ethical issues rather than pure health and safety issues. A person who endorses this item could either be risk-taking in the ethical domain or risk-taking in the health domain. This is also reflected in the strong mean intercorrelation between the ethical and health subscales. On the other hand, items in the social domain such as “Taking a job that you enjoy over one that is prestigious but less enjoyable” and “Speaking your mind about an unpopular issue in a meeting at work” can be relevant to risk regarding career and future financial security rather than simple social risk. This means that not all items in the health or social domains are exclusively influenced by the single latent traits “health risk-taking”/“social risk-taking”. Therefore, the factors other than “health risk-taking” or “social risk-taking” that influence item endorsement vary across items within a domain, which results in greater measurement noise for these two domains. As a consequence, the internal consistency, which requires unidimensionality of a scale, is diminished for these two domain subscales. By contrast, items in the recreational domain were more uniform and all related to extreme or outdoor activities. Generally, the benefits were about excitement and sensation seeking (many items overlapping with items on the Sensation Seeking Scale), and risks were about personal health and safety issues. Similarly, items in the financial domain all clearly have financial outcomes. Thus, heterogeneity in item complexity could be resulting in the observed variation in the internal consistency measured by α values across different DOSPERT domains.
The single factor moderator analyses for examining the scale factors revealed that the moderation effects of different scale characteristics depended on the domains/subscales. α values were found to be significantly variant across rating aspects for DOSPERT total, health and financial domains, suggesting the expected benefit, perceived risk, and behavioral engagement may not be equally coherent in terms of their underlying latent factors. More specifically, for these three (DOSPERT total, health and financial domains), the α values of the risk-taking aspect were the lowest among the three aspects, which implies that the behavioral tendency in general could be influenced by measurement noise more than risk perception. For example, while participants may all perceive health related risk in the health domain items; the behavioral engagement can be influenced by factors other than a single health risk-taking tendency trait. For example, the item on “Wearing a seatbelt” is more constrained by legal requirement, whereas “Walking home late at night in an unsafe area of town” is largely constrained by if other options are available or not.
The findings with regards to DOSPERT versions did not support our hypothesis. The revised DOSPERT did not result in higher α values for most domains in comparison to the original DOSPERT. In addition, the revised DOSPERT of the ethical subscale had significantly lower α values than the original DOSPERT. It should be noted that the items in the ethical domain were more substantially modified in the revised DOSPERT than other domains. More specifically, the original DOSPERT had items that predominantly relate to law enforced behaviors (e.g., forging a signature, shoplifting, etc). By contrast, items in the revised DOSPERT had a mixture of law enforced behaviors and non-law enforced behaviors that are constrained by social norms on morality (e.g., revealing a friend’s secret). Thus, items in the revised DOSPERT had more non-legal influence than the original DOSPERT, and could be strongly influenced by individuals’ perception on the morality and social norms of a behavior. In addition, half of the items in the revised DOSPERT, “revealing a friend’s secret”, “leaving your young children alone”, and “having an affair with a married man/woman”, had more social risk involved than the other three behaviors that entailed legal considerations. This mixture of the source influence resulted in a significantly lower internal consistency of the ethical domain for the revised DOSPERT as compared to the original DOSPERT. In addition, the scale length of the revised DOSPERT is 2 items shorter than the original DOSPERT, which means that the increasing heterogeneity in item content had a greater deteriorating effect on Cronbach’s α values (Komorita & Graham, 1965).
The moderation effects of different sample characteristics also depended on the domains/subscales. First, in terms of the target populations, the sample type and mean sample age had significant moderation effects on the alpha values of the social domain. The α values were generally lower for the student samples than for the non-student samples. This finding could be due to the fact that several items in the social domain were addressing work related issues, such as career change and interaction with workmates/managers. Students generally have less experience with the work environment and may not be able to provide accurate ratings on those items. This results in noisier rating patterns among student samples than in non-student samples. This also implies that the degree of familiarity with the item contents can substantially influence measurement accuracy.
Next, language was found to have significant moderation effects on the alpha estimates of the recreational domain and the risk-taking aspect of the social domain, of which the α estimates were higher for the English speaking than for the non-English speaking samples. In addition to the possible translation issues, items in both the recreational and social domains can be related to social and cultural contexts. There is an extensive literature in tourism markets that demonstrates substantial cultural differences in the perceived risk of recreational and sensation seeking activities (Lepp & Gibson, 2008; Pizam et al., 2004). Most of the activities in the recreational domain are more popular among participants in Euro-American countries than participants in Asian countries. The α estimates were notably low for the Chinese samples (e.g., α = .67 in Cheung, Wu & Tao, 2016; α = .55 in Wichary, Pachur & Li, 2015), as activities in the recreational domain are less familiar and available to participants in Asian countries. For the risk-taking aspect of the social domain, the finding is not surprising as social behaviors are highly dependent on social and cultural context. Item endorsement can be highly influenced by participants’ perceived social norms other than individual risk-taking tendency.
In terms of gender proportion, samples with lower proportions of males had lower α estimates for the DOSPERT total and health domains, suggesting that the level of measurement error was higher among females than among males. One possible explanation is that risk-taking attitudes among females are more likely to be confined by social and environmental factors, such as appropriate gender role behaviors (Byrnes, Miller & Schafer, 1999). Thus, the tendency to conform to social norms may create additional measurement errors among females. The accuracy of items may also be influenced by gender differences in their familiarity with the item (e.g., females may have less experience “Riding a motorcycle” than males do).
The results regarding the intercorrelations among the domains suggests all domain factors relate to each other to some degree. Despite this, the moderate correlations among the domains indicates that different domains are still independently assessing domain specific risk-taking tendency. However, we also found that the overlaps among domains were not homogenous, ranging from a strong overlap between the health and ethical domains, to a relatively weak overlap between the social and financial domains. As discussed earlier, the item ambiguity in the health domain may contribute to the high correlation between the health and ethical domains. The overlaps among other paired domains may also be contributed to by the common measurement errors (i.e., survey questions with single item direction) or item domain contamination. Thus, whether the overlaps among the domains suggest a common underlying construct – a general risk-taking tendency – requires more work to be done on reducing item ambiguity to better differentiate the five domains.
The most important finding from this study is the heterogeneity of the internal consistency reliability across domain subscales. One major issue for such heterogeneity is that the five “domains” are never clearly defined in both the original and revised DOSPERT. It is unclear to what extent a risk can be called a social or health risk, and to what extent behavior will exclusively entail a social or health risk. Unclear definitions result in ambiguity in item selection and scale construction. The issue of unclear domain definitions is further reflected by the varying internal consistency across samples as a function of sample characteristics. The face validity of items in each domain in the original Weber et al. (2002) study seem more based on researchers’ perspectives rather than on empirical evidence (that is, what lay people actually perceive as “domain specific risks”). While there is perhaps a high consensus on the nature of risk in the financial domain (e.g., potential monetary/financial loss), consensus may be more difficult to achieve regarding whether a behaviour can be called a social or health risk.
In addition, without clarifying the measurement issue in terms of scale construction, the observed heterogeneity may also challenge the concept of “domain specificity” in risk-taking. If some domains, such as the social and health domains, are naturally more ambiguous, complex, and can be more influenced by factors other than the risk attitude toward that specific domain, “domain-specific risk taking”, at least for these domains, may be a product of the way people are perceiving and integrating multiple cues in those situations rather than a reflection of a single “domain-specific” risk attitude.
While completely eliminating measurement error is not possible at the current stage, researchers should be aware of and perhaps utilize the reliability information. With regards to the variability of the reliability estimates across domains, researchers need to be cautious when drawing conclusions by comparing risk-taking across domains. The direct comparison of two domains (i.e., non-weighted or non-corrected scores) is based on the assumption that the measurement errors are homogenous across individuals and domains. When comparing risk taking tendencies measured by two domain subscales in terms of their correlates with a criterion or exploratory variable, researchers should be aware that the observed correlation coefficients could be attenuated differently if the two domain subscales have different levels of reliability. According to the attenuation effect in the classical test theory (Lord & Novick, 1968), a reliability at 0.8 (e.g., the recreational domain subscale) could result in 1−√0.8 ≈ 10% attenuation of the observed correlation, while a reliability at 0.68 (e.g., the recreational domain subscale) could result in 1−√0.68 ≈ 17% attenuation (Schmidt & Hunter, 1999). Researchers should consider correcting the distorted correlations (e.g., use structural equation modelling) or factor in the different reliability estimates when attempting to compare different domains.
Next, the varying α values may imply varying dimensionality across domains and subsets of items within a domain (e.g., social) can be the result of both the dominant factor (e.g., social risk taking) and secondary factors that are independent of the dominant factor. Researchers may consider using factor analysis to extract the dominant factor (the shared variance among all items in that domain) for each domain to reduce the influence of other factors as an alternative to the raw scores.
Furthermore, the internal consistency of some domain scales was higher for samples that were comprised of the general community, English speaking samples, higher proportion of males, and larger sample sizes. This implies that the measurement accuracy of some specific domains may depend on the population and test setting. Thus, researchers should be careful when comparing the raw scores of specific domains across groups. Researchers are recommended to carry out multi-group measurement invariance before making such comparisons across groups.
As we discussed earlier, factors that can influence the reliability of the DOSPERT include familiarity of the item contents and unidimensionality of the items in terms of domains that are involved. Without modifying the DOSPERT, future studies could consider measuring item familiarity as a covariate to control for the influence of familiarity on score reliability. Future development of the DOSPERT as a scale may consider revising some items for better domain clarification. The DOSPERT may be improved by having clearer wording to restrict the domains that may be involved in a single item and thereby reduce domain contamination.
In addition, we found the intercorrelations among domain scales were not homogeneous across all pairs of domains. The health domain was found to be highly correlated with the ethical domain, suggesting that some more work needs to be done in differentiating the two domains. The shared variance of the two domains may restrict the conclusions that can be drawn from either “health” or “ethical” risk attitudes. Researchers who use the current version of DOSPERT can consider using the regression method of extracting the shared and independent components of the two scales, and examine how these shared and independent components of the two scales are associated with the outcome variables of interest.
Some limitations should be noted. First, the results regarding the influence of language may be limited as a result of the smaller number of studies among non-English samples than English samples. In addition, the use of English versus non-English languages of the scale as an approximation of cultural context is restricted. Some studies used the English scale in non-English speaking samples (e.g., Macau students in Cheung, Teo & Hue, 2015 and Hong Kong students in Li, Hamamura & Adams 2016), while the non-English language samples had greater heterogeneity with a mixture of Asian and European languages. We encourage more research to be carried out among non-English speaking samples, using the native language for the target sample. Second, we only addressed the internal consistency reliability measured by Cronbach’s α. Future research may consider other forms of reliability and sources of validity, such as the test-retest reliability of the DOSPERT. Some previous studies (e.g., Frey et al., 2017) have demonstrated high test-retest reliability (r > 0.6) in a European population. Researchers are encouraged to explore how such test-retest reliability can be replicated in other populations.
The use of Cronbach’s α as a measure of internal consistency of DOSPERT might also be limited. The inspection of the general distribution of the mean total scores of DOSPERT subscales reveals that most domains have a distribution that is right skewed – evidence that most samples had risk averse tendencies, with overall ratings clustering around “unlikely”. A Cronbach’s α that is based on Pearson’s correlations can be biased when the data is highly skewed. We encourage the use of alternative measures of internal consistency, such as McDonald’s omega, when assessing the internal consistency reliability of DOSPERT.
Furthermore, we did not investigate other sources of validity from the internal structure perspective, such as measurement invariance. Measurement invariance is a statistical property that indicates whether the same construct is being measured across different groups. Our explanations on the findings of cross-group variation of the internal consistency reliability is based on the assumption that the DOSPERT is still capturing the latent variable risk-taking, but with different levels of accuracy across groups. We encourage future studies that use DOSPERT, especially across groups, to test measurement invariance as the initial step of testing the validity of DOSPERT.
In conclusion, the current study is the first study that has used meta-analysis to explore the internal consistency of DOSPERT across populations and study settings. Overall, our study revealed that the internal consistency varied substantially across different domain subscales and depended on both scale and sample characteristics.
*Au, W. T., Lu, S., Leung, H., Yam, P., & Fung, J. M. Y. (2012). Risk and prisoner’s dilemma: A reinterpretation of Coombs’ re-parameterization. Journal of Behavioral Decision Making, 25(5), 476–490. http://dx.doi.org/10.1002/bdm.743.
*Barnes, C. D., Brown, R. P., & Tamborski, M. (2012). Living dangerously: Culture of honor, risk-taking, and the nonrandomness of “accidental” deaths. Social Psychological and Personality Science, 3(1), 100–107. http://dx.doi.org/10.1177/1948550611410440.
*Beisswingert, B. M., Zhang, K., Goetz, T., & Fischbacher, U. (2016). Spillover effects of loss of control on risky decision-making. PloS one, 11(3), e0150470. http://dx.doi.org/10.1371/journal.pone.0150470.
Begg, C. B., & Mazumdar, M. (1994). Operating characteristics of a rank correlation test for publication bias. Biometrics, 50(4), 1088–1101.
*Blais, A.-R., & Weber, E. U. (2006). A Domain-Specific Risk-Taking (DOSPERT) scale for adult populations. Judgment and Decision Making, 1(1), 33–47.
Bonett, D. G. (2002). Sample size requirements for testing and estimating coefficient alpha. Journal of Educational and Behavioral Statistics, 27(4), 335–340. http://dx.doi.org/10.3102/10769986027004335.
*Brailovskaia, J., Schillack, H., Assion, H.-J., Horn, H., & Margraf, J. (2018). Risk-taking propensity and (un)healthy behavior in Germany. Drug and Alcohol Dependence, 192(1), 324–328. http://dx.doi.org/10.1016/j.drugalcdep.2018.08.027.
*Brewer, G., & Olive, N. (2014). Depression in men and women: Relative rank, interpersonal dependency, and risk-taking. Evolutionary Behavioral Sciences, 8(3), 142–147. http://dx.doi.org/10.1037/h0097761.
Bromiley, P., & Curley, S. P. (1992). Individual differences in risk taking. In J. F. Yates (Ed.), Wiley series in human performance and cognition. Risk-taking behavior (pp. 87–132). Oxford, England: John Wiley & Sons.
*Brooks, G. A., & Clark, L. (2019). Associations between loot box use, problematic gaming and gambling, and gambling-related cognitions. Addictive Behaviors, 96, 26–34. http://dx.doi.org/10.1016/j.addbeh.2019.04.009.
*Buelow, M. T. & Brunell, A. B. (2014). Facets of grandiose narcissism predict involvement in health-risk behaviors. Personality and Individual Differences, 69, 193–198. http://dx.doi.org/10.1016/j.paid.2014.05.031.
*Byrne, Z. S., Dvorak, K. J., Peters, J. M., Ray, I., Howe, A., & Sanchez, D. (2016). From the user’s perspective: Perceptions of risk relative to benefit associated with using the Internet. Computers in Human Behavior, 59, 456–468. http://dx.doi.org/ 10.1016/j.chb.2016.02.024.
Byrnes, J. P., Miller, D. C., & Schafer, W. D. (1999). Gender differences in risk taking: A meta-analysis. Psychological Bulletin, 125(3), 367.
*Cann, A. & Cann, A. T. (2013). Humor styles, risk perceptions, and risky behavioral choices in college students. Humour - International Journal of Humour Research, 26(4), 595–608. http://dx.doi.org/10.1515/humor-2013-0033.
*Chalkidou, T. V., Bradley, M. J., & Liu, H. (2013). Identifying risk propensity of parks and recreation professionals: A certified park and recreation professional case study. Journal of the Oklahoma Association for Health, Physical Education, Recreation, and Dance, 50(3), 35–42.
*Cheung, H. Y., Teo, T., & Hue, M-T. (2015). Modeling the relationships among emotional intelligence, sensation-seeking and risk-taking attitudes of university students in Hong Kong. Journal of Risk Research, 20(5), 569–589. http://dx.doi.org/10.1080/13669877.2015.1100657.
*Cheung, H. Y., Wu, J., & Tao, J. (2016). Predicting domain-specific risk-taking attitudes of mainland China university students: a hyper core self-evaluation approach. Journal of Risk Research, 19(1), 79–100. http://dx.doi.org/10.1080/13669877.2014.948903.
*Choma, B. L., Hanoch, Y., Hodson, G., & Gummerum, M. (2014). Risk propensity among Liberals and Conservatives: The effect of risk perception, expected benefits, and risk domain. Social Psychological and Personality Science, 5(6), 713–721. http://dx.doi.org/10.1177/1948550613519682.
*Choma, B. L., & Hodson, G. (2017). Right-wing ideology: Positive (and negative) relations to threat. Social Cognition, 35(4), 415–432. http://dx.doi.org/10.1521/soco.2017.35.4.415.
Corey, D. M., Dunlap, W. P., & Burke, M. J. (1998). Averaging correlations: Expected values and bias in combined Pearson rs and Fisher’s z transformations. The Journal of General Psychology, 125(3), 245–261.
*Denovan, A., Dagnall, N., Drinkwater, K., Parker, A., & Clough, P. (2017). Perception of risk and terrorism-related behavior change: Dual influences of probabilistic reasoning and reality testing. Frontiers in Psychology, 8, 1721. http://dx.doi.org/10.3389/fpsyg.2017.01721.
*Djeriouat, H. (2015). Self-determination and risk: The role of life goals and causality orientation in domain-specific risk propensity. Journal of Risk Research, 20(2), 256–276. http://dx.doi.org/10.1080/13669877.2015.1043573.
*Du, X., Li, J., & Du, X. (2014). Testing risk-taking behavior in Chinese undergraduate students. PLoS ONE, 9(5), e97989. http://dx.doi.org/10.1371/journal.pone.0097989.
*Dunn, J. C., Whelton, W. J., & Sharpe, D. (2012). Retreating to safety: testing the social risk hypothesis model of depression. Evolution and Human Behavior, 33(6), 746–758. http://dx.doi.org/10.1016/j.evolhumbehav.2012.06.002.
*Egelman, S., & Peer, E. (2015). The myth of the average user: Improving privacy and security systems through individualization. In Proceedings of the 2015 New Security Paradigms Workshop (pp. 16–28). ACM.
Faraji-Rad, A., Melumad, S., & Johar, G. V. (2017). Consumer desire for control as a barrier to new product adoption. Journal of Consumer Psychology, 27(3), 347–354. http://dx.doi.org/10.1016/J.JCPS.2016.08.002.
Field, A. P. (2001). Meta-analysis of correlation coefficients: a Monte Carlo comparison of fixed-and random-effects methods. Psychological Methods, 6(2), 161.
*Fessler, D. M. T., Tiokhin, L. B., Holbrook, C., Gervais, M. M., & Snyder, J. K. (2014). Foundations of the Crazy Bastard Hypothesis: Nonviolent physical risk-taking enhances conceptualized formidability. Evolution and Human Behavior, 35(1), 26–33.http://dx.doi.org/10.1016/j.evolhumbehav.2013.09.003.
Fong, D. Y., Ho, S. Y., & Lam, T. H. (2010). Evaluation of internal reliability in the presence of inconsistent responses. Health and Quality of Life Outcomes, 8(1), 27
*Foster, J. D., Shenesey, J. W., & Goff, J. S. (2009). Why do narcissists take more risks? Testing the roles of perceived risks and benefits of risky behaviors. Personality and Individual Differences, 47, 885–889. http://dx.doi.org/10.1016/j.paid.2009.07.008.
Frey, R., Pedroni, A., Mata, R., Rieskamp, J., & Hertwig, R. (2017). Risk preference shares the psychometric structure of major psychological traits. Science Advances, 3(10), e1701381.
Gabriel, K. I., & Williamson, A. (2010). Framing alters risk-taking behavior on a modified balloon analogue risk task (Bart) in a sex-specific manner. Psychological Reports, 107(3), 699–712. http://dx.doi.org/10.2466/02.09.20.PR0.107.6.699-712.
Geisinger, K. F. (2013). Reliability. In K. F. Geisinger (Ed.), APA handbook of testing and assessment in Psychology: Vol. 1. Test Theory and Testing and Assessment in Industrial and Organizational Psychology (Vol. 1, pp. 21–41). Washington: American Psychological Association. http://dx.doi.org/10.1037/14047-002.
*Ghoroghi, S., Hassan, S. A., & Ayub, A. F. M. (2017). The influence of religiosity and risk taking on cybersex engagement among postgraduate students: A study in Malaysian universities. International Journal of Social Science and Humanity, 7(3), 143–152. http://dx.doi.org/10.18178/ijssh.2017.7.3.810.
*Golub, S. A. (2014). Tensions between the epidemiology and psychology of HIV risk: Implications for pre-exposure prophylaxis. AIDS and Behavior, 18(9), 1686–1693
*Greitemeyer, T., Kastenmüller, A., & Fischer, P. (2013). Romantic motives and risk-taking: an evolutionary approach. Journal of Risk Research, 16(1), 19–38. http://dx.doi.org/10.1080/13669877.2012.713388.
*Gummerum, M., Hanoch, Y., & Rolison, J. J. (2014). Offenders’ risk-taking attitude inside and outside the prison walls. Risk Analysis, 34(10), 1870–1881. http://dx.doi.org/10.1111/risa.12222.
Guolo, A., & Varin, C. (2017). Random-effects meta-analysis: The number of studies matters. Statistical Methods in Medical Research, 26(3), 1500–1518. http://dx.doi.org/10.1177/0962280215583568.
*Hamurcu, C. & Hamurcu, D. Y. H. (2017). Financial investment & gambling risk taking behaviors and ego states relations. TURAN: Stratejik Arastirmalar Merkezi, 9(34), 188–195. http://dx.doi.org/10.15189/1308-8041.
Henson, R. K., & Hwang, D. Y. (2002). Variability and prediction of measurement error in Kolb’s learning style inventory scores a reliability generalization study. Educational and Psychological Measurement, 62(4), 712–727.
*Highhouse, S., Nye, C. D., Zhang, D. C., & Rada, T. B. (2017). Structure of the DOSPERT: Is there evidence for a general risk factor? Journal of Behavioral Decision Making, 30, 400–406. http://dx.doi.org/10.1002/bdm.1953.
Higgins, J. P. T., & Thompson, S. G. (2002). Quantifying heterogeneity in a meta-analysis. Statistics in Medicine, 21(11), 1539–1558. http://dx.doi.org/10.1002/sim.1186.
*Horcajo, J., Rubio, V. J., Aguado, D., Hernández, J. M., & Márquez, M. O. (2014). Using the implicit association test to assess risk propensity self-concept: Analysis of its predictive validity on a risk-taking behaviour in a natural setting. European Journal of Personality, 28, 459–471. http://dx.doi.org/10.1002/per.1925.
*Hosker-Field, A. M., Molnar, D. S., & Book, A. S. (2016). Psychopathy and risk taking: Examining the role of risk perception. Personality and Individual Differences, 91, 123–132. http://dx.doi.org/10.1016/j.paid.2015.11.059.
Huedo-Medina, T. B., Sánchez-Meca, J., Marín-Martínez, F., & Botella, J. (2006). Assessing heterogeneity in meta-analysis: Q statistic or I2 index?. Psychological Methods, 11(2), 193–206.
Hung, K.T., & Tangpong, C. (2010). General risk propensity in multifaceted business decisions[202F?]: Scale development, Journal of Managerial Issues, 22(1), 88–106.
*Hu, X. & Xie, X. (2012). Validation of the Domain-Specific Risk-Taking Scale in Chinese college students. Judgment and Decision Making, 7(2), 181–188.
*Jochemczyk, Ł., Pietrzak, J., Buczkowski, R., Stolarski, M., & Markiewicz, Ł. (2017). You Only Live Once: Present-hedonistic time perspective predicts risk propensity. Personality and Individual Differences, 15(1), 148–153. http://dx.doi.org/10.1016/j.paid.2016.03.010.
*Johnson, S. L., Tharp, J. A., Peckham, A. D., Sanchez, A. H., & Carver, C. S. (2016). Positive urgency is related to difficulty inhibiting prepotent responses. Emotion, 16(5), 750–759. http://dx.doi.org/10.1037/emo0000182.
*Johnson, J. G., Wilke, A., & Weber, E. U. (2004). Beyond a trait view of risk taking: A domain-specific scale measuring risk perceptions, expected benefits, and perceived-risk attitudes in German-speaking populations. Polish Psychological Bulletin, 35(3), 153–163.
*Kennison, S. M., Wood, E. E., Byrd-Craven, J., & Downing, M. L. (2016). Financial and ethical risk-taking by young adults: A role for family dynamics during childhood. Cogent Economics & Finance, 4(1), 1232225. http://dx.doi.org/10.1080/23322039.2016.1232225.
*Khodarahimi, S., & Fathi, R. (2016). Mental health, coping styles, and risk-taking behaviors in young adults. Journal of Forensic Psychology Practice, 16(4), 287–303. http://dx.doi.org/10.1080/15228932.2016.1196101.
Kieffer, K. M., & Reese, R. J. (2002). A reliability generalization study of the Geriatric Depression Scale. Educational and Psychological Measurement, 62(6), 969–994.
Knapp, G., & Hartung, J. (2003). Improved tests for a random effects meta-regression with a single covariate. Statistics in Medicine, 22(17), 2693–2710. http://dx.doi.org/10.1002/sim.1482.
*Koehler, D. J., Langstaff, J., & Liu, W.-Q. (2015). A simulated financial savings task for studying consumption and retirement decision making. Journal of Economic Psychology, 46, 89–97. http://dx.doi.org/10.1016/j.joep.2014.12.004.
Koerner, N., Mejia, T., & Kusec, A. (2017). What’s in a name? Intolerance of uncertainty, other uncertainty-relevant constructs, and their differential relations to worry and generalized anxiety disorder. Cognitive Behaviour Therapy, 46(2), 141–161. http://dx.doi.org/10.1080/16506073.2016.1211172.
Komorita, S. S., & Graham, W. K. (1965). Number of scale points and the reliability of scales. Educational and Psychological Measurement, 25(4), 987–995.
*Kopetz, C. E., Woerner, J. I., Starnes, W., & Dedvukaj, J. (2019). It’s risky, therefore I do it: Counterfinality as a source of perceived instrumentality of risk behavior as means to goals. Journal of Experimental Social Psychology, 81, 39–52. http://dx.doi.org/10.1016/j.jesp.2018.08.001.
*Kostek, J. & Ashrafioun, L. (2014). Tired winners: The effects of cognitive resources and prior winning on risky decision making. Journal of Gambling Studies, 30(2), 423–434.
*Krockow, E. M., Takezawa, M., Pulford, B. D., Colman, A. M., & Kita, T. (2017). Cooperation and trust in Japanese and British samples: Evidence from incomplete information games. International Perspectives in Psychology: Research, Practice, Consultation, 6(4), 227–245. http://dx.doi.org/10.1037/ipp0000074.
*Kupor, D. M., Laurin, K., & Levav, J. (2015). Anticipating divine protection? Reminders of God Can increase nonmoral risk taking. Psychological Science, 26(4), 374–384.
*Kwon, M., Han, Y., & Nam, M. (2017). Envy takes you further: The influence of benign envy on risk taking. Social Behavior and Personality, 45(1), 39–50. http://dx.doi.org/10.2224/sbp.5977.
Langan, D., Higgins, J. P. T., Jackson, D., Bowden, J., Veroniki, A. A., & Kontopantelis, E., … Simmonds, M. (2019). A comparison of heterogeneity variance estimators in simulated random-effects meta-analyses. Research Synthesis Methods, 10(1), 83–98. http://dx.doi.org/10.1002/jrsm.1316.
*Lee, J. E. C., & Blais, A-R. (2014). An exploratory analysis of the correlates of risk-taking propensity in Canadian military personnel. Psychology, 5(1), 53–61. http://dx.doi.org/10.4236/psych.2014.51010.
Lepp, A., & Gibson, H. (2008). Sensation seeking and tourism: Tourist role, perception of risk and destination choice. Tourism Management, 29(4), 740–750. http://dx.doi.org/10.1016/j.tourman.2007.08.002.
Leung, S.-O. (2011). A Comparison of psychometric properties and normality in 4-, 5-, 6-, and 11-point Likert scales. Journal of Social Service Research, 37(4), 412–421. http://dx.doi.org/10.1080/01488376.2011.580697.
*Li, L. M. W., Hamamura, T., & Adams, G. (2016). Relational mobility increases social (but not other) risk propensity. Journal of Behavioral Decision Making, 29(5), 481–488. http://dx.doi.org/10.1002/bdm.1894.
Lissitz, R. W., & Green, S. B. (1975). Effect of the number of scale points on reliability: A Monte Carlo approach. Journal of Applied Psychology, 60(1), 10–13.
Lord, F. M., & Novick, M. R. (1968). Statistical theories of mental test scores. Reading, MA: Addison-Wesley.
*Lorian, C. N., & Grisham, J. R. (2010). The safety bias: Risk-avoidance and social anxiety pathology. Behaviour Change, 27(1), 29–41. http://dx.doi.org/10.1375/bech.27.1.29.
*Lorian, C. N., Mahoney, A., & Grisham, J. R. (2012). Playing it safe: An examination of risk-avoidance in an anxious treatment-seeking sample. Journal of Affective Disorders, 141, 63–71. http://dx.doi.org/10.1016/j.jad.2012.02.021.
*Lorian, C. N., Titov, N., & Grisham, J. R. (2012). Changes in risk-taking over the course of an internet-delivered cognitive behavioral therapy treatment for generalized anxiety disorder. Journal of Anxiety Disorders, 26(1), 140–149. http://dx.doi.org/10.1016/j.janxdis.2011.10.003.
*Lozano, L. M., Megías, A., Catena, A., Perales, J. C., Baltruschat, S., & Cándido, A. (2017). Spanish validation of the Domain-Specific Risk-Taking (DOSPERT-30) Scale. Psicothema, 29(1), 111–118. http://dx.doi.org/10.7334/psicothema2016.132.
Mathur, A., & Chetty, M. (2017). Impact of user characteristics on attitudes towards automatic mobile application updates. Proceedings of 13th Symposium on Usable Privacy and Security, 175–193.
*McIntyre, K. A. & Platania, J. (2009). Giving in to group pressure: The impact of socialization and risk on perceived outcomes. Current Research in Social Psychology, 15(2), 15–32.
Messick, S. (1995). Validity of psychological assessment: Validation of inferences from persons’ responses and performances as scientific inquiry into score meaning. American Psychologist, 50(9), 741–749. https://doi.org/10.1037/0003-066X.50.9.741
*Mishra, S. & Sritharan, R. (2012). Personality and behavioral outcomes associated with risk-taking are accurately inferred from faces. Journal of Research in Personality, 46(6), 760–764. http://dx.doi.org/10.1016/j.jrp.2012.06.007.
*Mitchell, V. E., Mogilski, J. K., Zeigler-Hill, V., & Welling, L. L. M. (2019). Mate poaching strategies are differentially associated with pathological personality traits and risk-taking in men and women. Personality and Individual Differences, 142, 110–115. http://dx.doi.org/10.1016/j.paid.2019.01.045.
Nicholson, N., Soane, E., Fenton-O’Creevy, M., & Willman, P. (2005). Personality and domain-specific risk taking. Journal of Risk Research, 8(2), 157–176.
*Olapegba, P. O., & Idemudia, E. S. (2012). Dispositional and Contextual Factors Predicting Smuggling Behaviour among Smugglers in Border Areas in Nigeria. Journal of Psychology, 3(2), 59–64. http://dx.doi.org/10.1080/09764224.2012.11885478.
*Padilla, J. L., Doncel, P., Gugliotta, A., & Castro, C. (2018). Which drivers are at risk? Factors that determine the profile of the reoffender driver. Accident Analysis and Prevention, 119, 237–247. http://dx.doi.org/10.1016/j.aap.2018.07.021.
*Park, L. E., Ward, D. E., & Naragon-Gainey, K. (2017). It’s all about the money (for some): Consequeces of financially contingent self-worth. Personality and Social Psychology Bulletin, 43(5), 601–622. http://dx.doi.org/10.1177/0146167216689080.
*Petrova, D., Garcia-Retamero, R., & van der Pligt, J. (2016). What factors moderate self-other discrepancies in decision making? Results from a vaccination scenario. The Spanish Journal of Psychology, 19, e52, 1–11. http://dx.doi.org/10.1017/sjp.2016.50.
*Pietri, E. S., Fazio, R. H., & Shook, N. J. (2013). Weighting Positive Versus Negative: The Fundamental Nature of Valence Asymmetry. Journal of Personality, 81(2), 196–208. http://dx.doi.org/10.1111/j.1467-6494.2012.00800.x.
Pizam, A., Jeong, G. H., Reichel, A., van Boemmel, H., Lusson, J. M., & Steynberg, L., … Montmany, N. (2004). The relationship between risk-taking, sensation-seeking, and the tourist behavior of young adults: A cross-cultural study. Journal of Travel Research, 42(3), 251–260. http://dx.doi.org/10.1177/0047287503258837.
Revelle, M. W. (2017). psych: Procedures for personality and psychological research (R package).
Revelle, W., & Condon, D. M. (2017). Reliability. In P. Irwing, T. Booth, & D. J. Hughes (Eds.), The wiley handbook of psychometric testing: A multidisciplinary reference on survey, scale and test development, (Vol. 2–2, pp. 709–749). Wiley Blackwell.
*Reynaud, A., & Couture, S. (2012). Stability of risk preference measures: Results from a field experiment on French farmers. Theory and Decision, 73(2), 203–221. http://dx.doi.org/10.1007/s11238-012-9296-5.
*Riggs Romaine, C. L. (2018). Psychosocial maturity and risk-taking in emerging adults: Extending our understanding beyond delinquency. Emerging Adulthood, 1–15. http://dx.doi.org/10.1177/2167696818768013.
Roalf, D. R., Mitchell, S. H., Harbaugh, W. T., & Janowsky, J. S. (2012). Risk, reward, and economic decision making in aging. The Journals of Gerontology: Series B, 67B(3), 289–298. http://dx.doi.org/10.1093/geronb/gbr099.
*Rolison, J.J., Hanoch, Y., Wood, S., & Liu, P.J. (2014). Risk-taking differences across the adult life span: A question of age and domain. Journals of Gerontology, Series B: Psychological Sciences and Social Sciences, 69(6), 870–880. http://dx.doi.org/10.1093/geronb/gbt081.
*Romero, E., Villar, P., Gómez-Fraguela, A., & López-Romero, L. (2012). Measuring personality traits with ultra-short scales: A study of the Ten Item Personality Inventory (TIPI) in a Spanish sample. Personality and Individual Differences, 53(3), 289–293.
*Rosenthal-von der Pütten, A. M. & Hoefinghoff, J. (2018). The more the merrier? Effects of humanlike learning abilities on humans’ perception and evaluation of a robot. International Journal of Social Robotics, 10(4), 455–472.
*Rosman, A., Garcia, M., Lee, S., Butler, S., & Schwartz, A. (2013). DOSPERT+M: A survey of medical risk attitudes in the United States. Judgment and Decision Making, 8(4), 470–481.
*Samat, S., Acquisti, A., & Babcock, L. (2017). Raise the curtains: The effect of awareness about targeting on consumer attitudes and purchase intentions. Proceedings of the Thirteenth Symposium on Usable Privacy and Security, 299–319.
*Satchella, L. P., Bacon, A. M., Firth, J. L., & Corr, P. J. (2018). Risk as reward: Reinforcement sensitivity theory and psychopathic personality perspectives on everyday risk-taking. Personality and Individual Differences, 128, 162–169. http://dx.doi.org/10.1016/j.paid.2018.02.039.
Schmitz, F., Kunina-Habenicht, O., Hildebrandt, A., Oberauer, K., & Wilhelm, O. (2018). Psychometrics of the Iowa and Berlin gambling tasks: Unresolved issues with reliability and validity for risk taking. Assessment. http://dx.doi.org/10.1177/1073191117750470.
Schoemaker, P. J. (1990). Are risk-attitudes related across domains and response modes?. Management Science, 36(12), 1451–1463.
Schumpe, B. M., Bélanger, J. J., Dugas, M., Erb, H.-P., & Kruglanski, A. W. (2018). Counterfinality: On the increased perceived instrumentality of means to a goal. Frontiers in Psychology, 9, 1052. http://dx.doi.org/10.3389/fpsyg.2018.01052.
*Schumpe, B. M., Brizi, A., Giacomantonio, M., Panno, A., Kopetz, C.,Kosta, M., & Mannetti, L. (2017). Need for Cognitive Closure decreases risk taking and motivates discounting of delayed rewards. Personality and Individual Differences, 107, 66–71. http://dx.doi.org/10.1016/j.paid.2016.11.039.
*Schumpe, B. M., Herzberg, P. Y., & Erb, H-P. (2016). Assessing the Need for Uniqueness: Validation of the German NfU-G scale. Personality and Individual Differences, 90, 231–237. http://dx.doi.org/10.1016/j.paid.2015.11.012.
*Schwartz, A., Yamagishi, K., Hirahara, N., Onishi, H., Barnes, J., & Rosman, A., … Butler, S. (2013). Risk perception and risk attitudes in Tokyo: A report of the first administration of DOSPERT+M in Japan. Judgment and Decision Making, 8(6), 691–699.
*Sevi, B. (2019). Brief report: Tinder users are risk takers and have low sexual disgust sensitivity. Evolutionary Psychological Science, 5(1), 104–108. http://dx.doi.org/10.1007/s40806-018-0170-8.
Schmidt, F.L., & Hunter, J.E., (1999). Theory Testing and Measurement Error, Intelligence, 27(3). http://dx.doi.org/10.1016/S0160-2896(99)00024-0.
*Shook, N. J., Delaney, R. K., Strough, J., Wilson, J. M., Sevi, B., & Altman, N. (2019). Playing it safe: Dispositional mindfulness partially accounts for age differences in health and safety risk-taking propensity. Current Psychology. http://dx.doi.org/10.1007/s12144-019-0137-3.
Shrout, P. E., & Lane, S. P. (2012). Reliability. In H. Cooper, P. M. Camic, D. L. Long, A. T. Panter, D. Rindskopf, & K. J. Sher (Eds.), APA handbook of research methods in psychology, Vol 1: Foundations, planning, measures, and psychometrics (pp. 643–660). Washington: American Psychological Association. http://dx.doi.org/10.1037/13619-034.
Sireci, S. G. & Sukin, T. (2013). Test validity. In K. F. Geisinger, B. A. Bracken, J. F. Carlson, J.-I. C. Hansen, N. R. Kuncel, S. P. Reise, & M. C. Rodriguez (Eds.), APA handbooks in psychology. APA handbook of testing and assessment in psychology, Vol. 1. Test theory and testing and assessment in industrial and organizational psychology (pp. 61–84). Washington, DC, US: American Psychological Association. http://dx.doi.org/10.1037/14047-004.
*Smithson, M., & Baker, C. (2008). Risk orientation, loving, and liking in long-term romantic relationships. Journal of Social and Personal Relationships, 25(1), 87–103. http://dx.doi.org/10.1177/0265407507086807.
* Soane, E., Dewberry, C., & Narendran, S. (2010). The role of perceived costs and perceived benefits in the relationship between personality and risk-related choices. Journal of Risk Research, 13(3), 303–318.
Streufert, S. (1986). Individual differences in risk taking. Journal of Applied Social Psychology, 16(6), 482–497. http://dx.doi.org/10.1111/j.1559-1816.1986.tb01154.x.
*Syndicus, M., Wiese, B. S., & van Treeck, C. (2018). In the heat and noise of the moment: Effects on risky decision making. Environment and Behavior, 50(1), 3–27. http://dx.doi.org/10.1177/0013916516680700.
*Thoma, V., White, E., Panigrahi, A., Strowger, V., & Anderson, I. (2015). Good thinking or gut feeling? Cognitive reflection and intuition in traders, bankers and financial non-experts. PloS one, 10(4), e0123202. http://dx.doi.org/10.1371/journal.pone.0123202.
Tischer, M., Durumeric, Z., Foster, S., Duan, S., Mori, A., Bursztein, E., & Bailey, M. (2016). Users really do plug in USB drives they find. IEEE Symposium on Security and Privacy (2016), 306–319.
*Toh, C. A. & Miller, S. R. (2016). Creativity in design teams: the influence of personality traits and risk attitudes on creative concept selection. Research in Engineering Design, 27(1), 73–89.
*Tyagi, V., Hanoch, Y., Choma, B., & Denham, S. L. (2018). The ‘Right’ side of creativity: Creative personality and social risk-taking predict political party affiliation. Creativity Research Journal, 30(4), 451–460.
*Tyagi, V., Hanoch, Y., Hall, S. D., Runco, M., & Denham, S. L. (2017). The risky side of creativity: Domain specific risk taking in creative individuals. Frontiers in Psychology, 8. http://dx.doi.org/10.3389/fpsyg.2017.00145.
Vacha-Haase, T. (1998). Reliability generalization: Exploring variance in measurement error affecting score reliability across studies. Educational and Psychological Measurement, 58(1), 6–20.
Vacha-Haase, T., Henson, R. K., & Caruso, J. C. (2002). Reliability generalization: Moving toward improved understanding and use of score reliability. Educational and Psychological Measurement, 62(4), 562–569. http://dx.doi.org/10.1177/0013164402062004002.
Viechtbauer, W. (2010). Conducting meta-analyses in R with the metafor package. Journal of Statistical Software, 36(3), 1–48. http://dx.doi.org/10.1103/PhysRevB.91.121108.
Viechtbauer, W., & Cheung, M. W.-L. (2010). Outlier and influence diagnostics for meta-analysis. Research Synthesis Methods, 1(2), 112–125. http://dx.doi.org/10.1002/jrsm.11.
Viechtbauer, W., López-López, J. A., Sánchez-Meca, J., & Marín-Martínez, F. (2015). A comparison of procedures to test for moderators in mixed-effects meta-regression models. Psychological Methods, 20(3), 360–374. http://dx.doi.org/10.1037/met0000023.
*Wang, L., & Chartrand, T. L. (2014). Morningness–eveningness and risk taking. The Journal of Psychology, 149(4), 394–411. http://dx.doi.org/10.1080/00223980.2014.885874.
*Wang, Y., Jing, Y., Zhang, Z., Lin, C., & Valadez, E. A. (2017). How dispositional social risk-seeking promotes trusting strangers: Evidence based on brain potentials and neural oscillations. Journal of Experimental Psychology: General, 146(8), 1150–1163. http://dx.doi.org/10.1037/xge0000328.
Wasserman, J. D. & Bracken, B. A. (2013). Fundamental psychometric considerations in assessment. In I. B. Weiner, J. R. Graham, & J. A. Naglieri (Eds.), Handbook of psychology. Assessment psychology (2nd ed., Vol. 10, pp. 50–81). Hoboken, NJ: John Wiley & Sons.
*Weber, E. U., Blais, A.-R., & Betz, N. E. (2002). A domain-specific risk-attitude scale: Measuring risk perceptions and risk behaviors. Journal of Behavioral Decision Making, 15(4), 263–290. http://dx.doi.org/10.1002/bdm.414.
*Weller, J. A., Ceschi, A., & Randolph, C. (2015). Decision-making competence predicts domain-specific risk attitudes. Frontiers in Psychology, 6, 540. http://dx.doi.org/10.3389/fpsyg.2015.00540.
*Weller, J. A., & Tikir, A. (2011). Predicting domain-specific risk taking with the HEXACO personality structure. Journal of Behavioral Decision Making, 24, 180–201. http://dx.doi.org/10.1002/bdm.677.
*Wester, J., Timpano, K. R., Çek, D., & Broad, K. (2016). The psychology of recycled water: Factors predicting disgust and willingness to use. Water Resources Research, 52, 3212–3226. http://dx.doi.org/10.1002/2015WR018340.
*Wichary, S., Pachur, T., & Li, M. (2015). Risk-taking tendencies in prisoners and nonprisoners: Does gender matter? Journal of Behavioral Decision Making, 28, 504–514. http://dx.doi.org/10.1002/bdm.1866.
*Wick, S. E., Nagoshi, C., Basham, R., Jordan, C., Kim, Y. K., Phuong, A., & Lehmann, P. (2017). Patterns of cyber harassment and perpetration among college students in the United States: A test of routine activities theory. International Journal of Cyber Criminology, 11(1), 24–38. http://dx.doi.org/10.5281/zenodo.495770.
*Wu, J. & Cheung, H. Y. (2014). Confirmatory factor analysis of DOSPERT scale with Chinese university students. Psychological Reports: Mental & Physical Health, 114(1), 185–187. http://dx.doi.org/10.2466/09.03.PR0.114k15w2.
*Yechiam, E., & Telpaz, A. (2013). Losses induce consistency in risk taking even without loss aversion. Journal of Behavioral Decision Making, 26, 31–40. http://dx.doi.org/10.1002/bdm.758.
*Zhang, D. C., Foster, G. C., & McKenna, M. G. (2018). Is the DOSPERT gender invariant? A psychometric test of measurement invariance. Journal of Behavioral Decision Making, 32, 203–211. http://dx.doi.org/10.1002/bdm.2105.
*Zimerman, L., Shalvi, S., & Bereby-Meyer, Y. (2014). Self-reported
ethical risk taking tendencies predict actual dishonesty. Judgment
and Decision Making, 9(1), 58–64.
*Publications that were included in the meta-analysis.
This research was supported by the Australian Government through the Australian Research Council (Project number DE180100015).
Copyright: © 2020. The authors license this article under the terms of the Creative Commons Attribution 3.0 License.
This document was translated from LATEX by HEVEA.