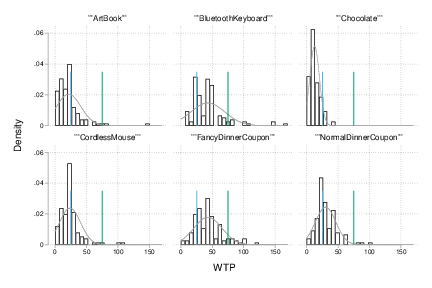
| Figure 2: WTP distribution of each item in Study 1. The blue line indicates $25 and the green line indicates $75. |
Judgment and Decision Making, Vol. 14, No. 4, July 2019, pp. 470-487
The robustness of anchoring effects on preferential judgmentsSangsuk Yoon* Nathan M. Fong# Angelika Dimoka$ |
Anchoring has been shown to influence numeric judgments in various domains, including preferential judgment tasks. Whereas many studies and a recent Many Labs project have shown robust effects in classic anchoring tasks, studies of anchoring effects on preferential judgments have had inconsistent results. In this paper, we investigate the replicability and robustness of anchoring on willingness-to-pay, which is a widely used measure for consumer preference. We employ a combination of approaches, aggregating data from previous studies and also contributing additional replication studies designed to reconcile inconsistent previous results. We examine the effect of differing experimental procedures used in prior studies, and test whether publication bias could contribute to the inconsistent findings. We find that different experimental procedures used in previous studies do not explain the divergent results, and that anchoring effects are generally robust to differences in procedures, participant populations, and experimental settings.
Keywords: anchoring effect, valuation, willingness-to-pay, replication, incentive compatibility
The anchoring effect refers to the tendency for people’s numeric judgments to be influenced by an irrelevant value (Tversky & Kahneman, 1974). For example, when tasked with estimating the length of the Mississippi River (Jacowitz & Kahneman, 1995), depending on whether they are first asked whether the Mississippi River is longer or shorter than a smaller or larger “anchor” (70 vs. 2,000 miles), respondents will provide a smaller or larger estimate (median estimates 300 and 1,500). The anchoring effect has been studied in many domains, such as factual questions (Chapman & Johnson, 1994; Epley & Gilovich, 2001, 2005, 2006; Mussweiler & Englich, 2005; Mussweiler & Strack, 1999; Tversky & Kahneman, 1974; Wegener, Petty, Blankenship, & Detweiler-Bedell, 2010), physical and temporal length estimation (LeBoeuf & Shafir, 2006, 2009), answers to math questions (Smith & Windschitl, 2011), legal judgments (Englich, 2008; Mussweiler, 2001), performance judgments (Thorsteinson, 2011; Thorsteinson, Breier, Atwell, Hamilton, & Privette, 2008), negotiations (Galinsky & Mussweiler, 2001; Loschelder, Trötschel, Swaab, Friese, & Galinsky, 2016), and purchase quantities (Wansink, Kent, & Hoch, 1998).
4in
ITEM 1 Description ITEM
Would you buy this item for $ ANCHOR ? Circle: YES or NO
The most I would be willing to pay for this item is $ WTP
Figure 1: An example of questions used in Ariely et al. (2003) and in the current study.
Anchoring effects have also been documented in a variety of valuation tasks (Ariely, Loewenstein & Prelec, 2003; Bergman, Ellingsen, Johannesson & Svensson, 2010; Chapman & Johnson, 1999; Green, Jacowitz, Kahneman & McFadden, 1998; Ma, Li, Shen & Qiu, 2015; Northcraft & Neale, 1987; Sugden, Zheng & Zizzo, 2013). For example, Johnson and Schkade (1989) showed anchoring effects in preference matching tasks where people estimated indifference points between sure gains and risky gambles, both when estimating win probabilities and certainty equivalents, and Chapman and Johnson (1999) also showed that simply asking people whether they would sell a lottery for an anchor price derived from the last four digits of Social Security number affected their selling price for the lottery. Anchoring effects have also been shown to affect people’s willingness to pay (WTP) for public goods in contingent valuation tasks (Flachaire & Hollard, 2006; Green et al., 1998; Van Exel, Brouwer, van den Berg & Koopmanschap, 2006). For example, Green et al. (1998) asked people whether they agreed with a policy requiring them to pay a certain dollar amount (the anchor) to save or improve public goods (e.g., saving 50,000 offshore Pacific Coast seabirds from small offshore oil spills, and California highway improvements and improved enforcement of traffic law) followed by a WTP question, and found that higher anchors induced significantly higher WTP. Anchoring has also been shown to influence consumers’ WTP for market goods. Notably, Ariely et al. (2003) showed that, in consequential decision making situations where real money and products were at stake, people’s valuations of consumer products were strongly and systematically influenced by numbers that should have no bearing on their own preferential judgments. Ariely and colleagues showed several items to participants in a class and asked them whether they were willing to buy the given items for a dollar amount derived from the last two digits of their Social Security numbers (SSN, hereafter; see Figure 1). The same participants were also asked their willingness-to-pay (WTP, hereafter) using an incentive compatible Becker-DeGroot-Marschak (BDM, hereafter) mechanism (Becker, DeGroot & Marschak, 1964). Importantly, the experimental items used were common consumer products, for which participants would be expected to have well-defined preferences, and the task was incentive compatible, so their responses were consequential. The results showed that people’s WTP for the given items was strongly and systematically influenced by the anchoring number (i.e., positive correlation between the anchoring number and WTP), although their relative valuations across the given items gave the appearance of coherence. This finding contradicts the claim that choices reflect stable and precise underlying preferences, and supports theories of constructed preferences, according to which stated preferences are context and task dependent (Slovic, 1995).
Despite the theoretical importance of the result, empirical evidence for the anchoring effect on consumer product valuations has only been documented in a handful of published studies. The recent massive replication of classic anchoring effects (for factual questions) across 36 different samples and settings showed stronger effects than the original study (Klein et al., 2014), whereas several other (non-anchoring) psychological effects were not replicable in the large-scale replication effort. These findings highlight the robustness of anchoring in factual judgments, and the importance of replication in experimental social science. In contrast, replications of anchoring for product valuations have been inconsistent, including a failed direct replication of the Ariely et al. (2003) experiment (e.g., Fudenberg, Levine & Maniadis, 2012).
Valuation anchoring tasks have several distinctive characteristics compared to classic anchoring tasks. First, whereas in classic anchoring tasks there is a correct answer for each target question (e.g., the length of Mississippi river is 2,320 miles), valuation anchoring tasks do not have a single correct answer. Participants in the classic anchoring tasks seek to respond with the correct answer and retrieve and combine relevant information to estimate the correct answer. In valuation anchoring tasks, on the other hand, participants simply need to focus on their own preference for or the utility of the given items. Second, participants’ answers are often consequential in valuation anchoring tasks. Valuation anchoring tasks often employ an incentive compatible method where stating one’s true preference is the best strategy. If participants state a lower amount than their true preference, they lose a chance to purchase the item for less than their reservation price, whereas, if they state a higher amount, they have a chance of paying more than the item is worth to them. Several classic anchoring studies used incentive compatibility, but the incentives were based on whether participants’ answers were close to the correct answer (Epley & Gilovich, 2005; Simmons, LeBoeuf & Nelson, 2010). Previous anchoring studies have shown that anchoring effects were reduced when the task was incentivized (Simmons et al., 2010; Simonson & Drolet, 2004; Sugden et al., 2013). These two distinctive characteristics might contribute to inconsistent anchoring effects in valuation tasks relative to classic anchoring tasks.
In a set of three experiments and a cross-study analysis, we assess the replicability of anchoring effects for preferential judgments and find that anchoring effects on WTP are robust to differences in experimental settings and procedures. Our review of prior studies reveals highly divergent results, but leaves open the possibility that the discrepancies were caused by procedural differences. We attempt to explain the divergence by systematically replicating the Ariely et al. (2003) study with several variations of experimental procedures. While previous studies report a wide range of results, our studies show strong anchoring effects near the middle of the range. However, we do not find that procedural differences account for the differences in previous studies. Moreover, we introduce two new variations of the experiment that further establish the procedural robustness of the effect. In Study 3, we vary the anchoring number between items, within subjects, so that participants’ attention to any particular anchoring number is weaker than in the prior studies. We also vary whether we instruct participants to consider the amount that they spent on similar previous purchase experiences, to investigate the possible overriding effect of internal reference prices, yet still found significant anchoring effects.
Although previous valuation anchoring studies have examined both WTA (willingness-to-accept) and WTP, we focus on WTP in the current study for several reasons. First, previous direct replications of anchoring effects on WTP, using very similar procedures, have shown inconsistent results (Bergman et al., 2010; Fudenberg et al., 2012). We aim to investigate whether the remaining differences in experimental procedures could plausibly account for this inconsistency. Second, WTP decisions are more familiar to most people than WTA decisions. As consumers, people make WTP decisions more frequently than WTA decisions (e.g., people may have more experience of purchasing books than selling books). It is probable that significant anchoring effects on WTA could be driven by “mistakes” from lower familiarity with WTA tasks (Alevy, Landry & List, 2015), whereas the higher familiarity with WTP tasks may enable us to test anchoring effects on more typical preferential judgments. Last, for WTA, people may adopt the mindset that they do not want to keep an item, and are thus focused on dispensing of the item, whereas for WTP, people consider their desire for the item (Simonson & Drolet, 2004; Sugden et al., 2013). Thus, WTP represents consumer preferences better than WTA.
Finally, combining our data with that from previous valuation studies, we report a cross-study analysis, which shows that the anchoring effect is consistently found, yet the magnitude varies across studies. Additionally, a p-curve analysis (Simonsohn, Nelson & Simmons, 2014) shows no indication that reported anchoring effects for consumer product valuations result from publication bias or other censoring, and a meta-analysis using effect sizes from previous studies confirms a significant anchoring effect on WTP. Comparing across studies, we do not find that procedural differences account for variation in the magnitude of anchoring effects. We do find that the percentile rank gap, a measure of the overlap in the ranges of anchor values and consumer valuations (proposed by Jung, Perfecto & Nelson, 2016), affects the strength of the anchoring manipulation. This finding supports theories of anchoring where the effect requires that the distribution of participants’ valuations coincides with the range of anchor values used.
While anchoring effects have been shown in a variety of valuation tasks, relatively few focus on preferential judgments where participants report valuations for familiar consumer products. Bergman et al. (2010) found a significant anchoring effect for five out of six items (e.g., rare and average wines, chocolate truffles, Belgian chocolates, design book, and radio transmitter for mp3-player), and Simonson and Drolet (2004) showed similar results with different items (e.g., toaster, cordless phone, backpack, and headphones). Using a series of binary choices, Sugden et al. (2013) found stronger anchoring effects on WTA than those on WTP. However, Fudenberg et al. (2012) did not find significant anchoring effects on WTP for any of six items (academic planner, cordless keyboard, financial calculator, designer book, milk chocolates, and cordless mouse); similarly, they did not find an effect in several WTA studies. More recently, Maniadis, Tufano and List (2014) failed to replicate a different experiment from Ariely et al. (2003), the anchoring effect on WTA for unpleasant hedonic experiences, casting further doubt on the robustness of anchoring effects on valuations. The authors suggested that anchoring effects are simply not robust in valuation tasks. Additionally, the effect of anchoring on preferential judgments in field experiments, where real payments were made in natural settings, have also shown weak or null effects (Alevy et al., 2015; Jung et al., 2016). Fudenberg et al. (2012) did not provide a specific explanation for why they obtain such different results from Ariely et al. (2003), leaving open the possibility that it was due to differences in experimental protocol (in one study, they ruled out that the difference was due to whether participants were provided a thorough description of the BDM procedure, which did not change the non-significant anchoring effects). In particular, they used a different procedure for generating anchoring numbers, and differed in how they recruited participants.
While Ariely et al. (2003) used the last two digits of participants’ SSN as the anchoring numbers, Fudenberg et al. (2012) had participants actively generate random numbers from a computer (RN, hereafter). One possibility is that the perceived randomness or informativeness of an anchoring number influences people’s inferences about the anchoring number (Frederick, Mochon & Danilowitz, 2013; Glöckner & Englich, 2015). For example, Frederick et al. (2013) showed that anchoring effects were weaker when anchors were explicitly random (e.g., the first two digits of the serial numbers from receipts in their wallet) than when anchors were embedded in the questions, implying that inferences about the anchoring number can moderate the anchoring effect for general knowledge questions. The last two digits from receipts and the last two digits of SSN seem similarly random, leading to predictions of weak anchoring effects for SSN. However, previous related studies have shown that SSN could be perceived as informative. For example, in Chapman and Johnson (1999), 34% of participants in Experiment 3 and 15% of participants in Experiment 4 reported that they considered SSN to be informative. In addition, a recent study showed that SSN can be predicted based on personal information, such as place and date of birth (Acquisti & Gross, 2009); even the perception that information is embedded in a person’s SSN could cause inferences to be more prevalent than with randomly generated numbers, or self-relevant information could attract greater attention than randomly generated numbers (Humphreys & Sui, 2016; Turk et al., 2013), resulting in a stronger anchoring effect for SSN. Chapman and Johnson (1999) further tested whether the perceived informativeness of SSN moderates anchoring effects and found mixed results, with stronger anchoring effects for those who perceived SSN is informative in Experiment 4, but not in Experiment 3. Even though the results were inconclusive, the findings seem to suggest that perceived informativeness of anchoring numbers could moderate anchoring effects on WTP. More recently, Glöckner and Englich (2015) systematically investigated the effect of anchoring number relevance on anchoring effects. They provided informative anchors (e.g., judicial judgments from judges and prosecutors) and non-informative anchors (e.g., a lay-person’s judgment in another irrelevant criminal case) to participants and found that relevant anchors generated stronger anchoring effects than irrelevant anchors. Zhang and Schwarz (2013) also found that price estimates for a market good were affected more by precise anchors (e.g., $29.75) than rounded anchors (e.g., $30) only when the anchors were relevant to price estimation (e.g., a current price at a major retailor vs. a computer-generated price). Thus, the actively-generated random numbers may have been more transparently random to the Fudenberg et al. (2012) participants, resulting in no or weak anchoring effects. We test this possibility in our Study 1.
Table 1: Comparison of anchoring studies on valuation
Note: SSN denotes social security number, and RN denotes random number.
Separately, the inconsistent premise for participation and different participant populations in the previous valuation anchoring studies could be driving differences across studies. Ariely et al. (2003) conducted the experiment in an MBA classroom as a part of a class activity in which students expected to learn how to estimate demand curves using contingent valuation methods, but Fudenberg et al. (2012) recruited people from a participant email list and conducted the experiment in sessions dedicated to running the experiment in a laboratory. The classroom demonstration context may have provided enough of a “cover story” that participants were less likely to perceive the anchoring procedure as contrived or suspicious, as the Y/N response to fixed prices was presented as one way of measuring demand. In the lab study, participants may have been suspicious of the anchoring procedure occurring alongside the valuation task, and were thus more likely to discount the relevance of the anchor. Additionally, in Ariely et al. (2003), participants were all MBA students, whereas in Fudenberg et al. (2012), participants were from an email recruiting list, which could be a more diverse sample than the MBA students in Ariely et al. (2003). Thus, participants could have different levels of interests and background knowledge, resulting in inconsistent previous replication results. We tested whether the different premises for participation and samples moderate anchoring effects on WTP in two ways: in Study 1, the experiment was conducted in both a classroom context with business major students and in a lab study with students having different majors using email recruiting. In Study 2, the experiment was conducted in class, but the cover story was varied to frame the activity as a demonstration of either marketing research or academic research.
In addition to the differences in experimental procedures used in the previous studies, we investigated the moderating roles of knowledge from previous purchasing experience and repetition of an anchoring number (Study 3). Previous product valuation anchoring studies used a single anchoring number across multiple items. It is possible that repeating the same anchoring number multiple times increases people’s attention to the anchoring number, leading to significant anchoring effects on product valuation. In Study 3, participants were exposed to different anchors for different items. Separately, people might have experience purchasing similar items that could dilute the effect of an externally-given anchor in a valuation anchoring task. In Study 3, we vary whether we have participants think about their previous purchasing experiences for the same or similar items.
We also test the robustness of the anchoring effect on preferential judgments through a cross-study analysis (Study 4) that combines our data with data from prior studies. Of the prior studies, three used very similar procedures for WTP outcomes that should be considered direct replications (Ariely et al., 2003; Bergman et al., 2010; Fudenberg et al., 2012). As the differences in anchoring number generation method and premise for participation are confounded across the prior studies, the addition of data from our first two studies allows us to test and disentangle these factors. A summary of these studies is presented in Table 1.1 Among the studies, only Bergman et al. (2010)’s study was conducted in a country other than the United States (Sweden), and it also used a different currency (Swedish krona; $1 was around SEK 6 at the time the experiment was conducted). The other two studies were conducted in the United States and used dollars as the monetary unit. In the original study, the experiment was conducted in an MBA class and the BDM procedure was reconciled using participant’s own money. The experiment was introduced as a classroom demonstration. For the other two studies, however, undergraduate students were recruited, and they were endowed with money by the experimenter when resolving the BDM procedure. These studies were explicitly introduced as experiments. In Study 4, pooling data from our experiments and previous studies, we compared effect sizes across studies and further investigated the effect of different experimental procedures utilized in the previous studies. In addition to testing the moderating effect of the different experimental procedures, we also tested for the moderating effect of the range of anchor values relative to the distribution of valuations. Recently, Jung et al. (2016) showed that anchoring effect sizes were larger when the gap between anchor values was large in terms of valuation percentiles, indicating that anchoring effects are stronger when anchors are within a plausible range, and when anchors were not extremely low or high relative to typical valuations. Sugden et al. (2013) also showed non-significant anchoring effects when anchors were extreme in both WTA and WTP tasks.
Anchoring effects were initially explained by insufficient adjustment from the provided anchor. In the classic anchoring and adjustment mechanism, people start by considering the anchor and adjust until they find a plausible response (Tversky & Kahneman, 1974). When an anchor is well above the plausible range, people adjust their estimate all the way down to the upper boundary of the plausible range, whereas for a low anchor they adjust their estimate all the way up to the bottom boundary of the plausible range. Thus, based on the anchoring and adjustment account, in a WTP task, people may adjust their WTP from the given anchor until they reach to the upper or bottom boundary of their plausible WTP range.
A second explanation, the selective accessibility account, posits that people generate anchor consistent information when evaluating the anchor as a potential response, and the activated anchor consistent information influences the subsequent numeric judgments (Chapman & Johnson, 1999; Mussweiler & Strack, 1999; Strack & Mussweiler, 1997). For example, Mussweiler and Strack (2000) asked participants to estimate the average price of a German car with a high anchor or a low anchor (40,000 DM vs. 20,000 DM) followed by a lexical decision task. Participants showed faster response latencies for expensive car words (e.g., Mercedes, BMW) than inexpensive car words (e.g., Golf, VW) when the high anchor was provided, but the pattern was reversed when the low anchor was provided. Similarly, in making WTP decisions, participants may think about why the provided random anchor price could be a possible value of the given product, and the activated reasons and information could affect the subsequent WTP judgment.
Even though we do not mainly aim to test the different theories of anchoring, the moderators tested in our study may provide clues as to which processes drive valuation anchoring. For example, based on the anchoring and adjustment account, if the anchor is perceived as irrelevant to their WTP, it is easier for people to make large adjustments from the random anchor (p. 230, Bahník, Englich & Strack, 2017). Therefore, one may predict that if the anchor is perceived as irrelevant to the estimation task, anchoring effects will be weak. On the other hand, based on the selective accessibility account, people will activate anchor consistent information regardless of relevance between the anchor and the estimation task (p. 6, Glöckner & Englich, 2015), and thus anchoring effects would not be affected by perceived relevance of anchors. If the RN anchor and an academic experiment cover story weaken anchoring effects on WTP, it would lend support to the position that valuation anchoring tends to be driven by anchoring and adjustment rather than selective accessibility.
The anchoring literature has also shown that even when there is no externally provided anchor, people often use their previous knowledge as a self-generated anchor and adjust their estimate from the self-generated anchor (Epley & Gilovich, 2001, 2006). For example, when people estimate the freezing point of vodka, they might retrieve the freezing point of water and start to adjust their estimate from the self-generated anchor (Epley & Gilovich, 2001). In a WTP task, participants could retrieve their previous experience of purchasing a similar or the same product or the market price of the product in a retail or online store. The market goods used in the previous valuation anchoring studies (e.g., mouse, keyboard, art book, chocolates) are common market goods that many consumers have had exposure to, so the price information that they acquired from previous experience could serve as self-generated anchors, diluting the effect of an externally provided random anchor. If valuation anchoring is affected by self-generated anchors, we expect to observe weaker anchoring effects when participants are asked to consider their previous purchase experience in Study 3.
The anchoring and adjustment account and the selective accessibility account, however, may predict similar anchoring effects for anchors that have less overlap with the distribution of valuations (i.e., the range of anchors spans a smaller range of valuation percentiles). Based on both the anchoring and adjustment account and the selective accessibility account, if both low and high anchors are above or below the upper or lower boundaries, resulting in a small percentile gap between the anchors, we may not be able to observe significant anchoring effects. For example, if one has a plausible WTP range from $0 and $20, when $25 and $50 are provided as low and high anchors, the reported WTP may be $25 for both anchors based on the anchoring and adjustment account. Similarly, the selective accessibility account may generate similar WTP responses between the two anchor conditions, because both anchors act as high anchors, activating similar anchor consistent information. Thus, if we find stronger anchoring effects when the percentile gap between low and high anchors are larger relative to a plausible WTP response distribution, this will be compatible with both the anchoring and adjustment account and the selective accessibility account.
Our first study examined whether the different experimental procedures used in previous studies contributed to the inconsistency of their results. We used a 2 × 2 between subject design: recruiting method (classroom or email), and anchoring number types (SSN or RN anchoring). We were not necessarily predicting an interaction effect; rather, we were exploring whether one or both factors together could account for the differences in previous findings, through some combination of the mechanisms described above. A total of 116 university undergraduate students participated in our study, receiving class credit or $5 in exchange for their participation. Participants in the classroom condition (N = 66; SSN = 26 and RN = 40) were undergraduate students taking Marketing Research classes, while participants in the laboratory condition (N = 50; SSN = 22 and RN = 28) were recruited using a SONA system (https://www.sona-systems.com/), an electronic platform developed to recruit participants, rather than through the class, resulting in a sample with more diverse academic backgrounds. Participants were not asked to provide their demographic information.
Table 2: Average stated WTP (standard deviation) sorted by quintile, Pearson’s r, and rank-sum test result in Study 1.
a The number of responses in Art Book and Belgian Chocolates is 24 because of nonresponse. Note: Fudenberg et al. (2012) slightly changed the items used because of legal constraints (wine cannot be sold to people below 21 years old in the USA) and participant preferences (trackballs are not popular among current undergraduates). We substituted fancy and normal dinners for the fancy and normal wines, and used cordless mice instead of trackballs.
We conducted the experiment using an incentive compatible BDM mechanism. Before the experiment, participants were informed that they would have a chance to buy one of the six items based on their answers, and that if chosen they would be endowed with a certain amount of money. We used similar items to the original Ariely et al. (2003) study’s (cordless trackball, cordless keyboard, normal wine, fancy wine, art book, and chocolates), except that we substituted a cordless mouse for the trackball, and two different types of dinner coupon (normal and fancy dinner coupons) for the two wines (since we could not sell alcohol to the participants). Before seeing the items, participants were asked to write their random price anchor into the six boxes (anchor) on the answer sheet (Figure 1), and the same anchoring number was applied to all six items. In the SSN condition, the anchoring number was chosen by transforming the last two digits of the participant’s SSN into a dollar amount, and in the RN condition, random numbers were generated by drawing from a deck of 100 numbered cards with a range of 0 to 99. Then, we showed the six items and, for each item, asked participants for three responses in the following order: whether they want to buy the given items for the random dollar amount (Yes/No response), the highest price they are willing to pay, and their estimate of the item’s market price. After responding to all the questions, the winners (who were endowed with enough additional funds ($80 in this study) to cover the purchase of the items), item, and resolution method (e.g., based on the Yes/No or WTP response) were randomly decided by rolling dice. If the Yes/No response was randomly selected, a winner purchased the selected item at the anchor price and kept the change if their answer was Yes, whereas the winner just kept the whole endowment if their answer was No. If WTP response was randomly selected, a random price was selected from a 10 × 10 price matrix and was compared with the winner’s WTP for the selected item. If WTP was higher than the random price, the winner purchased the item at the random price and kept the change, whereas they did not purchase and kept the whole endowment if their WTP was smaller than the random price. All experimental materials and data are available online on the Open Science Framework (https://bit.ly/2U6ghbq).
We tested for the presence of anchoring effects using Pearson correlation coefficients, as used in previous studies (Ariely et al., 2003; Bergman et al., 2010; Fudenberg et al., 2012). As seen in Table 2, for the four similar items, excluding two dinner coupons, the correlation coefficients between anchoring number and WTP ranged from 0.12 to 0.29. The range of the correlation coefficients was from 0.32 to 0.52 in Ariely et al. (2003), and −0.04 to −0.01 in Fudenberg et al. (2012). Our results replicated the anchoring effect at a strength near the middle of the range for previous studies. We also examined the ratio of average WTP for participants in the highest quintile of anchoring numbers to those in the lowest quintile and compared the magnitudes with prior studies (Table 2). The range of this WTP ratio across items in our study was 1.26 to 1.81, which is also near the middle of prior studies (the ratio in Ariely et al. (2003)’s study was 2.16 to 3.46 and that in Fudenberg et al. (2012)’s study was 0.77 to 0.92).2
To investigate the effects of the different anchoring mechanisms and recruiting methods, we regressed the mean WTP response (across items, to account for correlation in responses within participant) of each participant on the anchoring values interacted with the experimental conditions (Table 3). The main effect of the anchoring number was statistically significant in all specifications. As the anchoring number increases by one unit, people’s WTP increases $0.19 (t = 5.38, p < .001, 95% CI = [0.12, 0.26]; Model 1 in Table 3). The main effects of the anchor type (t = −0.13, p = .898, 95% CI = [−9.09, 7.89]; Model 2 in Table 3) and recruiting method (t = −0.13, p = .896, 95% CI = [−8.63, 7.55]; Model 3 in Table 3) were not significant, nor were there significant interactions with the anchoring number (anchor type×anchor: t = −0.42, p = .675, 95% CI = [−0.18, 0.11]; recruit type×anchor: t = 1.21, p = .229, 95% CI = [−0.05, 0.22]). The null effects imply that the types of random anchor and recruitment method do not moderate anchoring effects on WTP.
Table 3: Regression analysis results for Study 1. (N = 116 for all models.)
(1) (2) (3) (4) 0.19*** 0.21*** 0.15** 0.16** (0.04) (0.05) (0.05) (0.06) Anchor Type -0.55 -0.24 (4.31) (5.71) Anchor × Anchor Type -0.03 -0.02 (0.07) (0.10) -0.54 -0.47 (4.13) (5.25) Anchor × Recruit Type 0.09 0.10 (0.07) (0.09) Anchor Type × Recruit Type -0.42 (8.65) Anchor × Anchor Type × Recruit Type -0.03 (0.15) 19.30*** 19.46*** 19.68*** 19.76*** (2.06) (2.59) (2.68) (3.34) ** p < .01, *** p < .001. Note: Standard errors are presented in the parentheses. Anchor Type is coded as 0 for RN and 1 for SSN, and Recruit Type is coded as 0 for classroom and 1 for email recruiting.
Our second experiment investigated the effect of two different cover stories on anchoring effects. In the original study (Ariely et al., 2003), the authors informed participants that they would learn how to construct demand curves using two different methods. Participants were informed that one is based on yes/no questions with different random prices and the other is based on directly eliciting WTP. In Fudenberg et al. (2012)’s study, however, it was more salient to participants that they were participating in an experiment, and the different expectations in this setting may have affected people’s tendency to make inferences about the random number (Frederick et al., 2013). In this study, we investigated whether differences in cover story contribute to inconsistent anchoring effects in product valuations.
We had two quasi-random groups in this study, to whom the procedure was described as either a class activity or an experiment. We conducted the study in two consecutive sessions of a Marketing Research class, with the first session assigned to the class activity condition and the second session assigned to the experiment condition. This order was randomly determined by tossing a coin. Participants in the classroom activity condition were informed that they would learn how to elicit demand information, while participants in the experiment group were informed that they would participate in an experiment. A total of 82 university undergraduate students participated in this study, and were randomly assigned to either the classroom activity condition (N = 44) or the experiment condition (N = 38). Both groups were taking the Marketing Research class with the same instructor and they were not asked to provide any demographic information.
Overall the procedure was identical to the RN-Classroom condition in Study 1, except we substituted a pair of headphones for the chocolates. Both groups were debriefed and shown how to generate demand curves using the data from Study 1.
We tested for the presence of anchoring effects using correlation coefficients as in Study 1. Four out of six items in Study 2 showed a significant correlation between anchoring number and WTP, with one additional item marginally significant (Table 4). To examine whether WTP in the fifth quintile is greater than that in the first quintile, we ran a rank-sum test, and found that four out of six items showed that WTP in the fifth quintile was significantly greater than that in the first quintile.3
Table 4: Average stated WTP (standard deviation) sorted by quintile, Pearson’s r, and rank-sum test result in Study 2.
To test for the moderating effect of the cover stories, we regressed the mean WTP of each participant on anchoring number, interacted with an indicator for cover story (0: class activity vs. 1: experiment). The regression results show that the main effect of the anchoring number was statistically significant (b = 0.23, SE = 0.09, t = 2.55, p = .013, 95% CI = [0.05, 0.41]), but the main effect of cover story (b = −0.41, SE = 6.87, t = −0.06, p = .952, 95% CI = [−14.09, 13.26]) and the interaction effect between anchoring number and cover story was not statistically significant (b = 0.03, SE = 0.13, t = 0.20, p = .846, 95% CI = [−0.24, 0.29]). This result provides further evidence for anchoring effects in product valuations, but varying the cover story provided to participants did not moderate the anchoring effect.
Studies 1 and 2 systematically tested whether procedural differences (anchor type, recruitment method, and cover story) in previous valuation anchoring studies contribute to the inconsistency in previous replication results. The findings showed that the effect of random anchoring number on WTP is robust to random number generation methods and the premise of the study, suggesting that the inconsistency in previous replications was not driven by the most conspicuous procedural differences.
Table 5: Anchors and summary statistics for the self-generated anchors in Study 3.
Anchors Self-Generated Anchors Low Middle High Low Middle High F(2, 101) p-value η2 Art Book $5 $10 $28 $20.53 (33.86) $18.0 (14.20) $25.6 (25.05) 0.81 .448 .02 Humidifier $5 $20 $36 $46.14 (25.18) $71.1 (67.03) $57.14 (50.62) 2.10 .127 .04 Bluetoot Keyboard $8 $20 $40 $45.30 (21.61) $45.94 (21.16) $51.93 (30.10) 0.79 .458 .02 Cordless Mouse $5 $15 $30 $23.21 (13.86) $29.86 (47.59) $24.94 (9.35) 0.50 .611 .01 Electric Toothbrush $10 $30 $70 $22.79 (18.50) $32.9 (26.59) $31.93 (30.67) 1.61 .204 .03 Vacuum Cleaner $10 $25 $63 $57.08 (42.57) $57.15 (41.53) $54.72 (30.52) 0.05 .955 .0009 Note: There was one missing responses for Art Book and Vacuum Cleaner.
Our first two studies investigated whether procedural differences accounted for differences in previously reported studies that used the same experimental paradigm. To continue probing the strength of the original study’s theoretical claims, we also considered whether other characteristics of the procedures used could account for the observed effects. Previous preference valuation anchoring replication studies and our first two experiments used one random number per subject, which was either the last two digits of their SSN or a single random number, and participants answered whether they want to buy each of the six items for that one random price. Participants were instructed to copy the number six times, before answering any questions about the items (Figure 1). Thus, the repeated processing of the same number might have increased attention towards the anchoring numbers and contributed to the anchoring effects by being easily retrieved from memory (rather than the evaluation of the anchor as a possible price). For example, Wilson, Houston, Etling and Brekke (1996) showed, using factual questions, that sufficient attention towards random numbers is a necessary condition for anchoring effects. In their experiment, participants who copied anchoring numbers five times showed stronger anchoring effects than those who copied the anchoring numbers once, and there was no difference in response between the no-anchor group and the group which copied the anchoring numbers once. However, Brewer and Chapman (2002) also showed the limitations of basic anchoring effects.
If the repetition of the anchoring number contributes to the large anchoring effects previously observed, it could be argued that the effect is driven by focusing attention towards the anchoring number, providing weaker evidence for the arbitrariness of preferences. We also note that, while this feature of the procedure did not vary across prior studies, the different participant populations and their respective experimental settings could have generated differences in attention to the anchoring number. In Study 3, we investigated whether the anchoring effect would be reduced by eliminating the repetition in anchoring numbers; participants in this study received a different anchoring number for each item.
We also tested for the possible moderating effect of self-generated anchors. In addition to incentive compatibility, another characteristic that distinguishes valuation tasks from other numeric judgment tasks might be the role of previous experience. Epley and Gilovich (2001) showed that participants could use a self-generated anchor when they are asked to estimate the answer to questions for which they have easily accessible standards of comparison. For example, when estimating the year George Washington was elected as president, they could use the information that the answer is later than the year the U.S. declared independence (self-generated anchor, in 1776), and adjust from the self-generated anchor. In valuation anchoring tasks, participants might use the information from their experience of purchasing the same item or items in the same item category. Thus, this self-generated anchor might dilute the effect of an externally provided anchor (Fudenberg et al., 2012). In Study 3, we tested whether considering prices at which they have purchased the same or similar items previously could impact the effect of random experimenter-given anchoring on WTP.
A total of 216 university undergraduate students were recruited for the experiment, receiving class credit for participation (mean age = 20.10 years old, SD = 0.15, female = 126). Before starting the task, participants were randomly assigned to either a self-generated anchor group (N = 114) or a control group (N = 102). Before starting the task, participants in the self-generated group (assigned at the experimental session level, so that procedures remained the same for all participants in a given session) were asked to think about any experience they may have had of purchasing the six items (or similar items), and were asked to state the amount they paid at that time, while those in the control group were not. The anchoring procedure was identical to that in the email recruiting-RN condition of Study 1, except that we replaced the dinner coupons and the chocolates with different consumer products (humidifier, electric toothbrush, and vacuum cleaner), and that participants selected different random numbers for each of the six items. The anchoring numbers were tested at discrete levels: each item had its own deck of 30 cards in which there were 10 low anchor, 10 middle anchor, and 10 high anchor cards. The low anchors were below the 10th-15th percentile, the middle anchors were at the 50th percentile, and the high anchors were at the 80th-95th percentile of WTP from one of our previous experiments (Table 5). Participants selected one card for each item from the corresponding deck and wrote the anchoring numbers in the answer sheet before seeing the items. The same incentive compatible procedures were used. At the end of the task, participants were asked to provide demographic information and complete two individual difference measures: need for cognition (NFC; Cacioppo & Petty, 1982) and the cognitive reflection test (CRT; Frederick, 2005).
Twenty-one participants selected anchoring numbers from the wrong decks, and one participant did not provide answers for the self-generated anchor questions, so we excluded these participants’ responses from the analysis.4 We also excluded four responses where WTP was missing. Before examining the effect of self-generated anchors, we checked whether the anchors affected the price information people used in the self-generated anchor condition. A one-way ANOVA for each item did not find any differences in self-generated anchors among the three anchor conditions (Table 5). Thus, it does not appear that participants in different anchor conditions used different self-generated anchors in the task.
For the analysis, we regressed WTP on the anchoring number interacted with the use of self-generated anchor (coded -1 for the no self-generated condition and 1 for the self-generated condition) with participants and items as random effects, treating the anchor as a continuous variable (anchors were mean centered for each item). The average anchoring effect is significant (b = 0.26, SE = 0.03, t = 8.25, p < .001, 95% CI = [0.19, 0.33]), with a magnitude slightly larger than in Study 1 (b = 0.19) and Study 2 (b = 0.23). However, neither the main effect of the use of self-generated anchor (b = 0.45, SE = 0.65, t = 0.69, p = .488, 95% CI = [−0.83, 1.74]) nor the interaction between anchor and the use of self-generated anchor (b = −0.03, SE = 0.03, t = −0.85, p = .396, 95% CI = [−0.09, 0.03]) were significant.5 Thus, we conclude that neither varying the anchoring number across items for a participant nor prompting participants to use previous experience or knowledge as self-generated anchors reduces or eliminates the anchoring effect.
We also examined individual differences in valuation anchoring. For the analysis, we regressed WTP on anchor interacted with CRT and NFC using a multilevel linear model with participants and items as random effects. Consistent with Bergman et al. (2010), there was no strong evidence that participants with a higher CRT score are less susceptible to anchoring in preferential judgments (anchor × CRT interaction effect: b = −0.02, SE = 0.03, t = −0.82, p = .414, 95% CI = [−0.08, 0.03]). Similarly, we did not find a significant moderating effect of NFC on the relationship between anchor and WTP (anchor × NFC interaction effect: b = 0.002, SE = 0.003, t = 0.67, p = .501, 95% CI = [−0.004, 0.008]).
Study 3 tested the idea that heightened attention to and salience of the anchoring number from repeated processing of a single anchor contributes to anchoring effects on WTP. Providing different anchors for each item, we still found significant anchoring effects on WTP, showing that anchoring effects on WTP do not require repeated processing of an anchor. We also tested whether increasing the salience of previous purchase experiences diluted the effect of anchoring on WTP, but we did not find strong evidence that retrieving previous purchase experience of a similar item moderated anchoring effects on WTP. This suggests that self-generated anchors (i.e., the amount of money they paid previously for the same or similar item) do not dilute externally provided random anchors in valuation anchoring tasks.
Table 6: A cross-study analysis result. (All models based on 447 participants, 2,680 observations.)
(1) Study Effect (2) Recruit Type (3) Anchor Type (4) Cover Story (5) Percentile Gap Anchor 0.229*** 0.204*** 0.226* 0.254*** 0.100+ (0.053) (0.048) (0.087) (0.047) (0.058) Ariely et al (2003) -0.011 0.058 -0.063 0.148 0.353 (0.280) (0.282) (0.290) (0.293) (0.210) Anchor × Ariely et al (2003) 0.123 0.148 0.126 0.147 0.195* (0.101) (0.091) (0.117) (0.120) (0.092) Bergman et al (2010) -0.011 -0.215 -0.063 -0.061 -0.120 (0.274) (0.285) (0.285) (0.277) (0.187) Anchor × Bergman et al (2010) 0.039 -0.037 0.042 0.013 0.019 (0.084) (0.097) (0.103) (0.071) (0.069) Fudenberg et al (2012) -0.011 -0.215 0.005 -0.061 0.454* (0.277) (0.287) (0.278) (0.279) (0.216) Anchor × Fudenberg et al (2012) -0.240* -0.315** -0.246** -0.266** -0.149+ (0.092) (0.104) (0.081) (0.081) (0.083) Recruit Type 0.274** (0.095) Anchor × Recruit Type 0.100 (0.093) Anchor Type -0.068 (0.097) Anchor × Anchor Type 0.009 (0.099) Cover Story -0.208* (0.102) Anchor × Cover Story -0.049 (0.102) Percentile Gap 0.014*** (0.003) Anchor × Percentile Gap 0.003** (0.001) Intercept 0.011 -0.058 0.063 0.061 -0.650** (0.185) (0.188) (0.100) (0.188) (0.192) + p < .10 * p < .05, ** p < .01, *** p < .001 Note: Standard errors are presented in the parentheses. Recruit type (0: classroom vs. 1: email recruiting), anchor type (0: SSN vs. 1: RN), and cover story (0: experiment vs. 1: class activity) are dummy coded.
Figure 2: WTP distribution of each item in Study 1. The blue line indicates $25 and the green line indicates $75.
Our previous three studies showed that the valuation anchoring effect is robust to variation in anchoring number type, recruiting method, cover story, repetition of the anchoring number, and the salience of previous purchasing experiences. In this section, we compare the effect sizes from multiple anchoring studies to test for differences across studies and test for factors that may help explain any such differences.
First, we pooled the data from the studies listed in Table 1 with the data from our Study 1 and Study 2, and ran a linear regression analysis. We ran a linear regression with participants and items as random effects, and the interaction between anchor and studies. We used dummy variables as indicators for each study, setting the data from our Study 1 and Study 2 as the baseline. Discrete anchors were used in Study 3, and the additional factor that we tested (the prompt to use a self-generated anchor) was unique to this study, so this factor could not explain differences across previous studies. Thus, we did not include Study 3 in this regression, but we do include Study 3 in a subsequent meta-analysis based on Z scores, to help characterize the distribution of effect sizes. Since one study was conducted using a different currency and the studies were conducted in different years and locations, we also standardized anchoring number and WTP within each study
The anchoring effect from our two studies is statistically significant (b = 0.23, SE = 0.05, t = 4.32, p < .001; Model 1 in Table 6), and there was no difference between our studies and Bergman et al. (2010)’s study (b = 0.04, SE = 0.08, t = 0.46, p = .646) and our studies and Ariely et al. (2003)’s study (b = 0.12, SE = 0.10, t = 1.22, p = .226). A further test result showed that the anchoring effect in Ariely et al. (2003)’s study was not significantly different from that in Bergman et al. (2010) (b = −0.08, SE = 0.11, t = −0.79, p = .434). Fudenberg et al. (2012)’s study showed a significantly smaller anchoring effect than our two experiments (b = −0.24, SE = 0.09, t = −2.62, p = .011), and the effect was not different from zero (b = −0.01, SE = 0.06, t = −0.19, p = .852). Further testing found that their effect was smaller than every other reported study (vs. Ariely et al.: b = 0.36, SE = 0.11, t = 3.19, p = .002; vs. Bergman et al.: b = 0.28, SE = 0.10, t = 2.82, p = .006). We also note that when analyzing each individual item for each experiment, Ariely et al. (2003) is the only study in which all items (six out of six) had a significant anchoring effect individually, and Fudenberg et al. (2012) is the only study in which none of the items had a significant effect. In all other experiments, one or two individual items had marginally significant or non-significant effects, which is not surprising for reasonably powered experiments.
We also examined whether the combined data could help identify factors that moderate the anchoring effect. We first retested whether the experimental procedures tested in our studies (recruit method, anchor type, and cover story) moderated the anchoring effect on WTP when incorporating additional studies that varied on these procedures. We did not find a significant interaction between the anchor and any of these procedural variables (Models 2, 3, and 4 in Table 6).
In an additional analysis, we examined whether the distributional gap between anchors moderated the inconsistent anchoring effects on WTP. In a recent paper, Jung et al. (2016) posited that the range of anchors used in the study might moderate anchoring effects on WTP. In a series of field experiments, the authors showed that the percentile rank gap between anchor values in the corresponding WTP distribution predicts significant anchoring effects on WTP. Intuitively, a large percentile rank gap means the anchor values span a wide range of the distribution of valuations, suggesting they also span a range of plausible prices, increasing the anchoring effect. Conversely, anchors that do not have a meaningful difference in WTP percentiles may have a weaker effect; for example, a ceiling effect where the provided anchor values are all well above participants’ WTP may not differ in their effect on responses, so no anchoring effect would be detected (as in Chapman & Johnson, 1994). Unlike Jung et al. (2016)’s studies, the anchoring studies introduced in this paper used continuous anchors, so we operationalize percentile rank gap using the interquartile range, the difference in percentiles corresponding to $25 and $75 within the WTP distribution for each item and study. For example, in Study 1, $25 ranks at the 91st percentile, whereas $75 ranks at the 99th percentile within the WTP distribution of chocolate. Thus, the percentile rank gap of the chocolate in Study 1 was 8 (Figure 2). For the Bluetooth keyboard in Study 1, $25 and $75 ranks at 24 and 91 percentiles in the WTP distribution, so the calculated percentile rank gap for this item was 67. The percentile gap of each study is summarized in Appendix A.
We regressed WTP on anchor interacted with the percentile rank gap and with participants and items as random effects. The result showed a significant interaction between anchor and the percentile rank gap (b = 0.003, SE = 0.001, t = 3.31, p = .001; Model 5 in Table 6), indicating that the anchoring effect on WTP was stronger when the percentile rank gap between utilized anchors was greater. We found a marginally significant main effect of anchoring on WTP (b = 0.10, SE = 0.06, t = 1.72, p = .085), and the main effect of the percentile rank gap of anchors was significant (b = 0.014, SE = 0.003, t = 4.52, p < .001). Finally, we note that comparing the coefficients for each study across models, it appears that the percentile rank gap could contribute a small amount to the difference between our results and Fudenberg et al. (2012). This finding indicates that the distribution of valuations relative to the range of anchors moderates the anchoring effect, but on its own does not account for the observed differences across studies.
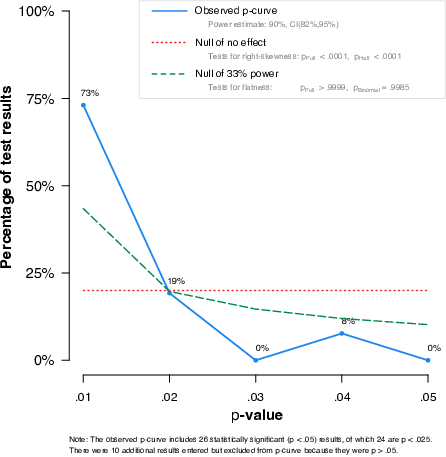
The cross-study analysis shows that anchoring studies consistently find an effect, with Fudenberg et al. (2012) providing the only exception. Our analysis does not rule out the potential effects of publication bias or other selective reporting. However, an inspection of the p-values across studies reveals a strong right skew that is inconsistent with selective reporting. A p-curve, as proposed by Simonsohn et al. (2014), is depicted in Figure 3 (top), and the visual pattern is quite clear. Related diagnostic tests indicated that the observed anchoring effects were not driven by publication bias or selective reporting: the observed p-curve was significantly right skewed (binomial test: p < .001), was not flatter than a null p-curve generated by tests with 33% power (binomial test: p > .99), and was not left skewed (which is one proxy of checking selective report; binomial test: p > .99). The average estimated statistical power was 90% (95% CI = [82%, 95%]). Additionally, a funnel plot indicated that the distribution of effect sizes was not indicative of selection bias (Figure 3 bottom).
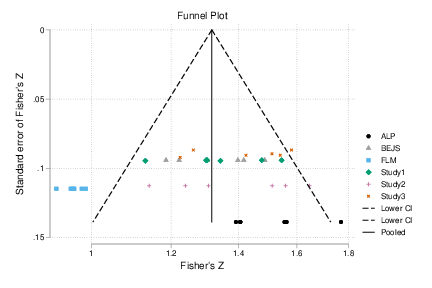
Figure 3: The results of a p-curve analysis (top) and funnel plot (bottom). P-values were from the Pearson correlation for each item in each study. Since discrete anchors were used in Study 3, p-values were from the main effect of anchor in the ANOVA results for each item. (Note: The observed p-curve includes 26 significant [p<.05] results, of which 24 are p<.025. 10 additional results were excluded because they were p>.05.) In the funnel plot, the effect sizes (Cohen’s d) for Study 3 was calculated based on the t-tests between low and high anchor conditions for each item and transformed to z scores.
We also conducted a meta-analysis using the correlation between WTP and anchoring numbers for each item in each study, and the correlations were converted to the Fisher’s Z scale for the analysis (Figure 4). Since Study 3 used discrete anchors, we transformed Cohen’s d calculated from a t-test for each item between low and high anchor conditions into Fisher’s Z scale. For the estimation, we used the metafor package in R software and estimated the average effect by using a multilevel random effect model to reflect possible dependence across six items within each study (Konstantopoulos, 2011; Viechtbauer, 2010). Consistent with the cross-study regression presented above, the meta-analysis showed that, for the 30 items from five studies, the effect of anchoring on WTP was significant (average Fisher’s Z = 0.27, SE = 0.06, z = 4.23, p < .001, transformed r = .27). This analysis further highlights the robustness of the anchoring effect on WTP, while also showing how the effect varies across items and studies.
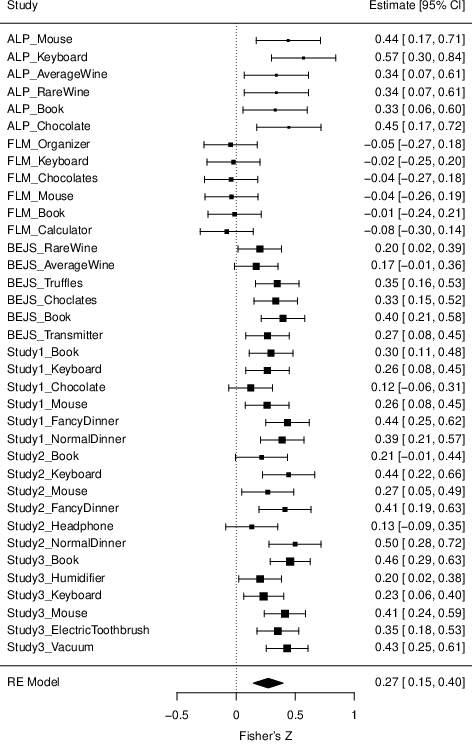
Figure 4: A meta-analysis result (mean and 95% confidence interval of Fisher’s Z are in the right end of the figure). ALP = Ariely et al. (2003), FLM = Fudenberg et al. (2012), and BEJS = Bergman et al. (2010).
To summarize the findings of our cross-study analysis, the differences between studies appear to be too large to attribute to chance, though from our Study 1 and Study 2, the observed procedural differences do not account for the gaps. The average effects are smaller than in the original Ariely et al. (2003), but still of an economically meaningful magnitude: an unstandardized regression estimated an average marginal effect where a change of one unit in the anchoring number changed WTP by 0.23 in the corresponding currency. The distribution of the test statistics across studies suggests that, by and large, the studies were sufficiently powered, with no indication of selective reporting. We conclude that the smaller effects typically observed (relative to the original study) are not so small that they invalidate the main theoretical point in Ariely et al. (2003) that preferences can exhibit substantial arbitrariness. Additionally, the meta-analysis confirmed a significant anchoring effect on WTP, and even though a recent study has shown that a p-curve can be right skewed with a gradual publication bias (Ulrich & Miller, 2018), the p-curve analysis and the funnel plot indicate that publication bias is unlikely to account for the observed effect sizes.
Study 4 compared effect sizes across valuation anchoring studies and tested potential moderators of valuation anchoring by pooling the data from previous and current valuation anchoring studies. We found that the anchoring effect in Fudenberg et al. (2012) was smaller than the other valuation anchoring studies, but the average effect across all studies was positive and significant. Consistent with Study 1 and Study 2, we did not find significant moderating effects of different anchor generation methods, recruitment, and cover story on anchoring effects on WTP from the pooled data, but found that percentile gaps between anchors significantly moderated anchoring effects on WTP. Fudenberg et al. (2012) had the smallest average percentile gaps between anchors; thus, the relatively small percentile gaps could partly account for the weak anchoring effects.
In this paper, we examined the robustness of anchoring effects in preferential judgments. While the anchoring effect has been shown to be robust in other types of numeric judgment tasks (e.g., general knowledge), and a recent Many Labs project showed stronger effects than those of the original study (Klein et al., 2014), the anchoring effect in valuation tasks has been shown to be inconsistent (Bergman et al., 2010; Fudenberg et al., 2012; Maniadis et al., 2014). Valuation tasks are distinctive in that (1) the best responses are subjective to each participant, (2) tasks are incentive compatible (Camerer et al., 2016), and (3) participants’ existing preferences can play an important role (Fudenberg et al., 2012). Thus, the finding that task irrelevant random anchors influence people’s WTP has been thought to be strong evidence showing preference construction (Lichtenstein & Slovic, 2006; Slovic, 1995).
Despite its theoretical importance and distinctive characteristics, the replicability of anchoring on preferential judgments has not been thoroughly and systematically evaluated. We conducted a thorough examination of the robustness of anchoring effects on preferences as measured by WTP. Our results more closely resembled the original results in Ariely et al. (2003) than the null results in Fudenberg et al. (2012), although the effects we observed appeared to be lower in magnitude than those of the original study. Our cross-study analysis showed that Ariely et al. (2003)’s study and Bergman et al. (2010)’s study produced similar effects to our study, whereas Fudenberg et al. (2012)’s study produced a significantly smaller one. These differences are larger than would be expected from sampling variation across identical experiments, implying that other factors differed across these studies. We also tested the interactions between the anchoring number and several procedural factors and found null effects, implying that different experimental procedures are unlikely to explain the differences between prior results.
In addition to testing procedural differences, we also examined whether other mechanisms could explain valuation anchoring in Study 3. We found that varying the anchoring number within participant, reducing the repetitiveness of the anchor, did not reduce the strength of the anchoring effect. Additionally, we tested whether self-generated anchors (e.g., the amount participants previously spent on the items, or the prices they saw in stores) dilute the effect of externally-given anchor on WTP. We found that anchoring can influence WTP even when people have considered possible prices before the anchor is given. Based on all three experiments and the cross-study analysis, we conclude that anchoring effects on preferential judgments are replicable and robust to a variety of procedural variations.
Although our studies did not directly test the underlying mechanisms of anchoring on preferential judgments, the results add to the ongoing theoretical discussion about anchoring efforts. In particular, the moderating effect of the percentile rank gap between anchors favors theories of anchoring where the distribution of participants’ valuations must overlap with the range of anchor values used. The classic anchoring and adjustment mechanism, where participants start by considering the anchor and adjust until they find an acceptable response (Tversky & Kahneman, 1974) has this feature: an anchor well above the plausible range would get adjusted all the way down to the plausible range just as a lower anchor would. The selective accessibility account of anchoring also has this feature. Under selective accessibility, people generate anchor consistent information when evaluating the anchor as a potential response (Chapman & Johnson, 1999). Participants might generate anchor-consistent information and utilize the information when the anchors vary within a plausible range, whereas they ignore the anchors or generate similar information for anchors that are too extreme relative to the distribution of valuations. Thus, the percentile rank gap of anchors could moderate anchoring effects on preferential judgments.
In contrast, other theories do not rely as much on overlap in the distributions of valuations and anchors. The basic anchoring effect where attention to the anchoring number can be responsible for the effect (Wilson et al., 1996) has already been shown to be fragile (Brewer & Chapman, 2002), and is inconsistent with our results, especially Study 3. A more recent theory, the scale distortion theory of anchoring, posits that anchors affect the mapping of judgments to the response scale without necessarily causing representational changes of the target items (Frederick & Mochon, 2012). Thus, anchoring effects would not rely on the overlap of anchors and valuations as much as the range of the anchors themselves, which was identical (0 through 99) in the studies we analyzed. While scale distortion has been shown to play an important role in general knowledge anchoring, and could still have some role in valuation anchoring, our findings suggest that scale distortion is not the primary mechanism for valuation anchoring.
We focused on WTP, because we aimed to reconcile inconsistent direct replication attempts for WTP, WTP tasks are more familiar than WTA decisions, and WTP seems to represent consumer preferences better than WTA. However, the literature on valuation anchoring has also examined anchoring effects on WTA, with findings that suggest anchoring effects on WTA and WTP differ. For example, Fudenberg et al. (2012) showed insignificant anchoring effects both on WTA and WTP but found higher first and last quintile ratio for WTA than for WTP. Sugden et al. (2013) more directly compared anchoring effects on WTA and WTP for market goods using a series of binary choice tasks, and found stronger anchoring effects on WTA than on WTP. Thus, future research may be needed to systematically investigate the difference in anchoring effects between WTA and WTP.
Acquisti, A., & Gross, R. (2009). Predicting Social Security numbers from public data. Proceedings of the National Academy of Sciences, 106(27), 10975–10980.
Alevy, J. E., Landry, C. E., & List, J. A. (2015). Field experiments on the anchoring of economic valuations. Economic Inquiry, 53(3), 1522–1538.
Ariely, D., Loewenstein, G., & Prelec, D. (2003). “Coherent arbitrariness”: Stable demand curves without stable preferences. Quarterly Journal of Economics, 118(1), 73–105.
Bahník, Š., Englich, B., & Strack, F. (2017). Anchoring effect. In R. Pohl (Ed.), Cognitive illusions: Intriguing phenomena in thinking, judgment, and memory (2nd ed., pp. 223–241). London, UK: Routledge.
Becker, G. M., DeGroot, M. H., & Marschak, J. (1964). Measuring utility by a single-response sequential method. Behavioral Science, 9(3), 226–232.
Bergman, O., Ellingsen, T., Johannesson, M., & Svensson, C. (2010). Anchoring and cognitive ability. Economics Letters, 107(1), 66–68.
Brewer, N. T., & Chapman, G. B. (2002). The fragile basic anchoring effect. Journal of Behavioral Decision Making, 15(1), 65–77.
Cacioppo, J. T., & Petty, R. E. (1982). The need for cognition. Journal of Personality and Social Psychology, 42(1), 116–131.
Camerer, C. F., Dreber, A., Forsell, E., Ho, T.-H., Huber, J., Johannesson, M., . . . Wu, H. (2016). Evaluating replicability of laboratory experiments in economics. Science, 351(6280), 1433–1436.
Chapman, G. B., & Johnson, E. J. (1994). The limits of anchoring. Journal of Behavioral Decision Making, 7(4), 223–242.
Chapman, G. B., & Johnson, E. J. (1999). Anchoring, activation, and the construction of values. Organizational Behavior and Human Decision Processes, 79(2), 115–153.
Englich, B. (2008). When knowledge matters—differential effects of available knowledge in standard and basic anchoring tasks. European Journal of Social Psychology, 38(5), 896–904.
Epley, N., & Gilovich, T. (2001). Putting adjustment back in the anchoring and adjustment heuristic: Differential processing of self-generated and experimenter-provided anchors. Psychological Science, 12(5), 391–396.
Epley, N., & Gilovich, T. (2005). When effortful thinking influences judgmental anchoring: differential effects of forewarning and incentives on self-generated and externally provided anchors. Journal of Behavioral Decision Making, 18(3), 199–212.
Epley, N., & Gilovich, T. (2006). The anchoring-and-adjustment heuristic: Why the adjustments are insufficient. Psychological Science, 17(4), 311–318.
Flachaire, E., & Hollard, G. (2006). Controlling starting-point bias in double-bounded contingent valuation surveys. Land Economics, 82(1), 103–111.
Frederick, S. (2005). Cognitive reflection and decision making. The Journal of Economic Perspectives, 19(4), 25–42.
Frederick, S., & Mochon, D. (2012). A scale distortion theory of anchoring. Journal of Experimental Psychology: General, 141(1), 124–133.
Frederick, S., Mochon, D., & Danilowitz, J. (2013). The role of inference in anchoring effects. Unpublished manuscript.
Fudenberg, D., Levine, D. K., & Maniadis, Z. (2012). On the robustness of anchoring effects in WTP and WTA experiments. American Economic Journal: Microeconomics, 4(2), 131–145.
Galinsky, A. D., & Mussweiler, T. (2001). First offers as anchors: the role of perspective-taking and negotiator focus. Journal of Personality and Social Psychology, 81(4), 657–669.
Glöckner, A., & Englich, B. (2015). When relevance matters. Social Psychology, 46, 4–12.
Green, D., Jacowitz, K. E., Kahneman, D., & McFadden, D. (1998). Referendum contingent valuation, anchoring, and willingness to pay for public goods. Resource and Energy Economics, 20(2), 85–116.
Humphreys, G. W., & Sui, J. (2016). Attentional control and the self: the Self-Attention Network (SAN). Cognitive Neuroscience, 7(1–4), 5–17.
Jacowitz, K. E., & Kahneman, D. (1995). Measures of anchoring in estimation tasks. Personality and Social Psychology Bulletin, 21(11), 1161–1166.
Johnson, E. J., & Schkade, D. A. (1989). Bias in utility assessments: Further evidence and explanations. Management Science, 35(4), 406–424.
Jung, M. H., Perfecto, H., & Nelson, L. D. (2016). Anchoring in payment: Evaluating a judgmental heuristic in field experimental settings. Journal of Marketing Research, 53(3), 354–368.
Klein, R. A., Ratliff, K. A., Vianello, M., Jr., R. B. A., Bahník, Š., Bernstein, M. J., . . . Nosek, B. A. (2014). Investigating Variation in Replicability. Social Psychology, 45(3), 142–152.
Konstantopoulos, S. (2011). Fixed effects and variance components estimation in three-level meta-analysis. Research Synthesis Methods, 2(1), 61–76.
LeBoeuf, R. A., & Shafir, E. (2006). The long and short of it: Physical anchoring effects. Journal of Behavioral Decision Making, 19(4), 393–406.
LeBoeuf, R. A., & Shafir, E. (2009). Anchoring on the" here” and” now” in time and distance judgments. Journal of Experimental Psychology: Learning, Memory, and Cognition, 35(1), 81–93.
Lichtenstein, S., & Slovic, P. (2006). The construction of preference: Cambridge University Press.
Loschelder, D. D., Trötschel, R., Swaab, R. I., Friese, M., & Galinsky, A. D. (2016). The information-anchoring model of first offers: When moving first helps versus hurts negotiators. Journal of Applied Psychology, 101(7), 995–1012.
Ma, Q., Li, D., Shen, Q., & Qiu, W. (2015). Anchors as semantic primes in value construction: an EEG study of the anchoring effect. PloS one, 10(10), e0139954.
Maniadis, Z., Tufano, F., & List, J. A. (2014). One swallow doesn’t make a summer: New evidence on anchoring effects. The American Economic Review, 104(1), 277–290.
Mussweiler, T. (2001). Sentencing Under Uncertainty: Anchoring Effects in the Courtroom1. Journal of Applied Social Psychology, 31(7), 1535–1551.
Mussweiler, T., & Englich, B. (2005). Subliminal anchoring: Judgmental consequences and underlying mechanisms. Organizational Behavior and Human Decision Processes, 98(2), 133–143.
Mussweiler, T., & Strack, F. (1999). Hypothesis-consistent testing and semantic priming in the anchoring paradigm: A selective accessibility model. Journal of Experimental Social Psychology, 35(2), 136–164.
Mussweiler, T., & Strack, F. (2000). The use of category and exemplar knowledge in the solution of anchoring tasks. Journal of Personality and Social Psychology, 78(6), 1038–1052.
Northcraft, G. B., & Neale, M. A. (1987). Experts, amateurs, and real estate: An anchoring-and-adjustment perspective on property pricing decisions. Organizational Behavior and Human Decision Processes, 39(1), 84–97.
Simmons, J. P., LeBoeuf, R. A., & Nelson, L. D. (2010). The effect of accuracy motivation on anchoring and adjustment: Do people adjust from provided anchors? Journal of Personality and Social Psychology, 99(6), 917–932.
Simonsohn, U., Nelson, L. D., & Simmons, J. P. (2014). P-curve: A key to the file-drawer. Journal of Experimental Psychology: General, 143(2), 534–547.
Simonson, I., & Drolet, A. (2004). Anchoring effects on consumers’ willingness-to-pay and willingness-to-accept. Journal of Consumer Research, 31(3), 681–690.
Slovic, P. (1995). The construction of preference. American Psychologist, 50(5), 364–371.
Smith, A. R., & Windschitl, P. D. (2011). Biased calculations: Numeric anchors influence answers to math equations. Judgment and Decision Making, 6(1), 139–146.
Strack, F., & Mussweiler, T. (1997). Explaining the enigmatic anchoring effect: mechanisms of selective accessibility. Journal of Personality and Social Psychology, 73(3), 437–446.
Sugden, R., Zheng, J., & Zizzo, D. J. (2013). Not all anchors are created equal. Journal of Economic Psychology, 39, 21–31.
Thorsteinson, T. J. (2011). Initiating Salary Discussions With an Extreme Request: Anchoring Effects on Initial Salary Offers1. Journal of Applied Social Psychology, 41(7), 1774–1792.
Thorsteinson, T. J., Breier, J., Atwell, A., Hamilton, C., & Privette, M. (2008). Anchoring effects on performance judgments. Organizational Behavior and Human Decision Processes, 107(1), 29–40.
Turk, D. J., Brady-Van den Bos, M., Collard, P., Gillespie-Smith, K., Conway, M. A., & Cunningham, S. J. (2013). Divided attention selectively impairs memory for self-relevant information. Memory & Cognition, 41(4), 503–510.
Tversky, A., & Kahneman, D. (1974). Judgment under uncertainty: Heuristics and biases. Science, 185(4157), 1124–1131.
Ulrich, R., & Miller, J. (2018). Some Properties of p-Curves, With an Application to Gradual Publication Bias. Psychological Methods, 23(3), 546–560.
Van Exel, N., Brouwer, W. B., van den Berg, B., & Koopmanschap, M. A. (2006). With a little help from an anchor: discussion and evidence of anchoring effects in contingent valuation. The Journal of Socio-Economics, 35(5), 836–853.
Viechtbauer, W. (2010). Conducting meta-analyses in R with the metafor package. Journal of Statistical Software, 36(3), 1–48.
Wansink, B., Kent, R. J., & Hoch, S. J. (1998). An anchoring and adjustment model of purchase quantity decisions. Journal of Marketing Research, 35(1), 71–81.
Wegener, D. T., Petty, R. E., Blankenship, K. L., & Detweiler-Bedell, B. (2010). Elaboration and numerical anchoring: Implications of attitude theories for consumer judgment and decision making. Journal of Consumer Psychology, 20(1), 5–16.
Wilson, T. D., Houston, C. E., Etling, K. M., & Brekke, N. (1996). A new look at anchoring effects: basic anchoring and its antecedents. Journal of Experimental Psychology: General, 125(4), 387–402.
Zhang, Y. C., & Schwarz, N. (2013). The power of precise numbers: A conversational logic analysis. Journal of Experimental Social Psychology, 49(5), 944–946.
Appendix A. Summary statistics of percentile rank gap by studies in Study 4.
Average SD Maximum Minimum 43.84 24.83 71.74 8.33 55.40 21.46 74.07 20.06 43.27 29.89 70.31 6.87 20.91 11.88 38.89 7.41 54.28 10.25 65.22 40.22 13.82 16.81 44.16 0 Note: SD indicates standard deviation. Maximum (Minimum) indicates the highest (Lowest) percentile rank gap among the items used in each study.
Copyright: © 2019. The authors license this article under the terms of the Creative Commons Attribution 3.0 License.
This document was translated from LATEX by HEVEA.