Judgment and Decision Making, Vol. 15, No. 2, March 2020, pp. 246-253
Preferences for rank in competition: Is first-place seeking stronger than last-place aversion?
Steven M. Shechter*
David J. Hardisty#
|
The use of gamification to motivate engagement has greatly increased the
number of ways in which people compete. Many of these competitions allow
individuals to see how they rank as a competition progresses. Our work
aims to provide a better understanding of how individuals feel about
different rank outcomes in competitions. We do this by applying the
principles of expected utility theory to elicit utility curves for over
3,000 people across three studies using hypothetical competition
scenarios. We find consistent support for the following generalizations:
1) individuals are risk-seeking when in second place, 2) they are
risk-averse when in second-to-last place, and 3) the utility decrease
going from first to second place is greater than their decrease going from
second-to-last to last place. Our results suggest individuals are both
last-place averse and first-place seeking, with an even stronger
inclination towards the latter.
Keywords: rank, competition, social comparisons, expected utility theory, prospect theory, winner effect
1 Introduction
The rise of gamification has increased the number and variety of ways in
which people compete. In leisurely pursuits, people try outranking each
other on leaderboards showing most visits to a restaurant, most steps
taken in a week, or highest score in a video game. Professionally,
individuals compete for prize money and jobs through innovation
competitions, and charitable organizations compete for awards through
fund-raising contests. However, there is scant literature that provides
insight regarding how individuals feel about different rank outcomes in a
competition. Using methodological tools from expected utility theory (EUT)
(von Neumann & Morgenstern, 1947), we elicit rank utility curves of over
3,000 individuals, which reveal several interesting insights regarding
rank preferences.
Our work relates to the social psychology literature on social comparisons
and competitive behavior (Buunk & Gibbons, 2007; Festinger, 1954; Garcia,
Tor & Schiff, 2013; Ku, Malhotra & Murnighan, 2005; Malhotra, 2010).
Of particular relevance, Garcia, Tor & Gonzalez (2006) explored the
effect of specific rank feedback as a modifier of competitive drive. Based
on choices involving hypothetical outcomes (e.g., profits or grades) for
oneself and one’s rival, individuals exhibited substantially more
competitive behavior against a rival when they both ranked consecutively
near the top or bottom of a list, compared to when they ranked
consecutively at an intermediate ranking. This suggests that individuals
are both first-place seeking (FPS) and last-place averse (LPA).
As discussed more below, our analysis of individuals’ utilities for
different ranks in a hypothetical competition provides consistent support
for the following generalizations: 1) individuals are risk-seeking when in
second place, 2) they are risk-averse when in second-to-last place, and 3)
their utility decrease going from first to second place is greater than
the decrease going from second-to-last to last place. The first two
findings also support FPS and LPA behavior, respectively. The third
finding suggests that individuals exhibit an even stronger drive to be FPS
compared to LPA.
Kuziemko et al. (2014) also studied individuals’ risk preferences as a
function of their rank in social comparisons. They randomly assigned
individuals to groups of six, with each individual in a group randomly
endowed with some amount of money. Everyone knew each other’s amount, and
therefore, rank. Participants were then asked to choose between a certain
monetary gain, which would leave their wealth rank unchanged, or a gamble
with the same expected monetary gain, but for which winning increased, and
losing decreased, their rank. Their various analyses established robust
statistical support for the hypothesis of LPA; individuals in last place
chose the gamble a significantly higher proportion of the time than other
ranks. Moreover, the authors found no evidence of FPS;
individuals ranked 1 and 2 chose the gamble at a similar rate as those
ranked 3–5. A possible reason for the lack of FPS in their study is that
rank outcomes were randomly endowed and not the result of an effort-based
contest. As first suggested by Allport (1924) and explored further in Ku,
Malhotra and Murnighan (2005) and Malhotra (2010), rivalry and features
of a competition may enhance one’s desire to win. Ranking near the top of
a contest may engender a “competitive arousal” (Ku et al., 2005) not
experienced when ranking near the top of other forms of social comparison
(e.g., endowed wealth).
Our study also has connections to the work of Medvec, Madey, and Gilovich
(1995), which demonstrated that bronze medalists in Olympic events were
generally happier than silver medalists. The authors explained this
through counterfactual thinking, in which silver medalists were
disappointed that they missed out on a gold medal, while bronze medalists
were happy that they finished in the top three and received any medal.
Counterfactual thinking may also help explain some of our findings, which
we discuss further in the final section. However, Medvec and colleagues
(1995) did not examine last-place aversion and did not compare first place
seeking with last place aversion, which is the focus of our investigation.
We note that our consideration of rank-dependent utility is distinct from
the formal body of work on “Rank-Dependent Utility” (RDU; see, for
example, Diecidue and Wakker, 2001; Quiggin, 1982; Schmeidler, 1989;
Tversky and Kahneman, 1992; Yaari, 1987). Our motivation is to explore
whether rank-ordered outcomes in competitive settings are in and of
themselves carriers of utility and if so, what insights come from the
shape of the utility curves. The motivation for RDU was to fix stochastic
dominance violations arising from nonlinear probability weighting
functions, in which the weights of the set of outcomes did not sum to 1
(e.g., the overweighting of small probabilities and underweighting of
large probabilities from original Prospect Theory [Kahneman and Tversky,
1979]). Quiggin (1982) resolved this issue by requiring that the sum of
probability weights equal 1, from which he showed that the weighting
function depends on both the probabilities of the individual outcomes as
well as their ranked order. This, in turn, led to the updated version of
Prospect Theory, known as Cumulative Prospect Theory (Tversky and
Kahneman, 1992). The lotteries examined in RDU typically involved
uncertainty in financial rewards or costs, and did not have any aspect of
social comparison. Therefore, there was no reason to consider the ranks of
outcomes as directly affecting utilities in those settings. In our study,
there are no financial outcomes; one’s rank in a contest is the only
outcome that may provide satisfaction or lack thereof. As such, our topic
of study is essentially orthogonal to previous work on Rank Dependent
Utility.
2 Hypothesis Development
The Methods section describes how we constructed individuals’ utilities for
different rank outcomes in a competition. With utility curves in place, we
examined their implications for rank preferences. As described below, we
told participants that their identity would remain anonymous and that the
competition would not award prizes. One might posit that someone will not
care about such a competition. However, millions of people engage in
competitive online video games using anonymous user names, with their
scores shown on leaderboards, and only pride at stake. The literature on
the psychology of competition (noted above) suggests that many individuals
in these types of competitions would still have a clear preference to rank
higher than lower. This forms our first hypothesis below. Before stating
the hypothesis, we make a few comments. Because we anchored the utility of
first and last place to 1 and 0, respectively, Hypothesis 1 focuses on
individuals’ utility values between second and second-to-last place
(inclusive). These utilities can, in principle, take on any values between
0 and 1, and nothing in our elicitation method forces any pattern to hold.
| Table 1: Summary of different studies. The “number of contestants per group”
indicates the group sizes in which treatment participants were to imagine
they were participating. “Avg comp” (male and female) indicates a
self-rated competitiveness level, on a scale of 1 (not at all competitive)
to 7 (very competitive). |
Study | Participant pool | Number of contestants per group | Sample size | % male | Avg age | Avg male comp | Avg female comp |
1 | MTurk | 6 | 1960 | 52 | 35 | 5.0 | 4.4 |
2 | MTurk | 6 | 1001 | 49 | 36 | 5.0 | 4.5 |
3 | Undergrad. students | 10 | 423 | 36 | 21 | 5.7 | 5.2 |
Hypothesis 1:
Individuals’ utilities increase as rank increases
from second-to-last place to second place.
The shape of utility curves also tells us how individuals feel about risk.
A concave utility curve over monetary outcomes is associated with
risk-aversion, while a convex utility curve is associated with
risk-seeking. For example, someone with a concave utility function would
prefer $5 for sure over a 50–50 chance of winning $0 or $10;
conversely, someone with a convex utility function would prefer the 50-50
gamble. However, care is needed when discussing risk preferences,
concavity, and convexity for categorical data (e.g., rank outcomes).
Although rank is categorical, it is also ordinal, and therefore one can
apply the axioms and conclusions of EUT. In particular, one can define a
real-valued, utility function over the discrete ranks. While continuous
derivatives do not apply in this case, we shall say that the utility
function is discretely concave at rank m if
U(m+1) − U(m) < U(m) − U(m−1) (and is discretely convex at rank m if the
inequality > holds instead). If discrete concavity holds at rank m, one
can say that the individual prefers to finish in rank m for certain
rather than take a 50–50 chance of finishing in rank m−1 or rank
m+1. However, the usual notion of a risk-averse individual preferring the
expected value of a lottery for certain, rather than receiving the lottery
itself, no longer makes sense for this setting (i.e., we would not say that
rank m is the expected value of the 50–50 chance of finishing in rank m−1
or rank m+1). A transformation is first required to map the ranks to
real-valued numbers (i.e., associate random variables with the ranks), and
the utility curve over this transformed variable may or may not retain a
shape similar to a utility curve plotted over equally-spaced ranks. This
caveat should be kept in mind when we take the latter approach to plotting
utilities.
Given the salience of first and last place, we expected that individuals
would be willing to take on risk to attain first place if they were close
to first (i.e., they are first-place seeking), and that they would avoid
risk that could land them in last place if they were near last (i.e., they
are last-place averse). This conforms to what Prospect Theory (Kahneman &
Tversky, 1979) would predict if individuals in second place view first
place as their reference point; they would view their second-place rank as
in the domain of losses and therefore be risk-seeking (Schoenberg &
Haruvy, 2012). Conversely, individuals in second-to-last place may view
last place as their reference point, feel like they are in the domain of
gains, and therefore be risk-averse. We take this perspective and
hypothesize the following:
Hypothesis 2:
a) Individuals are risk-seeking when in second place,
and b) risk-averse when in second-to-last place.
Our next set of hypotheses compare the relative strength of FPS and LPA
preferences. While individuals may want to attain first place and avoid
last place, does one of these drives appear more prominent than the other?
As noted above, Prospect Theory predicts that individuals are risk-averse
over gains and risk-seeking over losses. Another key aspect of Prospect
Theory is “loss aversion,” whereby the disutility of losing some amount is
greater in magnitude than the positive utility one feels when gaining the
same amount. Again, assuming that someone in second place thinks of first
place as a reference point, and someone in second-to-last place thinks of
last place as a reference point, we predict that FPS will be a stronger
force than LPA. This forms the basis of the next two hypotheses, with the
first one comparing Hypothesis 2, parts a and b.
Hypothesis 3:
More individuals are risk-seeking in second place
than risk-averse in second-to-last place.
In other words, while Hypothesis 2 suggests that a majority of people are
both FPS and LPA, Hypothesis 3 predicts that even more people are FPS.
Our next hypothesis compares the magnitude of the utility change between
first and second place, with the magnitude of the utility change between
second-to-last and last place. Viewing second place as a loss of one rank
from first place, and second-to-last place as a gain of one rank from last
place, in accordance with loss aversion, we predict:
Hypothesis 4:
Individuals experience a greater decrease in
utility from first to second place, compared to the gain in utility from
last to second-to-last place.
3 Methods
We ran multiple, independent, large-sample versions of our study to ensure
robustness and replicability (Table 1). Studies 1 and 2 were run with
MTurk participants, while Study 3 was run with a student population. As a
rule-of-thumb, we wanted to have at least 50 observations per cell of our
2x2x2 full factorial design, which would mean having around 400
participants. For the MTurk studies, we could easily go well beyond this
quantity, so we did that (Studies 1 and 2 had 1960 and 1001 participants,
respectively). Study 3 was run with a student population, for which we
obtained as many participants as we could, and this was close to 400. As
demonstrated later in Figure 1, the confidence intervals around our point
estimates are tight enough to separate out signals from noise. Data
cleaning steps of the MTurk studies involved removing duplicates of any IP
addresses (2% of Study 1, and 1% of Study 2, respondents were removed
for this reason).
Each study involved a hypothetical contest in which the participant
competed against other people to either 1) take the most steps (the
“athletic” frame) or 2) solve the most puzzles (the “intelligence” frame)
over a period of time. For example, participants in a hypothetical
athletic contest among six people read1:
Suppose you and five other people of similar fitness level (either gender)
are matched up in a competition to see who takes the most steps over the
next month (from a combination of walking, running, and stairs). Imagine
that there are no prizes given out in this competition, and that rankings
and performance would be displayed through an anonymized leaderboard
(i.e., you will not know the identity of anyone else in your competition
group, nor will anyone else in your group know your identity; however, you
will know which rank is yours).The following questions are designed to assess your preference between
using a strategy that would guarantee a certain outcome (e.g., third place
out of 6) vs. using another strategy that gives you a chance of finishing
in first place (out of 6) and a chance of finishing in last place (out of
6). Assume each of these two strategies involves the same amount of
effort. Also, note that first place means the most steps taken and last
place means the least. We will vary the chances approximately five times,
to estimate the percentage chance that makes you indifferent between
choosing the certain rank outcome and the uncertain rank outcome.
We told participants that the hypothetical contests did not award prizes
and that their identity would be anonymous, because we wanted to assess
their intrinsic utility for rank outcomes. Participants within each study
were randomly assigned to one of 8 conditions of a 2x2x2 between-subjects
full factorial design. The first factor was the athletic vs. intelligence
frame. Participants randomized to the intelligence frame read that they
were matched up in a competition to see who can correctly solve the most
puzzles in 10 minutes. The second factor was a word vs. numerical
formatting of rank information. The above example shows the word format; in
the numerical format, participants decided between a guaranteed outcome of
“rank #3 out of 6” vs. a chance of finishing in “rank #1 (out of 6)”
vs. “rank #6 (out of 6).” The third factor counterbalanced the order in
which we elicited the rank utilities for each participant. In the ascending
version, we elicited utilities in the order of ranks 2,3,4,5, and in the
descending version we started with rank 5 and finished with rank 2 (the
utilities of last and first place were set to 0 and 1, respectively, as
described next). We had no strong predictions or formal hypotheses about
these three between-subject factors of the design (athletic vs intelligence
competitions, rank wording, and rank order); we included these variations
mainly as robustness checks to ensure that the utility curve results were
not driven by arbitrary features of the experimental design.2
Under the axioms of EUT, individuals’ preferences for different outcomes
can be identified through a utility function (often referred to as “von
Neumann-Morgenstern utilities”; von Neumann & Morgenstern, 1947). To
elicit utilities for each participant, we applied the “probability
equivalent” (PE) method (Hershey & Schoemaker, 1985). Because utility
functions are unique up to a positive linear transformation, we
arbitrarily anchored the utility of last place at 0 and the utility of
first place at 1. Then, to elicit an individual’s utility for finishing
in third place (out of 6), for example, we began by asking her to choose
between the following two options: A) “a strategy that guarantees you will
finish in third place (out of 6),” or B) “a strategy in which you have a
50% chance of finishing in first place (out of 6) and a 50% chance of
finishing in last place (out of 6).” If the individual selected A, then we
asked her to choose between options A and B again, but this time option B
was presented as a 75% and 25% chance of finishing in first and last
place, respectively. We proceeded with this bisection approach until we
identified the percentage p such that the individual was
approximately indifferent between option A (finishing in third place for
certain) or option B (p chance of finishing in first and
1-p chance of finishing in last).3
By fixing the utility of first place at 1 and last place at 0, this final
value of p (divided by 100) estimated the individual’s utility
for finishing the contest in third place. We then repeated the same
process to assess that same individual’s utility for other ranks, thereby
creating within-subjects utility curves over ranks.
| Table 2: Summary of individuals’ utility function behavior. Column 2
indicates the percentage of participants who had greater utilities with
better ranks (H1). Column 3 indicates the percentage of participants
whose utility function between first and third place was strictly
convex (i.e.,
U(Rank 2) − U(Rank 3) < U(Rank 1) − U(Rank 2);
H2a). Column 4 indicates the percentage of participants whose utility
function between third-to-last and last place was strictly concave
(i.e.,
U(Rank 5) − U(Rank 6) > U(Rank 4) − U(Rank
5); H2b). The last column indicates the percentage of participants
who had a greater drop in utility from first to second place, compared
to the drop in utility from second-to-last to last place (H3). 95%
confidence intervals for the population percentage of each column are
within ± 2% of the values shown. |
Study | Utility Increasing from Second-to-Last Place to Second Place | Convex at Second | Concave at Second-to-Last | Drop from First > Drop to Last |
1 | 72% | 79% | 72% | 68% |
2 | 86% | 80% | 68% | 69% |
As discussed in the Results section, the PE elicited for some participants
at second-to-last place involved low probabilities, and similarly, the PE
elicited at second place for some involved high probabilities. Therefore,
as a robustness check, we also estimated utilities assuming individuals
apply a nonlinear probability weighting function that overweights low
probabilities and underweights high probabilities (as introduced in
Prospect Theory; Kahneman and Tversky, 1979). Specifically, we applied a
widely-used and well-validated nonlinear weighting function (Prelec, 1998;
Stott 2006), which weights probabilities using the function
w(p)=e−(−lnlnp)β , where 0<β <1 is a
tuning parameter that affects the curvature of the function. Applying the
evaluation of lotteries described in Cumulative Prospect Theory (Tversky
and Kahneman, 1992) and using the probability equivalent, pPE,
obtained from our bisection search for an individual’s utility of rank N,
we set
| U(rank N) = |
| | U(last place) · [w(1) w(pPE)] + U(first place) · w(pPE) |
| |
Letting U(last place) = 0 and U(first place) = 1 implies that
w(pPE) estimates the individual’s utility for rank N
(recall pPE estimates their utility under EUT).
After participants made their competition choices, they answered some
questions about how they thought they would actually rank in a contest,
about their competitiveness, and about their feelings about finishing in
first place or last place. Finally, participants indicated their gender,
age, and ethnicity. The text for all of these individual difference
measures are provided in Section 1 of the
Supplement.
4 Results
First, we report on the percentage of participants that exhibited the
behaviors hypothesized above, and then we discuss their magnitudes. We
begin by using the utility elicitation procedure under EUT, and later
discuss results under CPT. For ease of exposition, we report the results
of Studies 1 and 2 in the main manuscript, since those both involved
hypothetical contests among 6 people. Study 3 involved a hypothetical
puzzle-solving contest among 10 people (rather than 6), and not all rank
utilities were measured, so we report the results of Study 3 in the
Supplement (Section 3). The overall results and
insights were quite similar across studies.
Table 2 shows that 72% of all participants (pooled across factors) in
Study 1 had utilities that increased monotonically from second-to-last to
second place (supporting H1)4, 79% had convex
utility curves at second place (supporting H2a), 72% had concave curves at
the second-to-last place (supporting H2b, H3), and 68% had a bigger
decrease in utility from first place to second compared to their decrease
from second-to-last to last place (supporting H4). The 95% confidence
intervals around each of these percentages was ± 2% or less. The
results of Study 2 also support Hypotheses 1-4. Visually, we see the
predominant patterns of Table 2 in the plot of average utility vs. rank
for Studies 1 and 2 (Figure 1).5
There were no statistically significant interaction effects among the three
factors used for randomization, and the insights of Table 2 held for each
level of the three factors. For example, a majority of individuals
exhibited each of the four conditions (denoted by the columns of Table 2),
regardless of whether their hypothetical scenario involved stepping or
solving puzzles, whether ranks were expressed as numbers or words, or
whether rank utilities were elicited in ascending or descending order.
Whereas Table 2 shows the percentage of respondents that satisfied each of
the four properties (columns 2–5) separately, we also analyzed the
percentage of respondents jointly falling into each of the 16
(=24) combinations of yes/no across the categories. For
example, we found that 26.1% and 28.5% of respondents in Studies 1 and
2, respectively, satisfied all four conditions simultaneously (these
proportions were significantly greater than the 6.25% that would be
expected at chance level, p < .001 in both studies.)
These were the modal outcomes by a significant margin; for both Study 1
and Study 2, the second most common combination was respondents who
satisfied all conditions except for “concave at second-to-last” (Study 1:
18.1%; Study 2: 22.7%). The number of respondents satisfying at least
three of the four conditions was 71.4% and 77.0% for Studies 1 and 2,
respectively. The complete breakdown of all 16 combinations is shown in
Section 2 of the Supplement.
In addition to the proportion of individuals exhibiting the various utility
patterns, Table 3 measures the magnitudes of some relevant differences.
For example, the participants of Study 1 had a utility of second place
that was on average 0.35 utils higher than the utility of second-to-last
place (t-statistic of paired t-test = 56.7; p < .001;
Cohen’s D = 1.281), supporting the hypothesis that individuals
fundamentally prefer higher to lower ranks (supporting H1). Furthermore,
the loss in utility from first to second was on average 0.21 utils higher
than the gain in utility from last to second-to-last place (t-statistic of
paired t-test = 23.9; p < .001; Cohen’s D = 0.539),
supporting H4.
| Table 3: Average within-subject utility differences, with 95% confidence
intervals in parentheses. Column 2 shows the average of each
individual’s U(Rank 2) − U(Rank second-to-last). Column
3 shows the average of the individuals’
[U(Rank 1) − U(Rank second-to-last 2)] − [U(Rank
second-to-last 5) − U(Rank last)], where U(Rank 1)
and U(Rank last) were set to 1 and 0, respectively. |
Study | (Utility Second)
- (Utility Second-to-Last) | (Drop from First)
-
(Drop to Last) |
1 | 0.35 (0.34, 0.36) | 0.21 (0.20, 0.23) |
2 | 0.35 (0.33, 0.37) | 0.22 (0.19, 0.24) |
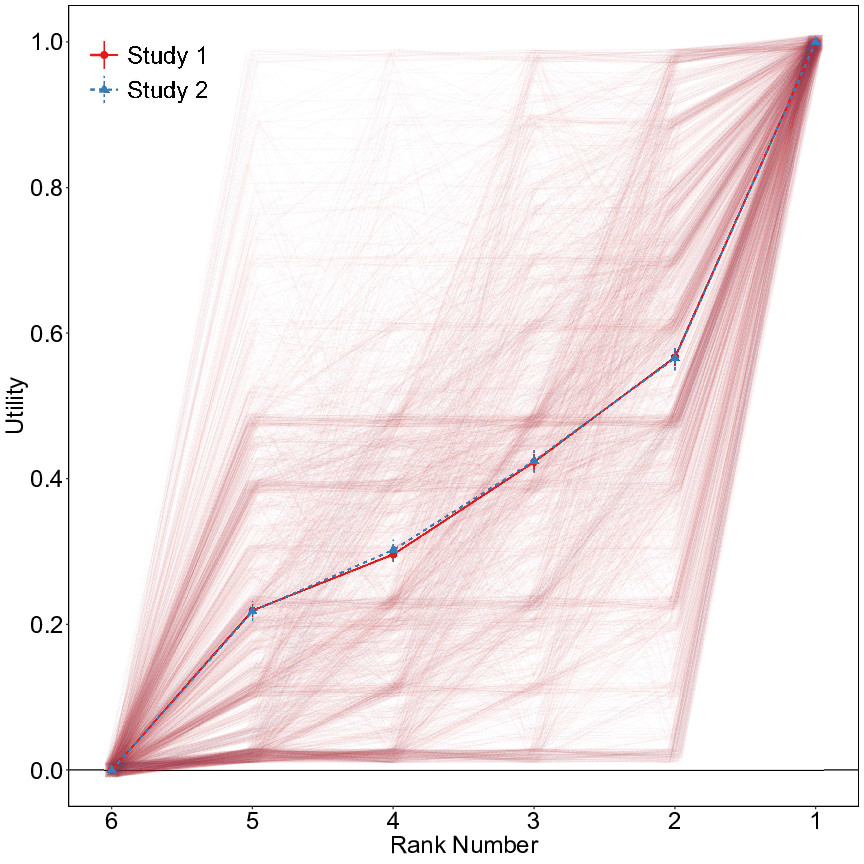
| Figure 1: Utilities by rank, for Studies 1 and 2. The dark lines connected by dots
show the average utilities across all participants for the two studies
(the two curves nearly coincide with each other). The largest 95%
confidence interval half-width for the averages was 0.02. The lines in
lighter shading show the utility curves for every individual of each
study. |
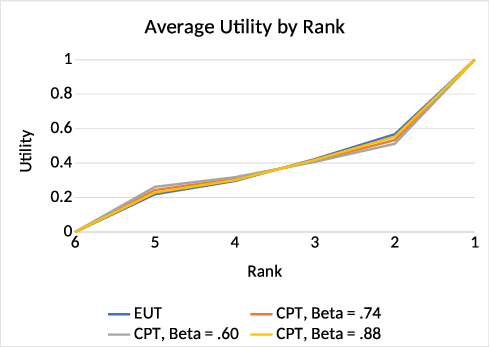
| Figure 2: Average utility by rank, for Study 1, using both EUT and CPT valuation
procedures. |
In addition to the utility elicitation exercises, we also asked
participants a direct question to assess the comparative strength of their
own FPS vs. LPA tendencies: “Which would feel better during a competition:
rising from second place to first, or rising from last place to
second-to-last place?” On a scale of 1 to 7, with 1 meaning rising from
second to first place would feel much better, 7 meaning rising from last
to second-to-last place would feel much better, and 4 meaning they would
feel equally good, the average response in Study 1 was 2.11 (± 0.07 95%
CI), and in Study 2 it was also 2.11 (± 0.10) (this question was not
asked in Study 3). This provides further support for the hypothesis that
individuals are even more FPS than they are LPA.
Our utility estimates were based on the assumption that individuals are
Expected Utility maximizers. Indeed, it is this assumption that allows one
to equate an individuals’ probability equivalent with their utility for
that lottery. As a robustness check, we also estimated utilities assuming
individuals instead use Cumulative Prospect Theory (CPT) to value
lotteries. Recall that CPT was motivated by evidence that individuals
overweight small probabilities and underweight large probabilities. In
Study 1 (our largest sample size study), 7% of subjects indicated a
probability equivalent for second place that was greater than 0.95 (where
the effect of underweighting is most pronounced), and 27% of subjects
indicated a probability equivalent for second-to-last place that was less
than 0.05 (where the effect of overweighting is most pronounced).
Therefore, we reanalyzed the results of Study 1 using the nonlinear
weighting function w(p)=e−(−lnlnp)β , and
we estimated the utility of a rank outcome N as U(rank N) =
w(pPE) (where pPE is the individual’s
probability equivalent for the lottery; see Methods section). We used
β values of 0.60, 0.74, and 0.88, which are based on the
estimation work of Wu and Gonzalez (1996).
Figure 2 shows the utility curves for Study 1 under EUT (repeated from
Figure 1) as well as the three variants of the CPT weighting function.
Visually, we see that the general shape of the utility curve is robust to
whether we use EUT or CPT to elicit utilities. Under the baseline value of
β = .74, 86% of participants’ utility curves were convex at second
place, 82% were concave at second-to-last place, and 68% had a bigger
decrease in utility from first place to second compared to their decrease
from second-to-last to last place (under EUT, these percentages were 79%,
72%, and 68%, respectively). Therefore, our main hypotheses still hold
under CPT.
5 Discussion
The results from three studies (two reported in main text and one reported
in the supplement) were remarkably consistent in their overall findings
and support of Hypotheses 1–4. That is, a large majority of individuals
have utilities for competition-based rank outcomes in hypothetical
scenarios that exhibit the following patterns: a greater preference for
higher ranks, risk aversion at second-to-last place, more risk seeking at
second place, and greater utility loss between first and second compared
to second-to-last and last place. These findings held despite clear
wording that the hypothetical contests involved anonymous participation
and contained no prizes. In summary, individuals appear to be inherently
both FPS and LPA, and exhibit an even stronger drive to attain first place
than to avoid last place.
Our hypotheses were motivated by connections to Prospect Theory, with
second place viewed as a loss if one views first place as a reference
point, and second-to-last place viewed as a gain if last place is one’s
reference point. To elicit individuals’ utilities for second place, we
asked them to choose between a guaranteed finish of second place vs. some
probabilities of finishing in first and last place. Given the close
proximity of second place to the upper end of the rank spectrum (i.e.,
first place), it is plausible that individuals view the extreme point of
first place as a reference point. Similarly, someone imagining they are
in second-to-last place may view the other extreme point (last place) as
their reference point. In a similar vein, the kind of counterfactual
thinking that explains why silver medalists are less happy than bronze
medalists (Medvec, Madey and Gilovich (1995)) may help explain why those
in second place are risk seeking while those in second-to-last place are
risk averse. That is, the dissatisfaction of just missing first place may
induce the second place contestant to take more risk, while narrowly
avoiding last place leads the second-to-last place contestant to be
content with maintaining that position.
Two intriguing alternative explanations may explain risk-seeking
preferences at second place and risk-aversion at second-to-last place.
First: the biology and neuroscience literature discuss a phenomenon known
as “the winner effect”, in which winners of competitions become more
aggressive in subsequent competitions, and conversely, losers become more
submissive (Hsu & Wolf, 1999; Robertson, 2012; Zilioli & Watson, 2014).
If individuals in our study view a middle rank as their reference point
going into the competition, then they may instead view second place as a
win (relative to their expectations) and second-to-last place as a loss.
In this case, the winner effect could also explain risk-taking and
risk-aversion near first and last place, respectively. We asked each
study participant how they thought they would actually rank in a contest
like the one described. The averaged rank out of the six possible ranks
of Study 1 was 2.64 (± 0.05 95% CI), closer to the middle than either
end of the rank spectrum. The implications of this perspective present an
interesting contrast to the well-known shape of Prospect Theory utility
curves (concave over gains to the right of a middle reference point,
convex over losses to the left of middle). Referring to Figure 1, for
example, and viewing the middle of ranks as the reference point, we
observe a convex curve over gains (in rank) and a concave curve over
losses. In other words, while the shape of Prospect Theory utility curves
is well established when outcomes are dollars, the curvature may flip when
the outcomes are ranks.
There is a second alternative explanation that could give rise to
risk-seeking preferences at second place and risk-aversion at
second-to-last place: mental models about competitions. Based on previous
experience, participants may expect that achieving first place (versus
second place) requires more skill and effort than avoiding last place
(versus second-to-last place). If so, the utility curve we observed may
reflect the perceived effort of achieving each position. Likewise, in
real-life competitions, a risky strategy may often be required to achieve
first (as one has to take a risk to stand out and beat the field), and a
safe strategy may be prudent to avoid last place. In our scenarios, we
gave explicit probabilities for each choice and outcome, and specified
that the effort of each strategy was equivalent, but real-world mental
models for risk and effort in competition may influence participants’
preferences nonetheless. We leave this exploration of mental models about
competition as a topic for future research.
We emphasize that our studies focused on eliciting von Neumann-Morgenstern
utilities over ranks. In doing so, we asked participants to choose
between certain rank outcomes vs. probabilistic outcomes (between first
and last place), until we found their indifference probability. These
scenarios were hypothetical. Indeed, every von Neumann-Morgenstern
utility elicitation exercise or description we are aware of describes
choices between hypothetical outcomes. As with all of these experiments,
the question remains as to how individual utility curves map to real
behavior. The decision of when to expend effort, and how much, in the
course of an actual competition involves too many complexities (both
physical and psychological) to be captured by a hypothetical scenario.
Important factors may include time remaining in the contest, the distance
ahead of/behind the next ranked individual, or the history of rank
positions thus far in the competition. For example, runner A, who has led
a 5 km race for the first 4.5 km before falling to second place with .5 km
to go, may expend effort differently, compared to runner B, who has
steadily moved up in rank throughout a different 5km race, until reaching
second place with .5 km to go (controlling for the same distance behind
the first place runner in both cases). Runner A may be deflated having
lost the lead, whereas runner B may be inspired by her continued gains.
On the other hand, runner A may push harder to regain the feeling of being
first, whereas runner B may be content with her rise from a low rank to
second place.
Finally, an interesting design question for real contests is whether to
anonymize or reveal contestants’ identities. If results and identities are
publicized, it is possible that the shame of finishing in last place could
hold more weight than the glory of finishing in first. Future lab and field
experiments may help us better understand how competitors respond to rank
information revealed publicly vs. privately during actual contests.
References
Allport, F. H. (1924). Social Psychology. Boston,: Houghton
Mifflin.
Buunk, A. P., & Gibbons, F. X. (2007). Social comparison: The end of a
theory and the emergence of a field. Organizational Behavior and
Human Decision Processes, 102(1), 3–21.
Diecidue, E. & Wakker, P. P. (2001). On the intuition of rank-dependent
utility. Journal of Risk and Uncertainty, 23(3),
281-298.
Festinger, L. (1954). A theory of social comparison processes.
Human Relations, 7(2), 117–140.
Garcia, S. M., Tor, A., & Gonzalez, R. (2006). Ranks and rivals: A theory
of competition. Personality and Social Psychology Bulletin,
32(7), 970–982.
Garcia, S. M., Tor, A., & Schiff, T. M. (2013). The psychology of
competition: A social comparison perspective. Perspectives on
Psychological Science, 8(6), 634–650.
Hershey, J. C., & Schoemaker, P. J. H. (1985). Probability versus
certainty equivalence methods in utility measurement: Are they equivalent?
Management Science, 31(10), 1213–1231.
Hsu, Y., & Wolf, L. L. (1999). The winner and loser effect: integrating
multiple experiences. Animal Behaviour, 57(4), 903–910.
Kahneman, D., & Tversky, A. (1979). Prospect Theory: An analysis of
decision under risk. Econometrica, 47(2), 263–292.
Ku, G., Malhotra, D., & Murnighan, J. K. (2005). Towards a competitive
arousal model of decision-making: A study of auction fever in live and
internet auctions. Organizational Behavior and Human Decision
Processes, 96(2), 89–103.
Kuziemko, I., Buell, R. W., Reich, T., & Norton, M. I. (2014). “Last-Place
Aversion”: Evidence and redistributive implications. The Quarterly
Journal of Economics, 129(1), 105–149.
Malhotra, D. (2010). The desire to win: The effects of competitive arousal
on motivation and behavior. Organizational Behavior and Human
Decision Processes, 111(2), 139–146.
Medvec, V. H., Madey, S. F., & Gilovich, T. (1995). When less is more:
counterfactual thinking and satisfaction among Olympic
medalists. Journal of Personality and Social
Psychology, 69(4), 603.
Prelec, D. (1998). The probability weighting function.
Econometrica, 66(3), 497–527.
Quiggin, J. (1982). A theory of anticipated utility. Journal of
Economic Behavior & Organization, 3(4), 323–343.
Robertson, I. (2012). The winner effect: How power affects your
brain: A&C Black.
Schmeidler, D. (1989). Subjective probability and expected utility without
additivity. Econometrica, 57(3), 571–587.
Schoenberg, E. J., & Haruvy, E. (2012). Relative performance information
in asset markets: An experimental approach. Journal of Economic
Psychology, 33(6), 1143–1155.
Stott, H. P. (2006). Cumulative prospect theory’s
functional menagerie. Journal of Risk and
Uncertainty, 32(2), 101–130.
Tversky, A. & Kahneman, D. (1992). Advances in prospect theory: Cumulative
representation of uncertainty. Journal of Risk and
Uncertainty, 5(4), 297–323.
von Neumann, J. & Morgenstern, O (1947). Theory of Games and
Economic Behavior, 2nd edition. Princeton University Press, Princeton,
NJ.
Wu, G. & Gonzalez R. (1996). Curvature of the probability weighting
function. Management Science, 42, 1676–1690.
Yaari, M. E. (1987). The dual theory of choice under
risk. Econometrica, 55(1), 95-115.
Zilioli, S., & Watson, N. V. (2014). Testosterone across successive
competitions: Evidence for a ‘winner effect’ in humans?
Psychoneuroendocrinology, 47, 1–9.
This document was translated from LATEX by
HEVEA.