Judgment and Decision Making, Vol. 15, No. 5, September 2020, pp. 660-684
Comparing fast thinking and slow thinking: The relative benefits of interventions, individual differences, and inferential rules
M. Asher Lawson*
Richard P. Larrick#
Jack B. Soll$
|
Research on judgment and decision making has suggested that the System 2
process of slow thinking can help people to improve their decision making
by reducing well-established statistical decision biases (including base
rate neglect, probability matching, and the conjunction fallacy). In a
large pre-registered study with 1,706 participants and 23,292 unique
observations, we compare the effects of individual differences and
behavioral interventions to test the relative benefits of slow thinking on
performance in canonical judgment and decision-making problems, compared
to a control condition, a fast thinking condition, an incentive condition,
and a condition that combines fast and slow thinking. We also draw on the
rule-based reasoning literature to examine the benefits of having access
to a simple form of the rule needed to solve a specific focal problem.
Overall, we find equivocal evidence of a small benefit from slow thinking,
evidence for a small benefit to accuracy incentives, and clear evidence of
a larger cost from fast thinking. The difference in
performance between fast-thinking and slow-thinking interventions is
comparable to a one-scale point difference on the 4-point Cognitive
Reflection Test (CRT). Inferential rules contribute unique explanatory
power and interact with individual differences to support the idea that
System 2 benefits from a combination of slower processes and knowledge
appropriate to the problem.
Keywords: debiasing, dual-system theories, reflection, rule-based reasoning, CRT
1 Introduction
With the popularity of Daniel Kahneman’s 2011 best-selling book,
Thinking, Fast and Slow, the prescription to slow down our
thinking has become increasingly common in popular translations of
judgment and decision making (JDM) research. For example, a 2016 Harvard
Business Review article argues that “the essential lesson for
competitive-strategy decision-makers is not so fast… take your time and
don’t be so sure” (Chussil, 2016). Similarly, a 2017 Harvard Business
Review article states that “reflective thinking improves decision making
by grounding it in a more integrated and coherent world view than one can
have by acting only in the moment” (Reeves, Torres & Hassan, 2017).
But is the exhortation to slow down in order to think smarter sound advice?
There are at least two reasons to be cautious about this claim and why
more study is needed. First, thinking more slowly can be helpful only if
it increases the chances of thinking more soundly about a problem. If one
does not have access to the necessary rule for solving the problem or
recognize that the rule applies in the given situation, then thinking
slower is unlikely to help (Kahneman, 2000). Second, much of the evidence
that favors slow thinking has alternative interpretations that may not
support a general prescription.
For example, one argument for slow thinking is that people who are
dispositionally-inclined to be more reflective are better at avoiding
common decision biases (Frederick, 2005; Oeschssler, Roider & Schmitz,
2009; Cokely & Kelley, 2009; Obrecht, Chapman & Gelman, 2009; Koehler
& James, 2010). However, it would be a logical leap to conclude from an
individual difference variable that less reflective people can debias
themselves by slowing down, or even that more reflective individuals reach
correct answers because they are reflective. It could be, for example,
that a common factor such as education or temperament causes people to
become both reflective and knowledgeable about the applicable rules.
Alternatively, a growing body of evidence suggests that people may reach
correct answers by having good intuitions, rather than by using
deliberation to correct bad intuitions (Thompson, Pennycook, Trippas &
Evans, 2018; Raoelison, Thompson & De Neys, 2020). Experiments are
needed to tease apart the possible causal mechanisms. Although some work
has been done, if the aim is to be able to advise laypeople on whether and
how to change their thinking style, we will argue that the requisite
experiments have previously not been conducted and published. We aim to
contribute research that can help provide an answer.
We investigate our questions using canonical JDM problems built on clear
statistical rules that are integral to answering the problem successfully.
We include a broad range of statistical reasoning problems that cue
incorrect responses. Importantly, these problems are not representative of
many real-world situations, although some behavioral tendencies such as
judging probability by representativeness (Kahneman & Tversky, 1973) are
sufficiently general that they apply across contexts. As an example of
what we mean by a statistical rule, consider the famous Linda problem
(adapted from Tversky & Kahneman, 1983).
Linda is 31 years old, single, outspoken and very bright. She majored in
philosophy. As a student, she was deeply concerned with issues of
discrimination and social justice, and also participated in anti-nuclear
demonstrations.Rank these from most (=1) to least (=3) probable.
(1) Linda is a bank teller.
(2) Linda is active in the feminist movement.
(3) Linda is a bank teller and is active in the feminist movement.
Most people rank option 3 as more probable than option 1 despite the
normative rule that the conjunction of two events can be no more probable
than either of its constituent parts. Failure to recognize that option 1 is
more probable is known as the conjunction fallacy. Why do people succumb to
it? The standard explanation is that they apply the representativeness
heuristic, which in this example entails substituting their perception of
the similarity between Linda’s description and the stereotype of a bank
teller for a probability, which would require more effort to work out
(Kahneman, 2011). Among those who commit the fallacy, however, some may
have access to the basic conjunction rule and others may not. For an
example of the latter, if you ask people “which is more probable, (1) a
staircase has five steps, (2) a staircase is carpeted, or (3) a staircase
has five steps and is carpeted?” some people may rate statement 3 as more
likely than 1 or 2 because they do not think in terms of conjunctions.
Slow thinking might help someone on the Linda problem who can access the
conjunction rule, prompting them to check whether their similarity-based
judgment is valid. However, for someone who does not have access to the
rule, slow thinking might only lead them to more diligently and carefully
apply faulty heuristic reasoning, as they lack access to the rule necessary
to improve accuracy. Individuals’ likelihood of accessing and applying
rules will vary significant across contexts and domains: Access to
inferential rules is a matter of degree (Flavell, 1971). The two-question
measure of each specific inferential rule we use in our experiment serves
to measure whether participants had some minimal access to the relevant
rule, without which it would be difficult to answer the harder JDM
questions.
2 Literature review and theoretical development
There is a long tradition in research on judgment and decision making of
examining the cognitive processes that lead individual judgments to
deviate systematically from a normative standard. For nearly as long, the
field has also considered how decision makers might be helped to make
better decisions. Different research programs have proposed different
approaches. In the 1980s, Nisbett and colleagues examined whether
knowledge of simple rules could help people make better decisions (Nisbett
& Ross, 1980; Kunda & Nisbett, 1986; Nisbett, Fong, Lehman & Cheng,
1987). From the 1990s to present day, dual process theories of decision
making have argued for the benefits of slower, more deliberate thinking
(System 2) as a means to make better decisions (Sloman, 1996; Stanovich &
West, 1999, 2000; Kahneman & Frederick, 2002; Evans &
Stanovich, 2013). Both rule-based and dual-process theories offer
“internal” interventions that propose that individual cognitive processes
can be improved – either by more ready access to rules of reasoning, or
use of a different style of thinking. This contrasts with a more recent
approach to nudge people toward better decisions through “external”
situational interventions (Thaler & Sunstein, 2008).
In this paper, we build on the two internal approaches to examine the
benefits of slowing down one’s thinking for individual decision making.
Rule-based approaches to improving decision making focus on training
people in abstract rules that apply across situations (Fong, Krantz &
Nisbett, 1986; Morewedge et al., 2015). In contrast, dual process
approaches focus on differences in cognitive processes, distinguishing
rapid, automatic, and intuitive processes (System 1) from slower,
analytic, and deliberative processes (System 2) (Kahneman, 2011; Sloman,
1996; Stanovich & West, 1999, 2000; Chaiken & Trope, 1999). The two
systems are not fully distinct categories — Evans and Stanovich (2013)
have encouraged a movement away from viewing System 1 and System 2
processes in terms of defining lists of features to focusing instead on
typical correlates of each kind of process. For example, System 1 is
typically correlated with fast speeds, parallel processing, and
automaticity, whereas System 2 is typically correlated with slow speeds,
serial processing, and control. However, the only features that the
authors see as defining are that System 1 is autonomous and does not
require working memory, whereas System 2 requires working memory and
engages in mental simulation.
Originally, the dual-process framework proposed that System 2 processes
monitor System 1 outputs, detect errors, and correct them. More recent
perspectives on dual-process theory emphasize that effective reasoning is
not always corrective – processes that were traditionally characterized as
needing deliberative processing can be cued in System 1 to provide
“logical” intuitive responses (De Neys & Pennycook, 2019). Importantly,
recent approaches to dual-process theory do not emphasize that intuitive
(System 1) processes are inaccurate and deliberative (System 2) processes
accurate. A range of evidence and theorizing proposes that System 1 can
produce effective responses without correction and that System 2 can reach
poor responses despite reflection (Morewedge & Kahneman, 2010; Pennycook,
De Neys, Evans, Stanovich & Thompson, 2018). We find support for this
assertion in our data – participants’ fast responses are often accurate. We
study whether slow thinking is an effective means by which participants can
improve their reasoning.
The rule-based approach and dual process approach emphasize different
aspects of reasoning but are not mutually exclusive. As discussed earlier,
slowing down may help in general, but may also be more helpful if one has
access to the relevant rule. In fact, Sloman’s (1996) original description
of System 2, which he called “rule-based,” assumed that its greater
accuracy comes in part from accessing and using appropriate analytic rules
for solving problems. The literature has introduced the terms ‘cognitive
capital’ (Camerer & Hogarth, 1999) and ‘mindware’ (Perkins, 1995;
Stanovich & West, 2008) to capture the rules, knowledge, and thinking
styles that decision makers bring to a problem. These are both
superordinate terms that include both knowledge (such as statistical
rules) and individual differences such as thinking dispositions. For
example, Stanovich and West (2008, p. 688) characterize mindware as the
context specific “tools to think scientifically and the
propensity to do so; the tendency to think logically; and
knowledge of some special rules of formal reasoning and good
argumentation” [italics added]. In the present research, we aim to
disentangle the tools of reasoning, such as rules, from the propensity to
use them. We review the dual-process and rule-based approaches to
improving decisions, each of which emphasizes a different element of
mindware (or cognitive capital). As we proceed, we integrate the
approaches to develop a set of questions related to decision speed and
rule accessibility. Later, we present the results of a large, multistage
online experiment designed to determine the degree to which telling people
to slow down is good advice.
2.1 System 2:
Reflection, correction, and decision speed
Research using the dual-process framework has focused primarily on the
reflection property of System 2. This includes both research into the
benefits of slow thinking, and research asking whether slow thinking is
needed at all. Recent research into problem solving in JDM proposes that
deliberation plays a key role, but may be more important in choosing
between competing intuitions, rather than calculating normative responses
to substitute for an incorrect intuition (De Neys & Pennycook, 2019). In
the present research, we emphasize another aspect of System 2. In its
original description (Kahneman, 2000; Sloman, 1996; Stanovich & West,
1999), System 2 depends on rules to structure the reasoning process. We
start our review of relevant literatures by focusing on the larger, more
recent literature on reflection before turning to the older
literature on rule possession in the next section. Our empirical
tests will consider both of these properties of System 2. Not all judgment
and decision making problems rely on inferential rules, but in the present
research we focus on statistical reasoning problems with clear normative
standards that depend on a specific, corresponding rule.
Researchers have investigated the impact of fast (System 1) thinking and
slow (System 2) thinking using two main methods: individual differences in
thinking style and experimental manipulations of decision speed.
The first line of evidence uses the Cognitive Reflection Test (CRT) as an
individual difference measure. The CRT consists of three questions that
have a tempting intuitive answer that happens to be incorrect. The CRT was
originally offered as a measure of an individual difference in the
tendency to override incorrect initial intuitive answers with deliberation
(Frederick, 2005). More recently, scholars have suggested alternative
ideas about what the CRT actually measures. Baron and his colleagues
suggest that the CRT measures the degree to which one has a reflective
cognitive style — a disposition that permeates all phases of problem solving
(Baron, Scott, Fincher & Metz, 2015). Attali and Bar-Hillel (2020)
contend that the CRT measures math ability; in their studies the CRT
questions load onto the same latent construct as math questions that do
not have tempting but incorrect answers (see also Erceg, Galić &
Ružojčić, 2020, for similar conclusions).
As of this writing, exactly what aspect of cognitive style the CRT actually
measures is still hotly debated. Regardless, it is a widely used measure
and is associated with better performance in a range of reasoning problems,
such as more patient temporal discounting (Frederick, 2005; Oeschssler et
al., 2009) and greater reliance on expected values (Frederick, 2005; Cokely
& Kelley, 2009), base rates (Oeschssler et al., 2009), and the law of
large numbers (Obrecht et al., 2009). The CRT is also associated with
reduced susceptibility to framing effects (Frederick, 2005), the
conjunction fallacy (Oeschssler et al., 2009), and probability matching
behavior (Koehler & James, 2010). However, the CRT has been found to be
unrelated to anchoring effects (Oeschssler et al., 2009), frequency bias
(Obrecht et al., 2009), and the bias blind spot (West, Meserve
& Stanovich, 2012). These mixed results may be due to the source of
errors: whether errors are strategy-based, association-based, or
psychophysically-based (Arkes, 1991). For further discussion, see Toplak,
West and Stanovich’s (2011) comprehensive review of the relationship
between the CRT and performance in reasoning problems.
In the present research, we included the CRT with the expectation it would
have a positive and significant relationship to performance on our JDM
questions. Moreover, because of its common usage, the CRT provides a
useful benchmark that would allow us to compare the relative effect sizes
of movements between levels of CRT score with the effect sizes of
behavioral interventions to encourage slow thinking. The results can shed
light on whether a debiasing strategy of instructing reasoners to slow
down is able to achieve a benefit similar to those observed for
dispositional differences in reflection as measured by CRT. We also tested
whether CRT and other individual difference measures interact with a less
studied component of System 2 to enhance performance: rule accessibility.
We will discuss this more fully in the next section.
In addition to using the CRT as an individual difference measure of
thinking style, researchers have investigated the effect of thinking speed
using two kinds of between-subjects experimental manipulations. The first
paradigm compares conditions in which respondents think quickly and
intuitively to conditions in which they think slowly and analytically. The
second paradigm compares conditions in which respondents think quickly and
intuitively with a control condition. Between-subjects manipulations of
decision speed have been implemented across a wide range of problems,
including probability matching (Roberts & Newton, 2001), conjunction
fallacy (Villejoubert, 2009), belief bias (Evans & Curtis-Holmes, 2005;
Tsujii & Watanabe, 2010), conditional inference (Evans, Handley & Bacon,
2009), and syllogistic reasoning (Stupple, Ball & Ellis, 2013). They have
also been implemented with measures from a variety of applied areas,
including marketing (Cryder et al., 2017), moral decision making (Phillips
& Cushman, 2017), and economics (Rand, Greene & Nowak, 2012; Rand et al.,
2014). Generally, researchers find significant effects comparing both fast
versus slow conditions and fast versus control conditions, such that
speeding up participants hurts their performance relative to the comparison
group. Research on cognitive load has similarly found that limiting
capacity impairs performance on reasoning problems, analogous to the
effects of fast thinking (e.g., De Neys & Verschueren, 2006; De Neys,
Schaeken & d’Ydewalle, 2005; De Neys, 2006; De Neys & Schaeken, 2007).
Decision speed has also been manipulated as a within-subjects variable,
where subjects provide two sequential responses. In this paradigm,
participants respond first with a fast, intuitive answer and then
subsequently reflect on their initial response to provide a final answer
(e.g., Thompson, Prowse Turner & Pennycook, 2011; Pennycook, Cheyne, Barr,
Koehler & Fugelsang, 2014; Pennycook, Trippas, Handley & Thompson,
2013; Bago & De Neys, 2017; Koriat & Goldsmith, 1996; Shynkaruk &
Thompson, 2006). The two-response paradigm has been used to research
dual-system processes across reasoning problems, including base rates
(Pennycook & Thompson, 2012; Pennycook et al., 2013), causal reasoning,
denominator neglect, categorical syllogisms (Thompson & Johnson, 2014),
rule and belief-based reasoning (Newman, Gibb & Thompson, 2017),
syllogistic reasoning problems (Bago & De Neys, 2017), and the
bat-and-ball problem from the CRT (Bago & De Neys, 2019b).
In sum, manipulations of decision speed have focused on comparing a fast
condition with either a slow condition or a control. We do not know of any
studies that compare a slow condition to a control condition, though in a
conceptually similar line of work researchers have compared the
instructions to “think logically” with a control group and found a benefit
on performance in logical reasoning problems (Evans, Newstead, Allen &
Pollard, 1994; Daniel & Klaczynski, 2006; Vadeboncoeur & Markovits,
1999; Evans, Handley, Neilens & Over, 2010; De Neys, Schaeken & d’Ydewalle, 2005). To our
knowledge there are no papers including a fast thinking, slow thinking,
and control condition in the study of decision making problems.
Consequently, existing findings do not allow us to assess whether fast
thinking hurts performance, slow thinking benefits performance, or both.
Does slow thinking improve performance relative to a control condition in
which people think at their own, self-directed pace? We believe the answer
to this question is critical for prescriptions for improving decision
making. If interventions to encourage slow thinking are indeed helpful,
such interventions would represent a readily implementable recommendation
for improving decisions (as suggested in the recent articles mentioned in
the opening paragraph). If the disparity between fast thinking and slow
thinking is driven by the harm of being sped up, rather than the benefit
of being slowed down, encouraging slow thinking is of less value. We
believe that to make any argument about the benefits of slow thinking, we
must first seek to assess it independently of fast thinking. In a similar
argument, Payne, Samper, Bettman and Luce (2008) showed that earlier
demonstrations of the superiority of unconscious decision making were
artifacts of requiring decision makers in the conscious condition to
deviate from their normal process by taking an inordinate amount of time
to make their decision. The unconscious condition performed no better than
the control condition in which respondents used their ordinary approach to
decision making. We pose a similar question: Does slow thinking perform
better or the same as a control condition in which respondents use their
ordinary approach to decision making?
We investigated our research questions in a high powered,
pre-registered experiment with pre-registered hypotheses. We frame these
as questions rather than hypotheses – questions grounded in the literature
and to which the answers are of general interest, regardless of their
outcome. (Our pre-registration can be found at
https://osf.io/34uxz.)
We tested participants on canonical JDM problems that highlight biased
statistical reasoning. For example, we included the Linda problem from the
introduction which shows that many people commit the conjunction fallacy.
We focus on these kinds of problem because they served as foundational
demonstrations in the development of the field of JDM (Kahneman, 2011). We
include six different JDM biases in our study, including the conjunction
fallacy and others that will be described later.
Our first two questions concern whether we will replicate past research
relating CRT score to performance in canonical JDM problems, and whether
we will replicate past research comparing the performance benefits of slow
thinking versus fast thinking.
Question 1:
Are people more accurate on JDM problems when they score more
highly on individual difference measures such as the CRT?
Question 2:
Are people more accurate on JDM problems in a slow thinking
condition than in a fast thinking condition?
To test whether it is fast thinking that hurts performance, slow thinking
that benefits it, or both, we test performance in each intervention groups
against a control group in a between-subjects design.
Question 3a:
Are people less accurate on JDM problems in a fast thinking
condition compared to a control condition?
Question 3b:
Are people more accurate on JDM problems in a slow thinking
condition compared to a control condition?
Note that, based on the extensive past research we have reviewed, there is
very good reason to expect a positive answer to Question 3a. The literature
provides less guidance on Question 3b, as there has been very limited use
of a control condition in studies that attempt to manipulate the degree to
which people rely on fast thinking versus slow thinking.
It is possible that the benefit of slow thinking is more capable of being
realized when an individual has access to the appropriate rule. In the
next section, we develop questions that specify the conditional nature of
System 2’s success.
2.2 System 2: Rule-based reasoning
In Kahneman’s (2011) description of System 2, one of its primary functions
is to monitor and correct the automatic output of System 1. The ability for
System 2 to monitor and correct flawed intuition depends on an additional
feature of System 2: timely access to the relevant rule for solving the
problem. Kahneman (2000) earlier proposed, “A task will be too difficult if
(1) System 1 favors an incorrect answer, and (2) System 2 is incapable of
applying the correct rule, either because the rule is unknown or because
the cues that would evoke it are absent” (p. 682). This role for
rule-based reasoning echoes Sloman’s (1996) original theorizing. Sloman
(1996) called System 2 “the rule-based system” and argued that System 2 not
only deliberates and verifies, but also accesses abstract knowledge derived
from culture, education, and experience. Sloman (1996) described rules as
symbolic structures that state relationships between variables; variables
can take on new values in new situations (see also Smith, Langston &
Nisbett, 1992). Rules thus have the important property that they are
general — the reasoner can potentially apply them across different types of
situations if they are accessed and recognized as relevant.
To illustrate some of the challenges that people face in applying rules,
consider earlier research by Nisbett and his colleagues on statistical
reasoning (Fong et al., 1986; Nisbett et al, 1987; Nisbett,
1993; Lehman, Lempert & Nisbett, 1988; Smith et al.,
1992). This program of research argued that successful rule use depends on
multiple factors, including access to the relevant rule, an ability to
recognize when to use it, and an ability to use it in new domains with new
variables (Nisbett, Krantz, Jepson & Kunda., 1983). For example, many people have good
intuitions about sample size and regression to the mean in games of chance
and in sports. They have access to the rule that larger samples are more
reliable than smaller samples when outcomes have a clear stochastic
element. However, in other domains it can be hard to recognize the
relevance of a rule or how to apply it. Job interviews are small samples
of noisy behavior that provide an imperfect glimpse into a person’s
underlying traits. People neither recognize that behavior is a sample
drawn from an underlying distribution nor that sample size is relevant to
the problem. Linking back to the quote from Kahneman that opened this
section, it is not enough to simply engage System 2, or even to have
access to the rule. The decision problem must arrive with cues that bring
the correct rule to mind, which in turn must be recognized as the correct
rule to use in the situation. Nevertheless, having some form of access to
the rule is necessary if not sufficient for solving the problem.
In other work, researchers have used neutral versions of problems to
measure whether a decision maker has the necessary mindware to solve a
problem (Stanovich & West, 2008). The aim of a neutral problem is to
strip out content that is likely to evoke a heuristic-based, intuitive
answer that is incorrect. In this way, the neutral problem provides a pure
measure of whether or not the participant knows the rule needed to
correctly solve the problem. For example, Frey, Johnson and De Neys (2018) asked two
neutral problems about base-rates and two about conjunctions that removed
misleading stereotype information. The total score (out of four)
correlated significantly with whether subjects could be classified as a
consistent detector of conflict across base-rate and conjunction study
problems. Similarly, Šrol and De Neys (2020) constructed a mindware
instantiation index by averaging performance across eight neutral
reasoning problems. The index was significantly correlated with numeracy
and cognitive ability as measured by the Vienna matrix test (Klose,
Černochová & Král, 2002), and was also the single best predictor of
accuracy on study questions that depended upon the same measured rules.
We aim to build on this existing research by disentangling two aspects of
mindware: access to specific rules and the individual differences that
contribute to successful application of this knowledge. In our study, we
measured the accessibility of six different rules that each uniquely
corresponds to one of our six JDM problems. Each rule was measured with a
problem structure that was relatively transparent so that if subjects had
access to the rule, they would be likely to answer the rule question
correctly. These transparent questions are similar to the neutral problems
used in Frey et al. (2018) and Šrol and De Neys (2020); our
main point of departure was to test the degree to which access to specific
rules helped with directly corresponding JDM questions that were
more difficult and less transparent. We ask whether access to the relevant
inferential rule will positively predict problem performance on its
related JDM question.
Question 4:
Are people who have access to a specific inferential rule more
accurate on directly related JDM problems compared to people who do not
have access to the rule?
We are interested in the relationship between access to inferential rules
and performance in reasoning tasks, as this has implications for debiasing
interventions. As we measure access to six different rules, our design
allows us to distinguish between the effects of general rule access and
problem-specific rule access. This affords us insights to the process by
which respondents access and apply knowledge to focal problems. If rule
accessibility is tied to a general store of knowledge and not to specific
rules, then the predictive power of having access to the appropriate rule
for a JDM problem should on average be no greater than the predictive
power of having access to other rules that are necessary for other types
of JDM problems. For example, if specificity is irrelevant, then access to
the probability matching rule should be equally as predictive of success
in the Linda problem as is access to the conjunction rule. We will show
that, although general rule accessibility is predictive, access to the
specific rule is also important. We suggest that this is strong evidence
for a rule-based account in which successful reasoners retrieve and apply
abstract, necessary rules that they already know to some degree (when such
rules exist).
2.3 Rules and decision speed
The reason that instructing people to slow down might help performance in
JDM problems is that it causes them to correct or replace an erroneous but
intuitively tempting answer. This is more likely to happen if they have
sufficient access to the necessary rule for solving the problem. We
examine the combined benefit of rule knowledge and reflection by first
examining reflection as an individual disposition (as measured by CRT).
Question 5:
Does having access to a specific rule increase the benefits to
accuracy associated with having a more reflective disposition (as measured
by the CRT)?
Similarly, we ask whether our intervention to engage in slow thinking
may be of greater benefit among those with access to the inferential rule.
Question 6a:
Does having access to a specific rule increase the accuracy
benefits of a slow thinking condition relative to a control condition?
Conversely, even if one has access to the rule, one may not be able to
apply it if required to make a decision very quickly. For individuals who
have access to the rule, fast decision making may tend to prevent
application of the rule and cause them to fall back on incorrect
intuitions. An important boundary condition to this perspective is that
reasoners may have rules sufficiently encoded that they produce accurate
intuitive responses (Frey et al., 2018; Šrol & De Neys, 2020).
Broadly, people can be divided into at least three categories of knowledge:
Experts who can immediately generate good responses (Larrick & Feiler,
2015), people who do not have access to the relevant rule, and individuals
who require more deliberative processes to access and apply a rule. For
the first and second categories, performance should not be affected by
behavioral manipulations of decision speed. Experts should be able to
generate correct answers quickly. For individuals who lack access to the
rule, their decision will be poor regardless of decision speed. For the
third category, faster thinking is likely to be harmful if it disrupts
their ability to access and apply an inferential rule. We ask whether the
effect of a fast thinking manipulation varies with participants’ access to
inferential rules by testing the interaction described in Question 6b.
Question 6b:
Does having access to a specific rule increase the cost to
accuracy of a fast thinking condition relative to a control condition?
2.4 Incentives
If slower thinking improves accuracy on JDM problems, then one might argue
that providing monetary incentives for correct answers should have the
same effect. In the absence of incentives, people may take cognitive
shortcuts because the effort needed to correctly solve the problem is not
worth expending. With incentives, decision makers should be willing to
expend more effort to solve the problem correctly.
Although incentives might spur people to try harder, a number of studies
have concluded that incentives do not appreciably reduce susceptibility to
biases (see Camerer & Hogarth, 1999, for a review). This is true even
of very large incentives. Recently, Enke et al. (2020) conducted a study
in Nairobi, Kenya, where they rewarded participants with the equivalent to
one month’s salary for answering questions correctly. They tested
susceptibility to several biases, including base rate neglect and
anchoring. Not surprisingly, participants took substantially more time
when incentives were very large — a reflection of greater effort.
Nevertheless, solution rates remained largely unchanged for five of the
six tasks. Although participants may have tried harder, their performance
likely did not improve because the incentives did not instantaneously
confer the correct mental representation or rule for solving the problem
(Payne, Bettman & Johnson, 1992; Epley & Gilovich, 2005).
There was one exception to this finding — with very large incentives,
performance on the CRT increased from around 35% in the control condition
to 48% in the incentive condition. The CRT stands in contrast to many
other cognitive tests in that most people can probably access the needed
skills to solve at least one of the problems (basic addition and
subtraction are needed to solve the bat-and-ball problem). Enke et al.’s
(2020) results suggest that incentives improve performance when people have
the necessary rules and skills to produce the correct answer but do not
improve performance when rules and skills are lacking.
For the purpose of comparison, we included an incentives condition in our
experiment. Notably, Enke et al.’s (2020) participants did not take more
time when presented with standard laboratory incentives than in a no-pay
control condition. We suspect, however, that relatively small incentives
may be more effective at inducing thoughtfulness with online participants
when the incentives are non-trivial relative to the base pay. The
inclusion of an incentives condition will allow us to compare slow
thinking to incentives in terms of time taken, performance, and
interaction with rule accessibility. If the two conditions have similar
effects, it would seem reasonable to infer that incentives cause people to
slow down and think harder, much the same as we instruct people to do in
the slow thinking condition.
Question 7:
Are people more accurate on JDM problems in an incentive
condition compared to a control condition?
3 Experiment
Our primary goal in this research is to evaluate whether telling people to
slow down their thinking is good advice for canonical statistical problems
in the JDM literature. This is a different question from asking whether
people are more accurate when they think more slowly. People might slow
down on their own, for instance, when it is appropriate to do so (Payne et
al., 2008). They might also slow down due to dispositional differences
(such as those captured by high CRT scores). We are interested
specifically in whether it helps to encourage slow thinking when
respondents are acting as they would naturally. Furthermore, our review of
the literature suggests that even if the advice to slow down helps in the
aggregate, it may help people differentially depending on their individual
dispositions and the rule knowledge to which they have access. Thus, we
formulated questions relating to both main effects and interactions to ask
whether encouraging slow thinking may work better for some people than for
others.
Empirically, we will try to distinguish between knowledge and individual
differences in cognitive dispositions in our experiment. For clarity, we
will use different terms for each of these two aspects in our
operationalization: inferential rules and individual differences,
respectively. We measure accessibility to the specific, rule-based
knowledge needed to solve a focal JDM problem (e.g., the conjunction rule);
and we measure decision making disposition using individual differences
such as performance on the CRT. This will allow us to look at the effects
of our manipulations when including these variables in the model, and also
ask several additional questions. For example, we tested whether high CRT
individuals would answer more canonical JDM problems correctly, and whether
this advantage would be more pronounced when they have access to the
related statistical rule.
We designed a single, high-powered experiment that facilitates answering
our questions. Participants completed two separate stages that were
completed at least 24 hours apart. This was intended to reduce fatigue and
to mitigate any contamination of our dependent measures by our inferential
rule measures. In the first stage, participants completed the 12
inferential rule questions (6 rules x 2 measures each) and the questions
from the CRT, CRT-2 and Berlin Numeracy Test (BNT), as described in more
detail below. In Stage 2, the participants responded to the 12 JDM
questions that served as our DVs (6 JDM problems x 2 measures each). We
measured access to each inferential rule and each JDM problem twice to
reduce measurement error.
3.1 Method
3.1.1 Materials
We needed three categories of problems in order to find the answers to our
questions: problems that test for JDM biases that appear in the literature,
problems that test for access to rules, and problems that test for
individual differences in cognitive disposition. We next describe briefly
each set of problems and how they were constructed. Full experimental
materials are available in an online repository at
https://osf.io/mnvej/.
Problems to test JDM biases
To construct our battery of JDM questions, we started with 31 judgment and
decision making problems and principles from four comprehensive review
papers (Stanovich & West, 2000; Stanovich & West, 2008; Parker &
Fischhoff, 2005; Bruine de Bruine, Parker & Fischhoff, 2007). We
selected problems that had a clear normative principle to apply. This led
to the exclusion of a large number of framing problems, which test the
internal consistency of preferences across different representations as
opposed to the application of a rule. (For example, gain-loss framing
effects indicate inconsistent risk preferences, but there is no normative
answer for a given risk taking frame.) Furthermore, we focused on problems
with statistical principles over logical reasoning problems, as the former
have been more central in traditional JDM research. We caution against
generalization to broader categories of problems (e.g., non-statistical
problems) or situations (e.g., choices based on subjective preferences).
Our search process led us to select problems that illustrate six classic
JDM biases: the conjunction fallacy (Tversky & Kahneman, 1983),
probability matching (Stanovich & West, 2008), default bias (Ritov &
Baron, 1990), base rate neglect (Kahneman & Tverksy, 1973), denominator
neglect (Kirkpatrick & Epstein, 1992), and Cell A bias in covariation
problems (Wasserman, Dorner & Kao, 1990). Although we closely modeled
our problems on the ones from the above-cited sources, we modified them to
a greater or lesser extent, for three different reasons. First, we needed
problems that could be coded as clearly correct or incorrect. This created
a special issue for the base rate neglect problem, so we had to use a
revised version. Second, we needed to ensure that baseline performance in
the control condition was at least as accurate as random responding. If it
were not, any improvement in performance could potentially be explained by
an increased rate of random responding rather than more normative problem
performance. Third, our procedure called for two versions of each type of
problem to reduce measurement error. We therefore constructed a second
version of each problem keeping the same structure but changing the
content.
Problems to test access to inferential rules
A number of scholars have pointed out that to solve many JDM problems one
has to, at a minimum, have access to the relevant statistical rule
(Kahneman, 2000; Nisbett, 1993; Stanovich & West, 2008). What does it
mean to have access to a rule? One version of accessing a rule is that a
person can retrieve and apply an abstract representation of the formal
normative rule (e.g., P(A) ≤ P(A∩B) for conjunctions).
Another version is that a person has learned exemplars of the rule through
experience and generalizes from that experience when encountering new
problems. Nisbett (1993) and colleagues argued that rules can be learned
and stored at a level that is easily applied and generalized in everyday
contexts; people have a harder time learning and understanding abstract
rules stated as mathematical or logical relationships. For example, Cheng
and Holyoak (1985) showed that people can accurately test relationships
that involve permission and obligation (e.g., a customer can drink alcohol
only if she is at least 18 years of age) that they fail to evaluate
effectively when stated as an isomorphic logical principle (e.g., if p,
then q). Thus, we chose not to ask people about direct statements of
abstract rules. Instead, we measured whether a person could answer a
simple and transparent problem that requires access to the rule. Our key
goal in designing transparent problems was to minimize the presence of a
tempting but wrong intuitive answer that competes with application of the
rule.
Consider the Linda problem described in the introduction. This problem
requires access to the conjunction rule. However, it also has a tempting
incorrect answer because people tend to substitute assessments of
similarity for probability. The key to testing access to the conjunction
rule in this case is to remove the presence of a tempting incorrect
answer. Consider the following Sally problem.
Imagine Sally owns a car. Rank the following from most likely (=1) to least likely (=3):
(1) The car has Bluetooth speakers.
(2) The car is painted green.
(3) The car has Bluetooth speakers and is painted green.
Compared to Linda, there is less material provided with which to form an
impression of Sally and the types of activities she might engage in. The
Sally problem is transparent, so we count a person as having some access
to the rule if he or she judges the third option as the least likely.
We included two transparent questions measuring rule accessibility for each
of our six JDM problem types to reduce measurement error of rule
accessibility. Of course, these do not provide a complete picture of a
participant’s ability to retrieve and apply a rule across contexts. Yet, if
a participant cannot answer questions accurately in these two transparent
contexts, we argue that other individual differences such as a disposition
to reflect are less helpful for correctly answering standard JDM questions
in which intuition provides a conflicting response.
Problems to test individual differences
We measured individual differences primarily so that we could include these
variables in our regression analysis when measuring the effects of fast and
slow thinking. We were also interested in exploring certain
interactions. For example, it is plausible that low CRT individuals would
benefit more from a slow-thinking intervention because high CRT individuals
already tend to engage in reflection. Including scales such as the CRT
provided the opportunity to test for this. We included three scales: the
three-question CRT (Frederick, 2005), the four-question CRT-2 (Thomson &
Oppenheimer, 2016), and the four-question BNT (Cokely, Galesic, Schulz,
Ghazal & Garcia-Retamero, 2012).
The CRT is intended to assess a respondent’s disposition to reflect on and
potentially correct automatic System 1 responses. However, to perform well
on the CRT, respondents must not only have the disposition to reflect, but
they must also possess the knowledge to detect a possible need for
correction and then implement that correction (Kahneman, 2000). As the
problems on the CRT involve calculations (albeit relatively simple ones),
the CRT likely has a numerical reasoning component. To directly assess a
tendency to reflect, we also included the CRT-2 (Thomson & Oppenheimer,
2016), which does not depend on performing calculations to reach the
correct answers. Finally, we included the Berlin Numeracy Test (Cokely et
al., 2012). Many JDM problems are highly numeric and depend on such
reasoning skills, so variation in numeracy would likely add noise to
whether or not participants correctly solve a given JDM problem. Our
primary motivation for including the BNT was so that we could include this
variable in our regression analysis when studying the relationship between
our behavioral interventions and the rate of successful problem solving.
3.1.2 Participants
We recruited participants with US IP addresses using Amazon’s Mechanical
Turk platform (mTurk). Prospective participants were informed that they
should participate only if they intended to complete both stages. In Stage
1 we collected 2,199 responses, excluding 203 participants for failing an
attention check and 1 participant for failing to consent to return to
Stage 2 of the study. For Stage 2 we invited 1,995 participants to return,
collecting 1,869 responses. In Stage 2 we removed 147 participants who
failed an attention check, and 7 who stated that they had not completed
Stage 1. Both of these checks occurred at the start of the survey, prior
to random assignment to a condition. Of the remaining 1,715 observations,
we could match 1,709 participants’ Stage 2 responses to their responses in
Stage 1. We excluded 3 participants for not answering a question from
Stage 1. The resulting sample of 1,706 participants formed the basis of
our study.
The study was posted in four batches (i.e., separate HITs in mTurk) of 500
people each in October 2019. Each HIT had a similar attrition rate between
stages (12–16%). Stage 2 of each 500-person batch was made available 24
hours after the last member of the group completed Stage 1 and remained
accessible for one week. On average, participants waited about two days
before starting Stage 2 (M = 53.0 hours, SD = 24.1). The compensation for
Stage 1 of the study was $1.00. The compensation for Stage 2 was $1.50,
plus a bonus of $0.50 for returning to complete both stages, bringing
total compensation to $3.00. Our sample was 45.6% female.
3.1.3 Procedure
Procedure: Stage 1.
Participants were informed that this study was Stage 1 of
a two-stage study, and that they would be invited back to complete the
second stage for additional income 24 hours after the initial HIT was
completed. Participants were asked to identify their willingness and
ability to return for Stage 2 at both the start and the end of the Stage 1
study.
The inferential rule questions were divided into two blocks of six, with
each block containing one question for each rule. Participants began the
study by completing one block of inferential rule questions. Which block
they saw first was counterbalanced, as was the question order they saw
within a block. Each participant saw questions in one of six possible rule
orders that followed a Latin square design. These rule orders were the same
in each block. For example, if the question associated with a given rule
was presented in the kth position in the first block,
the other question associated with the same rule was presented in the
kth position in the second block.
After completing the first block, participants answered the 11 questions
from the CRT, CRT-2, and BNT in a randomly presented order, determined by
Qualtrics for each participant. Following this, they answered the six
questions from the other inferential rule block. There were no transitions
between these different parts of the study, so from the participants’ point
of view they simply answered a sequence of 23 questions, each presented on
a separate screen. Some questions contained multiple responses (e.g., the
probability matching rule question). When a question contained multiple
responses, all of these responses were placed on the same screen. After
completing all the questions, participants reported their sex, age, and
level of education. They also reported their mTurk identification number so
that we could contact them for Stage 2.
Procedure: Stage 2.
Using TurkPrime’s inclusion function (Litman, Robinson & Abberbock,
2016), we invited all the participants who completed Stage 1 back for
Stage 2 of the study. The JDM problems were divided into two blocks of
six, with each block containing one of each of the six types of problems
(the conjunction fallacy, probability matching, default bias, base rate
neglect, denominator neglect, and Cell A bias in covariation problems), in
a similar Latin square setup to Stage 1. As in Stage 1, each question
appeared on its own screen. There were no filler questions between the two
blocks.
Participants were randomly assigned to a problem type order condition that
determined the order of the questions in each block (following a Latin
square design), a block order condition, and a study condition.1 The study
conditions were control, Slow, Fast, Fast-slow
(within-subjects), and Incentive. After being assigned to a study
condition, participants were presented with instructions for the
study. These included the behavioral manipulation associated with their
study condition. We adapted the text for our conditions from previous work
studying the impact of fast and slow responding (Bago & De Neys, 2017).
Participants began by reading the instructions for their condition. These
instructions were as follows:
-
- Control Condition.
In this task we’ll present you with a set of problems. We will ask you to
respond to each problem with your best answer.
As each problem is presented, you can take all the time you want to
indicate your response. It is important that you give your best responses
to all the problems.
- Slow Condition.
In this task we’ll present you with a set of problems. We will ask you to
respond to each problem after actively reflecting on it.
As each problem is presented, you can take all the time you want to
actively reflect on it. Once you have made up your mind, you will then
enter your final response. You will have as much time as you need to
indicate your answer. As you read each problem, think about the possible
answers to the problem and select the one that you feel is most likely to
be correct. It is really crucial that you give your response after
reflecting on each problem deeply.
- Fast Condition.
In this task we’ll present you with a set of problems. We will ask you to
respond to each problem with your initial, intuitive answer.
As each problem is presented, you should answer with your initial
response—the very first answer that comes to mind. You don’t need to think
about it. Just give the first answer that intuitively comes to mind as
quickly as possible. It is really crucial that you give your first,
initial response as fast as possible.
- Fast-slow Condition.
In this task we’ll present you with a set of problems. We will ask you to
respond to each problem twice. First, respond with your initial, intuitive
answer. After submitting this answer, please respond to each problem again
after actively reflecting on it.
As each problem is presented, you should answer with your initial
response—the very first answer that comes to mind. You don’t need to think
about it. Just give the first answer that intuitively comes to mind as
quickly as possible. It is really crucial that you give your first,
initial response as fast as possible. After this, you can take all the
time you want to actively reflect on it. Once you have made up your mind,
you will then enter your final response. You will have as much time as you
need to indicate your answer. As you read each problem, think about the
possible answers to the problem and select the one that you feel is most
likely to be correct. It is really crucial that you give your final
response after reflecting on each problem deeply.
- Incentive Condition.
In this task we’ll present you with a set of problems. You will be paid a
bonus of $0.50 for a correct answer in a randomly selected question.
As each problem is presented, you should answer with the response that
gives you the best chance of earning the bonus payment. Once you have made
up your mind, you will enter your final response. You can take all the
time you want to indicate your response. It is really crucial to answer
problems correctly to increase your chances of winning the bonus payment.
| Table 1: The two inferential rule questions (Stage 1) and two JDM questions
(Stage 2) for the conjunction fallacy problem. |
| Measure | Inferential rule question | JDM question |
| 1 | Imagine Sally owns a car.
Rank the following from most likely (=1) to least likely (=3):
-
The car has Bluetooth speakers
- The car is painted green
- The car has Bluetooth speakers and is painted green
| Linda is 31 years old, single, outspoken and very bright. She majored in philosophy. As a student, she was deeply concerned with issues of discrimination and social justice, and also participated in anti-nuclear demonstrations.
Please rank the following five statements by their probability of being
true. (1 = most probable, 5 = least probable)
-
Linda is active in the feminist movement.
- Linda is a bank teller.
- Linda is a bank teller and is active in the feminist movement.
- Linda works in a bookstore and takes Yoga classes.
- Linda is an insurance salesperson
|
| 2 | Imagine Bill likes to play darts.
Rank the following from most likely (=1) to least likely (=3):
-
Bill misses the dartboard on his first throw.
- Bill is wearing a red sweater.
- Bill misses the dartboard on his first throw and is wearing a red
sweater.
| Bill is 34 years old. He is intelligent, but unimaginative,
compulsive, and generally lifeless. In school, he was strong in mathematics
but weak in social studies and humanities.
Please rank the following five statements by their probability of being
true. (1 = most probable, 5 = least probable)
-
Bill is an accountant.
- Bill plays jazz for a hobby.
- Bill is an accountant who plays jazz for a hobby.
- Bill surfs for a hobby.
- Bill is an architect.
|
Manipulations
To reinforce the manipulations, participants were asked to respond to an
open-ended question asking for their interpretation and understanding of
the manipulation. Before beginning to answer the problems, participants
were asked to state how willing they were to comply with the experimental
instructions, for example, ‘How willing are you to keep answering each
problem as fast as possible with the first answer that comes to mind, then
answering again after reflecting on the problem deeply?’ Participants
indicated on a sliding scale from 0 to 100 how willing they were to
continue to comply with these instructions. After completing their first
block of six JDM questions, participants were then asked to recommit to
the experimental instructions. Participants then continued to answer the
second block of six JDM questions.
Full details of the study manipulations are included in the supplement. The
structure for the study was similar to that of Stage 1. Of the resulting
variables, Order denotes one of the six Stage 2 problem type
orders from the Latin square, Block Order denotes whether the
focal question was presented in the first or second block of JDM
questions, and Measure denotes which of the two measures the
observation corresponds to within a problem type (e.g., there were two
conjunction fallacy problems: the Linda question, or the Bill the
accountant question, Table 1). Our initial analyses focused on comparisons
among control, Fast, Slow, and Incentive conditions (n =
1471). (Subsequent analyses include tests using the Fast and
Slow responses from the Fast-slow within-subjects
condition.)
3.2 Results
3.2.1 Analytical approach
We used dummy-coded condition variables and continuous individual
difference variables to predict performance on our JDM problems at a
question level. Each participant provided 12 responses to JDM problem
questions. Responses to the three questions of the CRT (Frederick, 2005)
were coded into a score between 0 and 3. Responses to the four questions
of the CRT-2 (Thomson & Oppenheimer, 2016) were coded into a score
between 0 and 4. Responses to the four questions of the Berlin Numeracy
Test (Cokely et al., 2012) were coded into a score between 0 and 4. We
constructed a variable RuleSpecific that took the
value of 0, 1 or 2, depending on how many of the inferential rule
questions were answered correctly for a specific problem type. Note that
Stage 1 measures of the specific inferential rules (two questions such as
the Sally and Bill-playing-darts problems presented above) were measured
independently of and at least 24 hours before Stage 2 measures of a JDM
problem (two questions such as the Linda problem presented above). A
participant’s score for the two measures that make up
RuleSpecific were used to predict their
performance on the two JDM problems that make up the DV corresponding to
that inferential rule. Inferential rules, CRT, CRT-2, and BNT were
mean-centered across the full sample (including the Fast-slow
observations) for all of our analyses. Our dependent variable was whether
or not a question was answered correctly.
| Panel A | | Panel B |
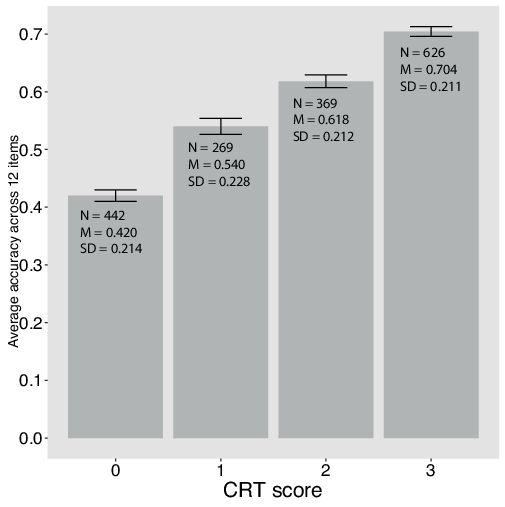 | | 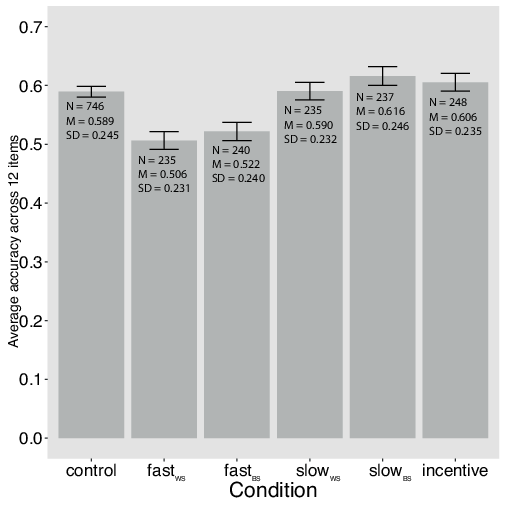 |
Figure 1: The average accuracy across 12 problems by CRT score (Panel A)
and study condition (Panel B).
Note. Error bars indicate plus or minus 1 standard error. The cell
size and mean and standard deviation of the percentage of JDM questions
answered correctly is indicated on the bars. fastWS refers
to the within-subjects fast response, fastBS to the
between-subjects fast condition, slowWS refers to the
within-subjects slow response, and slowBS to the
between-subjects slow condition. |
For our analyses, we used Generalized Estimation Equations (GEE) to
estimate logistic regression models. A GEE is used to estimate the
parameters of a generalized linear model where outcomes may be correlated
(e.g., responses nested within a subject). We clustered these data by
participant. To conduct this analysis, we used the ‘geepack’ package
(Hojsgaard, Halekoh & Yan, 2016) for R. We specified a binomial
distribution family with a logit link, as our outcome data is binary, and
specified an ‘exchangeable’ correlation between responses, following
guidelines to minimize the Quasi Information Criterion (Hardin
& Hilbe, 2003; Pan, 2001; Hin & Wang, 2009).
Our data contained two measures of each participant’s response to each of
the six JDM problems. We included a Problem effect (for each of
the 6 JDM problems) and a Measure effect for whether the problem
answered was the first measure or the second (e.g., Linda the bank teller
or Bill the accountant, right column, Table 1). We decomposed the
Order variable into five dummy-coded Position effect
variables (e.g., a dummy variable for third position would take the value
of 1 if this question was presented in position 3 in its block, 0
otherwise), using first position as the omitted category. We also included
a Block Order variable, signifying whether the question was in
the block of JDM questions presented first or second. We do not report
these nuisance factors in the main manuscript, but the full model
estimates can be seen in the supplement.
| Table 2: Logistic regressions predicting success with intervention
conditions coded relative to control and with individual differences mean
centered. |
| Model | 1 | 2 | 3 | 4 | 5 |
| (Intercept) | -0.452*** | -0.470*** | -0.455*** | -0.448*** | -0.478*** |
| | (0.071) | (0.073) | (0.074) | (0.072) | (0.074) |
| Slow | 0.126 | 0.155† | 0.139† | 0.131 | 0.155* |
| | (0.085) | (0.080) | (0.083) | (0.083) | (0.079) |
| Fast | -0.314*** | -0.371*** | -0.329*** | -0.358*** | -0.377*** |
| | (0.080) | (0.077) | (0.077) | (0.079) | (0.076) |
| Incentive | 0.065 | 0.116 | 0.115 | 0.071 | 0.121 |
| | (0.081) | (0.079) | (0.077) | (0.077) | (0.075) |
| Education | 0.035 | -0.006 | 0.037 | -0.014 | -0.016 |
| | (0.026) | (0.024) | (0.025) | (0.025) | (0.024) |
| CRT | | 0.446*** | | | 0.256*** |
| | | (0.023) | | | (0.028) |
| CRT-2 | | | 0.418*** | | 0.201*** |
| | | | (0.024) | | (0.029) |
| BNT | | | | 0.410*** | 0.241*** |
| | | | | (0.027) | (0.028) |
| N | 17,652 | 17,652 | 17,652 | 17,652 | 17,652 |
| Note. *** p < 0.001, ** p < 0.01, * p
< 0.05, † p < 0.10. |
| The coefficient estimates for Measure,
Problem, Position, and Block Order effects are
included in the SI (Table S1). |
3.2.2 Data analysis
Individual differences.
In Panel A of Figure 1, we plot the percentage of JDM questions answered
correctly (out of 12) by score on the CRT (0, 1, 2, 3). Average
performance was monotonically increasing in CRT, with a one-point increase
in the CRT associated with a 9.5 percentage point increase in accuracy.
All three of the marginal movements between CRT levels were statistically
significant (p < 0.001) in predicting greater average
accuracy across the 12 JDM questions. Across all conditions, participants
with a CRT score of 0 had an average accuracy of 42.0%, which rose to
70.4% for participants with a CRT score of 3. Given that the α of
the full 11 questions from our individual difference measures (CRT, CRT-2,
and BNT) was 0.77, we also plotted the average number of JDM questions
answered correctly by score out of the 11 pooled individual difference
questions (Figure S1 in the supplement).
We found that CRT, CRT-2 and BNT all explained unique variance in
performance in our battery of JDM questions. Whether we introduced each
individual difference measure by itself or included all three measures, we
found that all of the individual difference measures were statistically
significant positive predictors of success on our JDM questions (p
< 0.001; Models 2–5; Table 2). Based on this evidence,
we find positive support for Question 1 – higher scores on individual
difference measures including the CRT were associated with higher accuracy
on JDM questions.
| Table 3: Descriptive Statistics of JDM Question Performance and Log Time
Taken in the Between-Subjects Sample. (N = 1471.) |
| | | JDM questions correct |
Average log time | Exp (avg. log time |
Follow % |
Rulestotal |
|
Condition | Count | M | SD | M | 95% CI | M | M | M | SD |
| Control | 746 | 7.07 | 2.94 | 3.5 | [3.45,3.54] | 33.0 | 94.0 | 9.21 | 2.93 |
| Fast | 240 | 6.26 | 2.88 | 3.22 | [3.15,3.30] | 25.1 | 93.6 | 9.10 | 2.98 |
| Slow | 237 | 7.39 | 2.95 | 3.71 | [3.63,3.80] | 40.8 | 96.0 | 9.46 | 2.84 |
| Incentive | 248 | 7.27 | 2.82 | 3.56 | [3.48,3.64] | 35.2 | 95.9 | 9.00 | 2.90 |
| Note. JDM Questions Correct is the average number of JDM questions
answered correctly (out of 12). Average log time is the average of the log
time taken to provide a response to a JDM question within a condition. Exp
(avg. log time) is this average exponentiated. Follow % is the average
response participants’ provided to a self-report regarding the extent to
which they followed our experimental instructions, on a percentage scale
from 0 to 100. RulesTotal is the average number of
inferential rule questions answered correctly (out of 12).
|
Fast thinking, slow thinking, and control.
Manipulation check.
We performed two manipulation checks to test the efficacy of our
Fast versus Slow manipulations. First, in a separate
pilot, we tested whether our manipulations were effective in changing
performance in the bat-and-ball task (Frederick, 2005) in a
between-subjects design. This question was answered correctly by 29 of 83
(35%) participants in the Slow condition, compared to 23 of 106
(22%) participants in the Fast condition (Fisher’s exact
p = 0.050). The pilot also included a separate Fast-slow
within-subjects condition. Here, only 8 of 88 (9%) answered the question
correctly on their initial fast answer, whereas 28 (32%) answered it
correctly on their final slow answer (McNemar’s χ 2 = 38.2, p
< 0.001).2 These tests provide evidence that
our behavioral interventions can replicate previously observed effects in
improving performance in problems.
| Table 4: Logistic regressions predicting success with conditions coded
relative to Fast and with individual differences mean centered |
Model | 6 | 7 | 8 |
(Intercept) | -0.842*** | -0.867*** | -0.868*** |
| | (0.091) | (0.091) | (0.091) |
Control | 0.377*** | 0.350*** | 0.348*** |
| | (0.076) | (0.071) | (0.070) |
Slow | 0.532*** | 0.439*** | 0.437*** |
| | (0.094) | (0.088) | (0.087) |
Incentive | 0.498*** | 0.497*** | 0.500*** |
| | (0.091) | (0.083) | (0.083) |
CRT | 0.256*** | 0.117*** | 0.117*** |
| | (0.028) | (0.027) | (0.027) |
CRT2 | 0.201*** | 0.013 | 0.012 |
| | (0.029) | (0.027) | (0.027) |
BNT | 0.241*** | 0.177*** | 0.177*** |
| | (0.028) | (0.026) | (0.026) |
Education | -0.016 | 0.034 | 0.035 |
| | (0.024) | (0.021) | (0.021) |
Rulespecific | | 0.577*** | 0.452*** |
| | | (0.033) | (0.071) |
Rulenon−specific | | 0.185*** | 0.185*** |
| | | (0.011) | (0.011) |
Control X Rulespecific | | | 0.142† |
| | | | (0.082) |
Slow X Rulespecific | | | 0.138 |
| | | | (0.101) |
Incentive X Rulespecific | | | 0.188† |
| | | | (0.099) |
N | 17,652 | 17,652 | 17,652 |
| Note. *** p < 0.001, ** p < 0.01, * p
< 0.05, † p < 0.10. |
| The coefficient estimates for Measure,
Problem, Position, and Block Order effects are
included in the SI (Table S2). |
Our second manipulation check examined the average time taken on the JDM
questions across conditions in Stage 2 (Table 3). The average log time
taken on the JDM questions was significantly longer in the Slow
condition relative to both the Fast condition (p
< 0.001) and the control condition (p <
0.001). The average time taken in the control and Incentive
conditions were similar and landed between the Fast and
Slow conditions. We conclude that our Fast and Slow
manipulations had the intended effect on time spent answering our
questions.
Tests of Slow versus
Fast
Question 2 asked whether slow thinking would lead to more accurate
decisions than fast thinking. For this analysis, we tested dummy-coded
conditions against the Fast condition, which was the omitted
category. Model 6 of Table 4 shows that participants in the Slow
condition were significantly more accurate than those in the Fast
condition (b = 0.532, p < 0.001). Model 6
also shows that participants in the control condition were significantly
more accurate than participants in the Fast condition (b
= 0.377, p < 0.001). Participants in the Fast
condition had an average accuracy of 52.2%, relative to 58.9% in the
control condition and 61.6% in the Slow condition. In recent
meta-analytic work (Rand, 2019), researchers found that the difference
between intuitive and deliberative thinking conditions on the rate of
cooperation in economic games ranged from 1.6-3.1 percentage points. In
our context, we find a 9.4 percentage point difference between
Fast and Slow thinking conditions. This is a larger
effect.
| Table 5: Logistic regressions predicting success with conditions coded
relative to control and with individual differences mean centered. |
| Model | 9 | 10 | 11 | 12 | 13 |
| (Intercept) | -0.518*** | -0.520*** | -0.538*** | -0.529*** | -0.541*** |
| | (0.076) | (0.076) | (0.076) | (0.076) | (0.076) |
| Slow | 0.089 | 0.089 | 0.082 | 0.072 | 0.077 |
| | (0.071) | (0.071) | (0.071) | (0.072) | (0.071) |
| Fast | -0.350*** | -0.348*** | -0.341*** | -0.326*** | -0.338*** |
| | (0.071) | (0.070) | (0.072) | (0.072) | (0.072) |
| Incentive | 0.148* | 0.152* | 0.158* | 0.147* | 0.144* |
| | (0.065) | (0.066) | (0.066) | (0.067) | (0.065) |
| CRT | 0.117*** | 0.117*** | 0.171*** | | |
| | (0.027) | (0.027) | (0.023) | | |
| CRT-2 | 0.013 | 0.012 | | 0.111*** | |
| | (0.027) | (0.027) | | (0.024) | |
| BNT | 0.177*** | 0.177*** | | | 0.207*** |
| | (0.026) | (0.026) | | | (0.025) |
| Education | 0.034 | 0.035 | 0.046* | 0.065** | 0.039† |
| | (0.021) | (0.021) | (0.021) | (0.022) | (0.021) |
| Rulespecific | 0.577*** | 0.594*** | 0.621*** | 0.622*** | 0.643*** |
| | (0.033) | (0.045) | (0.034) | (0.033) | (0.034) |
| Rulenon−specific | 0.185*** | 0.185*** | 0.199*** | 0.212*** | 0.207*** |
| | (0.011) | (0.011) | (0.011) | (0.011) | (0.010) |
| Slow X Rulespecific | | -0.004 | | | |
| | | (0.085) | | | |
| Fast X Rulespecific | | -0.142† | | | |
| | | (0.082) | | | |
| Incentive X Rulespecific | | 0.046 | | | |
| | | (0.083) | | | |
| CRT X Rulespecific | | | 0.087*** | | |
| | | | (0.026) | | |
| CRT-2 X Rulespecific | | | | 0.064** | |
| | | | | (0.024) | |
| BNT X Rulespecific | | | | | 0.157*** |
| | | | | | (0.030) |
| N | 17,652 | 17,652 | 17,652 | 17,652 | 17,652 |
| Note. *** p < 0.001, ** p < 0.01, * p
< 0.05, † p < 0.10 |
| The coefficient estimates for Measure,
Problem, Position, and Block Order effects are
included in the SI (Table S9). |
A good deal of previous research has used an individual difference, CRT, to
demonstrate the benefits of fast thinking and slow thinking. Figure 1,
Panel A, shows similar benefits in these data. Our current design allows us
to assess the degree to which experimental interventions have a similar
impact to those shown using CRT. To examine this, we plotted the average
percentage of JDM questions answered correctly out of 12 by study condition
in Figure 1, Panel B. The difference in average percent correct between our
between-subjects Fast and Slow conditions (9.4%) was
approximately equal to the difference between each ascending pair of
averages grouped by CRT score (9.5%). In other words, the average
difference in performance between asking respondents to engage in fast
thinking and slow thinking was approximately equivalent to the average
difference in performance between two respondents whose CRT scores differ
by one point.
We note that even when engaging in slow thinking, many participants failed
to answer problems correctly; even when engaging in fast thinking, many
participants reached the correct answers. In our data many people reasoned
well intuitively, consistent with recent accounts of the “smart intuitor”
(Raoelison, Thompson & De Neys, 2020). For reference, across all five
conditions there were 23 participants who answered zero individual
difference questions correctly, who achieved an average accuracy across the
12 JDM questions of 29.7%. Relative to this level of performance (29.7%
accuracy) participants in the Fast condition were considerably
more successful (52.2% accuracy).
The strength of these effects varied to a modest degree across our six JDM
problems. The greatest difference between our Fast and
Slow conditions was observed for the denominator neglect
question; the smallest difference was seen for the default bias problem
(see Table S3 in the supplement for further details).
Tests of
Fast and Slow versus the control
In order to identify the specific effects of fast thinking and slow
thinking, we ran analyses using dummy-coded intervention variables with
the control group coded as the omitted category. In Table 2 we present
estimates of the effects of our different behavioral interventions.
We found a robust, negative effect of our Fast manipulation on the
likelihood of responding correctly in our JDM questions (p
< 0.001; Models 1-5). This suggests that the answer to
Question 3a is yes – encouraging fast thinking does hurt performance
relative to the control level. However, the effect of our slow thinking
manipulation was more dependent on model specification. The coefficient on
our Slow manipulation was positive, but attained statistical
significance only in Model 5 (b = 0.155, p = 0.049). This
result provides an equivocal answer to Question 3b. There was a small
effect of our slow thinking manipulation relative to the control. The
coefficient’s magnitude was similar across models. However, it reached a
p-value of .05 only after controlling for all of the individual
difference measures (CRT, CRT-2, and BNT) simultaneously. Later analyses
(Table 5) that include Rule variables show a smaller coefficient
for Slow and the Slow condition is not significantly
different from the control in any specification. We see in Table 3 that
this is likely due to participants in the Slow condition
performing slightly better on Rule items than did participants in
the control condition.
Our results support the general conclusion that fast thinking hurts, and
slow thinking helps. But the magnitude of the coefficients suggest that
the effects are not symmetric relative to the control. Whereas the
intervention Fast harmed performance accuracy by 6.7 percentage
points, Slow yielded a gain of only 2.7 percentage points,
relative to the control. We believed that participants may be more
motivated to respond quickly (which is easier) than slowly and
thoughtfully (which is more effortful and costly). Consequently, it is
possible that participants in the Fast condition may have
complied with our experimental manipulations to a greater degree than
those in the Slow condition. To explore this possibility, we
conducted several robustness checks where we trimmed the data based on
either response time or self-reported compliance (Table S4). The results
of these models were broadly consistent with the trends we see in the main
analyses—Fast appears to harm performance more than Slow
helps across multiple subsamples of the data that attempt to address
compliance issues in different ways.
We also looked for problem-level differences in the benefits of slow
thinking relative to a control. There is some evidence that there is a
benefit to Slow thinking relative to the control for the base
rate problem (77% correct versus 71% correct). See Table S3 for
participants’ accuracy in each problem across our conditions. The base rate
problem differed somewhat from our other questions, in that the coding of a
correct answer required setting a threshold for a correct answer that
implied a normative likelihood ratio. We augment our main analyses by
providing analysis of the raw responses (i.e. the probabilities
participants provided) to each of the base rate questions in Table S5. We
found that our Slow manipulation negatively predicted
participants’ estimated probabilities (i.e., indicated smaller deviations
from the base rate of 10%) for measure 1 but not measure 2 of our measure
of performance in base rate problems. We are reluctant to draw any
conclusions from inspecting one question out of our original 12.
Access to inferential rules.
One question of primary interest in the present research was whether
problem-specific rule knowledge would significantly predict performance in
a matched problem that requires knowledge of that specific rule. We
distinguish between three different variables in our regression analyses;
RuleSpecific, RuleTotal,
and RuleNon-specific. When considering a single
measure of a single JDM problem (for example the Linda version of the
conjunction problem), a participant had a score out of 2 denoting how many
of the corresponding Rule questions they answered correctly
(RuleSpecific). That participant also had a score
out of 12 for how many Rule questions they answered correctly in
total across all problem types (RuleTotal). We
computed the difference between these two scores to get the number of
non-focal rule questions the participant answered correctly, as a score
out of 10 (RuleNon-specific). In all of our
models that make reference to RuleSpecific, we
also include this variable RuleNon-specific.
To confirm that the two questions making up the
RuleSpecific measure were in fact tapping into a
construct that was similar, but different from general rule knowledge, we
assessed two correlations: those between the two related questions and
those between all combinations of unrelated questions. We found that the
average correlation between the two measures of the same rule was
r = 0.50, whereas the average correlation between measures of
different rules was r = 0.27 (see Table S6 in the SI).
The higher correlations between our measures of the same rule are
suggestive that our RuleSpecific
variable does measure something specific to their matched problems,
rather than general statistical knowledge.
Table 4, Model 7 shows that having access to a specific rule
(RuleSpecific) predicted better performance on its related JDM problem (b =
0.577; p < 0.001) when including CRT, CRT2, BNT and RuleNon-specific in the
regression equation. Having non-specific Rule knowledge appeared to be
beneficial as well (b = 0.185; p < 0.001).
Table 4, Model 7 shows that having access to a specific rule
(RuleSpecific) predicted better performance on its
related JDM problem (b = 0.577; p < 0.001) when
including CRT, CRT2, BNT, and RuleNon-specific in
the regression equation. Having non-specific knowledge appeared to be
beneficial as well (b = 0.185; p < 0.001).
A complication in interpreting the relative magnitudes of the rule
coefficients in Model 7 is that the rule scales include different numbers
of items. To address this, we ran additional regressions comparing the
coefficients of RuleSpecific with that of a
2-item non-specific rule measuring access to a randomly selected
rule from the other five rules—RuleRAND.
Across 500 different randomly drawn sequences of
RuleRAND, the coefficient on
RuleSpecific had a mean of 0.579 and a SD of
0.0042. In contrast, the coefficient on RuleRAND,
had a mean of 0.1726 and a SD of 0.0283. The coefficient for
RuleSpecific was larger in all 500 regressions.
Having specific rule knowledge clearly improved performance more
than general statistical knowledge as measured by randomly-drawn
non-specific rule items. See the Additional Analysis in the supplement for
further details.
To put the effect size of our RuleSpecific and
RuleNon-specific questions in context, we
evaluated average performance at different levels of
RuleSpecific (0, 1, 2) and compared it to the
average performance at different levels of performance in other
inferential rule items, on a comparable scale from 0 to 2. In our control
condition, average accuracy on JDM questions ranged from 26.5% with a
RuleSpecific score of 0 to 68.5% with a
RuleSpecific score of 2, a change of 42 percentage
points. Averaged across the results for the other five, non-focal
Rule measures (i.e., each two-item measure of a non-specific
Rule), performance ranged from 35.6% at a score of 0 to 66.3% at
a score of 2, a change of 30.7 percentage points. These results further
show that specific rule knowledge appears to have a larger benefit than the
benefit associated with whatever general statistical knowledge to which one
might have access.
In Question 4 we asked whether access to a specific inferential rule
measured in a simpler, more transparent context questions (such as
answering the transparent conjunction rule question regarding Sally’s car
paint and speakers) would predict performance on its matched JDM problem
in our study. The evidence is strongly in favor of this assertion -
specific knowledge predicts better performance on matching JDM questions
across a range of specifications.
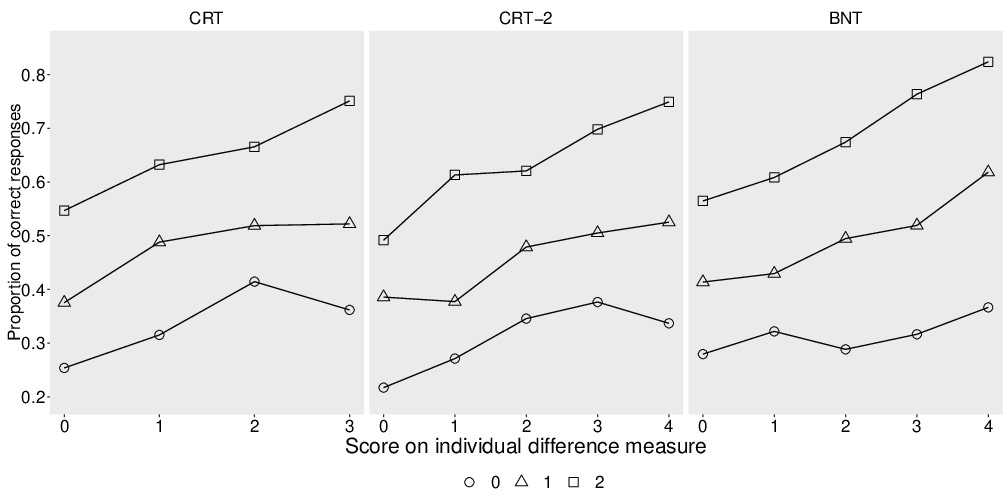
Figure 2: Proportion of correct responses on JDM questions by
RuleSpecific score and score on individual difference
measures.
Note. Each panel looks at the proportion of correct responses
across the levels of a different individual difference measure (CRT,
CRT-2, BNT) at each level of RuleSpecific (0, 1,
2 – indicated by the shape that plots the line). |
Inferential rules as a moderator of individual differences
The prior section examined the main effect of access to inferential rules
on task performance. In Question 5 we also asked whether particular
individual differences would be more beneficial to task performance for
participants who had better access to inferential rules. Multiple tests
suggested that this was the case. In Models 11–13 (Table 5) we observed
significant positive interactions between
RuleSpecific and CRT (b = 0.087;
p < 0.001), RuleSpecific and CRT-2
(b = 0.064; p = 0.008), and
RuleSpecific and BNT (b = 0.157;
p < 0.001). These interactions were robust to the
inclusion of interaction terms between the individual difference measures
and the RuleNon-specific variable (Models
11a-13a; Table S9). We did not include all three
Rule-Specific X Individual Difference
interactions at the same time due to collinearity concerns. In another
robustness check, we included the variable
RuleTotal (a participant’s score out of 12 for all
rule questions answered correctly), as well as our
RuleSpecific variable in our analyses. When
including this RuleTotal variable, the main effect
of RuleSpecific and its interactions with our
individual difference measures remained statistically significant
(Table S10). This shows further evidence that problem-specific
rules have predictive power for decision making accuracy over and above a
general measure of statistical knowledge.3
To illustrate these interactions, Figure 2 plots the proportion of correct
responses to JDM questions across scores on the individual difference
measures (the X-axis in each plot) and performance on the
RuleSpecific variable broken out as separate
lines to reflect each level of the RuleSpecific
score (0, 1, or 2). The raw data (which includes 12 observations per
participant) illustrate the same pattern found in the logistic regression
models. Access to the rule yielded a larger benefit among those high in
CRT, CRT-2, or BNT than among those low in these abilities. The fanning
interactions illustrate that more reflective cognitive dispositions confer
a greater boost to those who have access to the rule than those who do not
(Kahneman, 2000; Nisbett, 1993; Toplak, West & Stanovich, 2011).
Inferential rules as a moderator of behavioral interventions
In order to understand the moderating effect of access to the relevant
inferential rule on the impact of our behavioral interventions, we first
interacted the variable RuleSpecific with our
interventions, using Fast as the omitted condition. As shown in
Model 8 (Table 4), the interactions were suggestive, although
none of them reached the pre-determined threshold for significance of
α = 0.05. The interaction between
RuleSpecific and control (b =
0.142; p = 0.082) came close to achieving significance,
but the interaction between the RuleSpecific and
Slow was not significant (b = 0.138; p =
0.175). In Table S2, estimates for these interactions can be found when
also interacting our conditions with the
RuleNon-specific variable. None of these were
significant, although the interaction with control again came close.
Our primary analyses concern the effects of our interventions relative to a
control condition. In Question 6a and Question 6b we asked whether
participants who had access to the relevant rule would be particularly
helped in the Slow condition and particularly harmed in the
Fast condition, relative to a control. In Table 5 (Model
10), we see that there was no evidence of a positive interaction between
Slow and RuleSpecific (b =
−0.004; p = 0.959). However, we found some evidence for the
effects of our Fast manipulation being more harmful to those who
had access to the relevant inferential rule (b = −0.142;
p = 0.082). When including the interaction between Fast
and RuleNon-specific (Model 10a, Table
S9), the magnitude of this effect was slightly reduced (b =
−0.123; p = 0.138).
To follow up on this, we re-ran the model with condition coded as either
Fast or Not Fast. In principle this could
increase power, because Fast is being compared to all the other
conditions as opposed to the control alone. Although the test was
formally inconclusive, the Fast X
RuleSpecific interaction again indicated that
being sped up may be particularly harmful for those who have access to the
relevant inferential rule (b = −0.150; p =
0.051; Model 8b; Table S2).
In a different approach, when using linear regression to predict the total
number of questions answered correctly, there is a significant negative
interaction between the number of Rule questions answered
correctly (RuleTotal) and our Fast
manipulation (Model 3, Table S11; b = -0.126, p = 0.014).
However, this methodology loses the specificity of matching Rule
measures to corresponding problems.
On the whole, these results provide some evidence that when cognitive
processes are impaired by a fast thinking manipulation, performance is
hurt, particularly if one has access to the relevant inferential rule. We
stress the need for caution in interpreting this interaction – while floor
or ceiling effects are not likely (average accuracy across the
between-subjects conditions was 58.5%), this interaction was sensitive to
what variables were included in the regression equation. We find no
support for the notion that, relative to a control, our Slow
intervention worked better for those who had access to the relevant
inferential rule. This stands in contrast to the interactions we found
between our individual difference measures and
RuleSpecific as described in the previous
section. For example, those high in CRT had a greater benefit to response
accuracy from higher levels of rule accessibility than the benefit to
those who were low in CRT.
| Table 6: Logistic regressions predicting success with conditions coded
relative to control and with individual differences mean centered,
including half of the within-subjects observations. |
| Model | 14 | 15 |
| (Intercept) | -0.442*** | -0.468*** |
| | (0.070) | (0.071) |
| Fastbetween | -0.368*** | -0.376*** |
| | (0.075) | (0.075) |
| Fastwithin | -0.439*** | |
| | (0.071) | |
| Slowbetween | 0.153* | 0.155* |
| | (0.078) | (0.079) |
| Slowwithin | | -0.042 |
| | | (0.076) |
| Incentive | 0.120 | 0.123 |
| | (0.074) | (0.075) |
| CRT | 0.252*** | 0.268*** |
| | (0.026) | (0.026) |
| CRT-2 | 0.199*** | 0.197*** |
| | (0.026) | (0.026) |
| BNT | 0.233*** | 0.221*** |
| | (0.025) | (0.026) |
| Education | -0.017 | -0.018 |
| | (0.022) | (0.022) |
| N | 20,472 | 20,472 |
| Note. *** p < 0.001, ** p < 0.01, * p
< 0.05, † p < 0.10 |
| The coefficient estimates for Measure,
Problem, Position, and Block Order effects are
included in the supplement (Table S12). |
Incentives for accuracy.
Including an incentive condition in our study design enabled us to compare
how participants performed when the stakes were raised relative to our
other conditions. In Figure 1 (Panel B) we see that participants
in the Incentive condition had about 8 percentage points higher
average accuracy relative to participants in the Fast condition,
but only about 2 percentage points better accuracy than participants in
the control condition. Measured relative to our control, the effect of our
Incentive condition did not attain statistical significance
across models 1–5 (Table 2). (In Table 5, we estimated regression models
including our Rule variables, and found a positive effect of
Incentive (b = 0.148; p = 0.023; Model
9).
The answer to Question 7 is mixed. Overall, incentives yielded a
significant benefit relative to the Fast condition, but a small
benefit relative to the control, and its significance depended on model
specification (in this case, the inclusion of the Rule
variables).
One reason why incentives may be ineffective relative to the control
condition is that participants do not possess the cognitive capital to
improve their problem performance (Camerer & Hogarth, 1999). In Table 5,
we looked at the interactions between our manipulations relative to our
control condition and access to inferential rules. None attained
statistical significance. The interaction between Rulespecific and the
Incentive condition (b = 0.046, p =
0.575; Model 10) did not come close to significance.
Overall, we do not see large effects of incentives or slow thinking, and
their significance is dependent on model specification. Given that the
magnitude of the two was similar, however, encouraging slow thinking might
be a more cost-effective alternative for improving performance than
offering incentives.
Comparing between- and within-subjects tests of fast thinking
and slow thinking
Previous research has examined fast thinking vs slow thinking using a
within-subjects design in which respondents provided two responses in
succession: An initial ‘intuitive’ answer and a final answer after
reflection (Bago & De Neys, 2017). Our design allowed us to compare the
esults derived from this within-subjects framework with our
between-subjects design. Importantly, the two-response paradigm elicited
the expected performance differences between the two responses:
Participants achieved 50.7% accuracy in the
Fastwithin response and 59.1% accuracy
in the subsequent Slowwithin response.
To analyze the within-subjects responses, we split each participant’s
responses into their first (Fastwithin) and final
(Slowwithin) responses, and used them in separate
models that each performed between-subjects tests. We estimated two
logistic regression models using our GEE procedure, including either the
Fastwithin or the
Slowwithin responses from the within-subject
condition, along with the full sample of our between-subjects design that
included the corresponding intervention conditions analyzed earlier (which
we label Fastbetween and
Slowbetween in this section to minimize
confusion). Models 14 and 15 can be seen in Table 6. Both models use the
control condition as the omitted category for testing the intervention
dummy variables.
The traditional critique of the two-response paradigm suggests that the
initial Fastwithin response will impede successful
reasoning in the second, Slowwithin response. We
do not find support for this critique of the two-response paradigm:
Participants’ Slowwithin responses were not
significantly worse than the control condition (b = −0.042;
p = 0.580), consistent with other research (Bago & De Neys,
2019a). Our design also allows us to test a different concern: Do the
Slowwithin responses of the two-response paradigm
achieve similar performance to the between-subject
Slowbetween condition? In Model 15, we show that
although the Slowbetween manipulation predicts
better decision making relative to the control (b = 0.155;
p = 0.049), the Slowwithin condition
(i.e. the second responses of participants in the two-response paradigm) is
not close to being significantly better than the control condition.
Re-estimating Model 15 using the Slowwithin
condition as the omitted category (Table S12; Model 15a) reveals
that subjects’ answers in the Slowbetween
condition were significantly more accurate than those in the
Slowwithin condition (b = 0.197; p =
0.037). However, when we include RuleSpecific and
RuleNon-specific in a regression equation
performing this test, the difference shrinks and no longer attains
statistical significance (b = 0.165; p = 0.061). This could be
due to participants performing slightly better on our Rule items
in the Slowbetween condition (M = 9.50)
relative to our Slowwithin condition (M
= 9.43). Consequently, we emphasize the need for caution in interpreting
these results. It seems that after accounting for the effect of
Rule scores, our between-subjects Slow condition
performs slightly better than our within-subjects Slow responses,
but neither Slow condition differs significantly from the
control.
4 General Discussion
Previous research has not regularly simultaneously compared fast thinking
and slow thinking to a control group. The current research suggests that
fast thinking is indeed harmful to the accuracy of statistical judgments,
but the benefits of slow thinking are smaller. Speeding people up and
asking them to make an intuitive judgment hurts performance, replicating
previous findings (Evans & Curtis-Holmes, 2005; Villejoubert, 2009). In
contrast, an intervention to encourage slow thinking had a beneficial
effect relative to the control, but this appears to be at least partly a
result of random variation in rule scores across conditions. When
accounting for the effects of rules, there was no significant benefit of
slow thinking relative to a control, but still a benefit of slow thinking
relative to fast thinking. The present research provides initial evidence
that, compared to a baseline control group, encouraging slow thinking has
limited benefits for canonical, statistical JDM problems.
We replicate past work by finding large and reliable effects of individual
differences on JDM problem performance (Frederick, 2005; Oeschssler et al.,
2009; Koehler & James, 2010). Individual difference
effects, as often studied in past work, are useful standards against which
to compare the benefits of interventions. We find that inducing subjects
to switch from fast to slow thinking has the same sized benefit as
improving a decision maker’s score by 1 point on the 4-point CRT scale.
This difference is driven more by the harm of fast thinking than by the
benefit of slow thinking (compared to a control group).
We find support for the theoretical importance of rules (Nisbett, 1993) as
a component of dual-system frameworks (Kahneman, 2000; Sloman, 1996). We
measure participants’ performance in simple statistical problems to
ascertain whether individuals have access to the knowledge relevant to a
focal JDM task. People’s ability to use this knowledge in easier problems
predicts their success at applying it to harder problems that invite
competing intuitive responses. Notably, we find that performance in matched
rule questions (questions that measure access to the specific rule
underpinning the focal problem) appears to be more predictive of problem
success than performance in other rule questions. Our variable
RuleSpecific was predictive of task success when
including individual difference measures (CRT, CRT-2, BNT) and access to
other, non-specific rules in our regression formulae. Accuracy in
answering JDM questions in our control condition improved by 42 percentage
points across levels of the RuleSpecific measure
(from 0 to 2), a magnitude comparable to improvement observed across the
range of CRT (0 to 3). This effect is larger than that observed with a
2-point improvement on a different rule question of 30.7 percentage
points. Taken together, our results show that there is a larger benefit to
rule-specific knowledge than that conferred by knowledge of
statistical rules in general.
We also find suggestive evidence that speeding people up is particularly
damaging when decision makers have access to the relevant inferential rule
– having to engage in fast thinking appears to disrupt access to and the
ability to apply relevant knowledge. In sum, our results suggest that both
the knowledge one has access to and one’s approach to reasoning affect
accuracy in solving JDM statistical problems.
These results raise the possibility of trying to provide people with simple
rules for reasoning through training and education (Fong & Nisbett, 1991;
Nisbett, 1993). Alas, training is costly and daunting. How and when would
such interventions occur? The field of JDM has focused on external
interventions (nudges, such as defaults) because they build on individual
cognitive tendencies rather than attempt to change them. As technology
makes gamification a powerful (and fun) tool, it may be possible to use
rich and engaging feedback environments as tools for imparting the most
important knowledge (Hogarth & Soyer, 2011, 2015). Several research teams
have shown the benefit of using brief, immersive training techniques for
learning to avoid biases (e.g., such as confirmation bias) (Morewedge et
al. 2015; Sellier, Scopelliti & Morewedge, 2019; Mohan et al., 2017; Mohan et al., 2018).
Similar techniques could be used to teach statistical principles such as
the law of large numbers and the need to consider four cells when judging
covariation.
The early theorizing about System 2 emphasized the joint contribution of
rules and decision processes (Kahneman, 2000; Sloman, 1996). More recent
work on System 2 has focused more on process (slow thinking and
reflection) than on access to rules. The current research supports the
merits of the earlier focus on their joint contribution. Having access to
the necessary inferential rule to reach the normative answer in a problem
is important, as is having cognitive faculties that are relevant to
problem solving. Significant interactions show that scoring higher on the
Berlin Numeracy Test (Cokely et al., 2012) or being more dispositionally
reflective (as measured by CRT and CRT-2) are each more beneficial to
performance for people who have access to the relevant inferential rules.
This finding is in line with the claim that avoiding decision biases
requires both having the right decision strategy and recognizing when to
use it (Kahneman, 2000; Nisbett, 1993).
Finally, we compared the benefits of fast thinking and slow thinking using
two different popular paradigms, one comparing them between-subjects (e.g.,
Evans, Handley & Bacon, 2009; Cryder et al., 2017) and the other using a
sequential paradigm within-subjects (e.g., Thompson et al., 2011; Bago &
De Neys, 2017). We do not find evidence supporting an anchoring critique of
the two-response paradigm – participants in the within-subjects
Slow condition performed no worse than the control group. However,
they also did not perform better than the control condition. As a result,
it appears that there was a small benefit of the between-subjects
Slow intervention (61.6%) beyond the performance achieved by the
slow thinking responses from the within-subjects condition (59.1%),
although this lost statistical significance when rules were included in the
models.
4.1 Limitations
A potential critique of the asymmetry between the cost of fast thinking and
the benefit of slow thinking observed in the present research is that some
people may not fully comply with the instructions. Specifically, fast and
slow instructions may evoke different rates of compliance – it takes less
effort to be fast than to be slow. Thus, the slow instructions may be
rejected by some participants, reducing the overall performance of the
group of subjects in that condition. We believe that there are at least
three reasons why the asymmetry between the effects of fast and slow
thinking interventions is likely to persist in different contexts. First,
our robustness checks, although not perfect, continued to show the
asymmetry even when the data were trimmed to exclude participants who
might not have fully complied (Table S4). Second, our findings mostly
mirror recent research on incentives showing that very high pay for
correct answers can cause people to slow down without leading to improved
performance (Enke et al., 2020). Thus, our experiment complements other
work showing a weak association between deliberately taking more time and
accuracy on JDM tasks. Finally, even if slow thinking does help those who
take it seriously, mere instruction to think more slowly apparently
produces lackluster adoption – a problem that would likely persist in
settings outside experiments, such as classrooms and workplaces. The
underwhelming effects of slow thinking in our data could be driven by
failure to fully comply, among other factors. Regardless of the underlying
mechanism, the result is an important one from a debiasing perspective. The
JDM field should have realistic expectations of the benefit of telling
people to think more slowly on statistical reasoning as captured by the
problems of traditional interest to the field.
It is also possible that if participants slowed down even more, there might
be performance gains that we do not observe here. As we see in Table 3,
telling people to think more slowly slows them down about 20% relative to
a control. This is insufficient to produce a consistent performance
advantage. Perhaps slowing down more would be beneficial, but there are at
least two reasons to be skeptical. First, research has shown that forcing
people to slow down beyond what is natural can harm performance (Payne et al.,
2008). Second, even when very large incentives
cause participants to slow down a great deal (40% longer response times,
as in Enke et al., 2020), there are still negligible impacts on
performance in classic JDM tasks. From the available evidence, we conclude
that it is unlikely that there are significant benefits associated with
slow thinking in statistical JDM problems that can be attained by slowing
down further.
Our results generally support the idea that encouraging slow thinking has
limited benefits relative to a control condition in an experiment.
However, further attention to the relevant baseline is necessary. Our JDM
questions were difficult, and the context of the experiment is likely to
have induced slower thinking than participants might exhibit in everyday
situations. If, in real world settings, decision makers are likely to be
engaging in split second decisions, a simple prompt to slow down may be of
use. In domains that seem to foster fast thinking, such as social media,
research has found that a simple encouragement to slow down can have
significant benefits in detecting fake news (Pennycook, McPhetres, Zhang,
Lu & Rand, 2020). Our results cannot attest to the benefits of slow
thinking in other contexts, but we can suggest that differences in
performance between fast and slow thinking in statistical decision making
studies in the laboratory are likely to be driven more by the harm of fast
thinking than the benefit of slow thinking when compared to participants’
baseline tendencies.
4.2 Conclusion
In the wake of Daniel Kahneman’s (2011) Thinking, Fast and Slow,
popular rhetoric has emphasized the benefits of slow thinking. Yet recent
academic research into dual process theory has produced a dearth of
evidence supporting the idea that choosing to slow down has a benefit to
decision quality relative to individuals’ baseline. Bodies of evidence
show that more habitually reflective thinkers avoid many common decision
biases and that slow thinking is generally superior to fast thinking.
Direct evidence concerning the benefits of slowing down as a debiasing
strategy has been lacking. In the present research, we directly test the
benefits of slow thinking versus a control, and draw on the literature on
inferential rules for a possible moderator of when slowing down is likely
to be helpful. Whilst we do not find strong evidence supporting the
benefits of slow thinking, our results reinforce the importance of
considering inferential rules in a dual process framework, in line with
Sloman’s (1996) original formulation. We hope that the current research is
seen as a bridge between assertions adopted in popular interpretations of
JDM research and the extant empirical evidence.
Even though the effect of our thinking slow manipulation is small and not
reliably significant, this still constitutes a readily implemented
behavioral intervention. In problems where people do habitually engage in
split-second thinking, a simple encouragement to think more slowly might
be beneficial to achieving superior performance. In our data, the benefit
of slow thinking was comparable in size to offering an incentive for
performance. For our JDM problems, briefly guiding decision makers to a
slow process is as effective as focusing their attention on accuracy
rewards. The prescription to think slowly is at least more cost-effective.
Further research might examine if there are other contexts in which a
simple instruction to slow down can more clearly improve task performance.
References
Arkes, H. R. (1991). Costs and benefits of judgment errors: Implications
for debiasing. Psychological Bulletin, 110(3), 486–498.
https://doi.org/10.1037/0033-2909.110.3.486
Attali, Y., & Bar-Hillel, M. (2020). The false allure of fast lures.
Judgment and Decision Making, 15(1), 93–111.
Bago, B., & De Neys, W. (2019a). The intuitive greater good: Testing the
corrective dual process model of moral cognition. Journal of
Experimental Psychology: General, 148(10), 1782–1801.
https://doi.org/10.1037/xge0000533
Bago, B., & De Neys, W. (2019b). The Smart System 1: evidence for the
intuitive nature of correct responding on the bat-and-ball problem.
Thinking & Reasoning, 25(3), 257–299.
https://doi.org/10.1080/13546783.2018.1507949
Bago, B., & De Neys, W. (2017). Fast logic?: Examining the time course
assumption of dual process theory. Cognition, 158,
90–109. https://doi.org/10.1016/j.cognition.2016.10.014
Baron, J., Scott, S., Fincher, K., & Metz, S. E. (2015). Why does the
Cognitive Reflection Test (sometimes) predict utilitarian moral judgment
(and other things)? Journal of Applied Research in Memory and
Cognition, 4(3), 265–284.
https://doi.org/10.1016/j.jarmac.2014.09.003
Bruine de Bruin, W., Parker, A. M., & Fischhoff, B. (2007). Individual
differences in adult decision-making competence. Journal of
Personality and Social Psychology, 92(5), 938–956.
https://doi.org/10.1037/0022-3514.92.5.938
Camerer, C. F., & Hogarth, R. M. (1999). The effects of financial
incentives in experiments: A review and capital-labor-production
framework. Journal of risk and uncertainty, 19(1–3),
7–42. https://doi.org/10.1007/978-94-017-1406-8_2
Chaiken, S., & Trope, Y. (1999). Dual-process Theories in Social
Psychology. Guilford Press.
Cheng, P. W., & Holyoak, K. J. (1985). Pragmatic reasoning schemas.
Cognitive Psychology, 17, 391–416.
Chussil, M. (2016). Slow Deciders Make Better Strategists. Harvard
Business Review, 94(7/8).
https://hbr.org/2016/07/slow-deciders-make-better-strategists
Cokely, E. T., Galesic, M., Schulz, E., Ghazal, S., & Garcia-Retamero, R.
(2012). Measuring risk literacy: The Berlin Numeracy Test.
Judgment and Decision Making, 7(1), 25–47.
Cokely, E. T., & Kelley, C. M. (2009). Cognitive abilities and superior
decision making under risk: A protocol analysis and process model
evaluation. Judgment and Decision Making, 4(1), 20–33.
Cryder, C., Botti, S., & Simonyan, Y. (2017). The Charity Beauty Premium:
Satisfying Donors’ “Want” versus “Should” Desires. Journal of
Marketing Research, 54(4), 605–618.
https://doi.org/10.1509/jmr.14.0658
Daniel, D. B., & Klaczynski, P. A. (2006). Developmental and Individual
Differences in Conditional Reasoning: Effects of Logic Instructions and
Alternative Antecedents. Child Development, 77(2),
339–354. https://doi.org/10.1111/j.1467-8624.2006.00874.x
De Neys, W. (2006). Automatic–Heuristic and Executive–Analytic Processing
during Reasoning: Chronometric and Dual-Task Considerations.
Quarterly Journal of Experimental Psychology, 59(6),
1070–1100. https://doi.org/10.1080/02724980543000123
De Neys, W., & Pennycook, G. (2019). Logic, Fast and Slow: Advances in
Dual-Process Theorizing. Current Directions in Psychological
Science, 28(5), 503–509.
https://doi.org/10.1177/0963721419855658
De Neys, W., & Schaeken, W. (2007). When people are more logical under
cognitive load: Dual task impact on scalar implicature.
Experimental psychology, 54(2), 128–133.
https://doi.org/10.1027/1618-3169.54.2.128
De Neys, W., Schaeken, W., & d’Ydewalle, G. (2005). Working memory and
counterexample retrieval for causal conditionals. Thinking &
Reasoning, 11(2), 123–150.
https://doi.org/10.1080/13546780442000105
De Neys, W., & Verschueren, N. (2006). Working Memory Capacity and a
Notorious Brain Teaser: The Case of the Monty Hall Dilemma.
Experimental Psychology, 53(2), 123–131.
https://doi.org/10.1027/1618-3169.53.1.123
Enke, B., Gneezy, U., Hall, B., Martin, D., Nelidov, V., Offerman, T., &
van de Ven, J. (2020). Cognitive Biases: Mistakes or Missing
Stakes? CESifo Working Paper Series, 8168.
Epley, N., & Gilovich, T. (2005). When effortful thinking influences
judgmental anchoring: Differential effects of forewarning and incentives
on self-generated and externally provided anchors. Journal of
Behavioral Decision Making, 18(3), 199–212.
https://doi.org/10.1002/bdm.495
Erceg, N., Galić, Z., & Ružojčić, M. (2020). A reflection on cognitive
reflection – testing convergent/divergent validity of two measures of
cognitive reflection. Judgment and Decision Making,
15(5), pp. XX-XX.
Evans, J. St B. T., Newstead, S. E., Allen, J. L., & Pollard, P. (1994).
Debiasing by instruction: The case of belief bias. European
Journal of Cognitive Psychology, 6(3), 263–285.
https://doi.org/10.1080/09541449408520148
Evans, J. St. B. T., & Curtis-Holmes, J. (2005). Rapid responding
increases belief bias: Evidence for the dual-process theory of reasoning.
Thinking & Reasoning, 11(4), 382–389.
https://doi.org/10.1080/13546780542000005
Evans, J. St. B. T., Handley, S. J., & Bacon, A. M. (2009).
Reasoning Under Time Pressure: A Study of Causal Conditional Inference.
Experimental Psychology, 56(2), 77–83.
https://doi.org/10.1027/1618-3169.56.2.77
Evans, J. St. B. T., Handley, S. J., Neilens, H., & Over, D. (2010).
The influence of cognitive ability and instructional set on causal
conditional inference. Quarterly Journal of Experimental
Psychology, 63(5), 892–909.
https://doi.org/10.1080/17470210903111821
Evans, J. St. B. T., & Stanovich, K. E. (2013). Dual-Process
Theories of Higher Cognition: Advancing the Debate. Perspectives
on Psychological Science, 8(3), 223–241.
https://doi.org/10.1177/1745691612460685
Flavell, J. H. (1971). Stage-related properties of cognitive development.
Cognitive Psychology, 2(4), 421–453.
https://doi.org/10.1016/0010-0285(71)90025-9
Fong, G. T., Krantz, D. H., & Nisbett, R. E. (1986). The Effects of
Statistical Training on Thinking about Everyday Problems.
Cognitive Psychology, 18(3), 253-292.
Fong, G. T., & Nisbett, R. E. (1991). Immediate and delayed transfer of
training effects in statistical reasoning. Journal of Experimental
Psychology: General, 120(1), 34–45.
Frey, D., Johnson, E. D., & De Neys, W. (2018). Individual differences in
conflict detection during reasoning. Quarterly Journal of
Experimental Psychology, 71(5), 1188–1208.
https://doi.org/10.1080%2F17470218.2017.1313283
Frederick, S. (2005). Cognitive Reflection and Decision Making.
Journal of Economic Perspectives, 19(4), 25–42.
https://doi.org/10.1257/089533005775196732
Hardin, J. W., & Hilbe, J. M. (2003). Generalized estimating
equations. Chapman and Hall.
Hin, L.-Y., & Wang, Y.-G. (2009). Working-correlation-structure
identification in generalized estimating equations. Statistics in
Medicine, 28(4), 642–658. https://doi.org/10.1002/sim.3489
Hogarth, R. M., & Soyer, E. (2011). Sequentially simulated outcomes: Kind
experience versus nontransparent description. Journal of
Experimental Psychology: General, 140(3), 434–463.
https://doi.org/10.1037/a0023265
Hogarth, R. M., & Soyer, E. (2015). Using Simulated Experience to Make
Sense of Big Data. MIT Sloan Management Review; Cambridge,
56(2), 49–54.
Højsgaard, S., Halekoh, U., & Yan, J. (2016). Package ‘geepack’.
http://cran.univ-paris1.fr/web/packages/geepack/geepack.pdf
Frey, D., Johnson, E. D., & De Neys, W. (2018). Individual differences in
conflict detection during reasoning. Quarterly Journal of
Experimental Psychology, 71(5), 1188–1208.
https://doi/full/10.1080/17470218.2017.1313283
Kahneman, D. (2000). A psychological point of view: Violations of rational
rules as a diagnostic of mental processes. Behavioral and Brain
Sciences, 23(5), 681–683.
https://doi.org/10.1017/S0140525X00403432
Kahneman, D. (2011). Thinking, Fast and Slow. Farrar, Straus and
Giroux.
Kahneman, D., & Frederick, S. (2002). Representativeness Revisited:
Attribute Substitution in Intuitive Judgment. In T. Gilovich, D. Griffin,
& D. Kahneman (Eds.), Heuristics and Biases (1st ed., pp.
49–81). Cambridge University Press.
https://doi.org/10.1017/CBO9780511808098.004
Kahneman, D., & Tversky, A. (1973). On the psychology of prediction.
Psychological Review, 80(4), 237–251.
Kirkpatrick, L. A., & Epstein, S. (1992). Cognitive-experiential
self-theory and subjective probability: Further evidence for two
conceptual systems. Journal of Personality and Social Psychology,
63(4), 534–544.
Klose, J., Černochová, D., & Král, P. (2002). Vídeňský maticový
test. Testcentrum.
Koehler, D., & James, G. (2010). Probability matching and strategy
availability. Memory & Cognition, 38(6), 667–676.
https://doi.org/10.3758/MC.38.6.667
Koriat, A., & Goldsmith, M. (1996). Memory metaphors and the
real-life/laboratory controversy: Correspondence versus storehouse
conceptions of memory. Behavioral and Brain Sciences,
19(2), 167–188. https://doi.org/10.1017/S0140525X00042114
Kunda, Z., & Nisbett, R. E. (1986). Prediction and the partial
understanding of the law of large numbers. Journal of Experimental
Social Psychology, 22(4), 339–354.
https://doi.org/10.1016/0022-1031(86)90019-3
Larrick, R. P., & Feiler, D. C. (2015). Expertise in Decision Making. In
The Wiley Blackwell Handbook of Judgment and Decision Making (pp.
696–721). John Wiley & Sons, Ltd.
https://doi.org/10.1002/9781118468333.ch24
Lehman, D. R., Lempert, R. O., & Nisbett, R. E. (1988). The effects of
graduate training on reasoning: Formal discipline and thinking about
everyday-life events. American Psychologist, 43(6),
431–442.
Litman, L., Robinson, J., & Abberbock, T. (2017). TurkPrime.com: A
versatile crowdsourcing data acquisition platform for the behavioral
sciences. Behavior Research Methods, 49(2), 433–442.
https://doi.org/10.3758/s13428-016-0727-z
Mohan, D., Farris, C., Fischhoff, B., Rosengart, M. R., Angus, D. C.,
Yealy, D. M., Wallace, D. J., & Barnato, A. E. (2017). Efficacy of
educational video game versus traditional educational apps at improving
physician decision making in trauma triage: Randomized controlled trial.
BMJ, 359:j5416. https://doi.org/10.1136/bmj.j5416
Mohan, D., Fischhoff, B., Angus, D. C., Rosengart, M. R., Wallace, D. J.,
Yealy, D. M., Farris, C., Chang, C.-C. H., Kerti, S., & Barnato, A. E.
(2018). Serious games may improve physician heuristics in trauma triage.
Proceedings of the National Academy of Sciences,
115(37), 9204–9209. https://doi.org/10.1073/pnas.1805450115
Morewedge, C. K., & Kahneman, D. (2010). Associative processes in
intuitive judgment. Trends in Cognitive Sciences,
14(10), 435–440. https://doi.org/10.1016/j.tics.2010.07.004
Morewedge, C. K., Yoon, H., Scopelliti, I., Symborski, C. W., Korris, J.
H., & Kassam, K. S. (2015). Debiasing Decisions: Improved Decision Making
with a Single Training Intervention. Policy Insights from the
Behavioral and Brain Sciences, 2(1), 129–140.
https://doi.org/10.1177/2372732215600886
Newman, I. R., Gibb, M., & Thompson, V. A. (2017). Rule-based reasoning is
fast and belief-based reasoning can be slow: Challenging current
explanations of belief-bias and base-rate neglect. Journal of
Experimental Psychology: Learning, Memory, and Cognition, 43(7),
1154–1170. https://doi.org/10.1037/xlm0000372
Nisbett, R. E., & Ross, L. (1980). Human Inference: Strategies and
Shortcomings of Social Judgment. Prentice-Hall.
Nisbett, R. E. (1993). Rules for reasoning. Lawrence Erlbaum
Associates, Inc.
Nisbett, R. E, Fong, G. T., Lehman, D. R., & Cheng, P. W. (1987).
Teaching Reasoning. Science. 238, 625–631.
Nisbett, R. E., Krantz, D. H., Jepson, C., & Kunda, Z. (1983). The use of
statistical heuristics in everyday inductive reasoning.
Psychological Review, 90(4), 339–363.
Obrecht, N. A., Chapman, G. B., & Gelman, R. (2009). An encounter
frequency account of how experience affects likelihood estimation.
Memory & Cognition, 37(5), 632–643.
https://doi.org/10.3758/MC.37.5.632
Oeschssler, J., Roider, A., & Schmitz, P. W. (2009). Cognitive abilities
and behavioral biases. Journal of Economic Behavior &
Organization, 72, 147–152.
https://doi.org/10.1016/j.jebo.2009.04.018
Pan, W. (2001). Akaike’s Information Criterion in Generalized Estimating
Equations. Biometrics, 57(1), 120–125.
https://doi.org/10.1111/j.0006-341X.2001.00120.x
Parker, A. M., & Fischhoff, B. (2005). Decision-making competence:
External validation through an individual-differences approach.
Journal of Behavioral Decision Making, 18(1), 1–27.
https://doi.org/10.1002/bdm.481
Payne, J. W., Samper, A., Bettman, J. R., & Luce, M. F. (2008). Boundary
Conditions on Unconscious Thought in Complex Decision Making.
Psychological Science, 19(11), 1118–1123.
https://doi.org/10.1111/j.1467-9280.2008.02212.x
Payne, J. W., Bettman, J. R., & Johnson, E. J. (1992). Behavioral decision
research: A constructive processing perspective. Annual Review of
Psychology, 43, 87–131.
Pennycook, G., Cheyne, J. A., Barr, N., Koehler, D. J., & Fugelsang, J. A.
(2014). Cognitive style and religiosity: The role of conflict detection.
Memory & Cognition, 42(1), 1–10.
https://doi.org/10.3758/s13421-013-0340-7
Pennycook, G., McPhetres, J., Zhang, Y., Lu, J. G., & Rand, D. G. (2020).
Fighting COVID-19 Misinformation on Social Media: Experimental Evidence
for a Scalable Accuracy-Nudge Intervention. Psychological
Science, 31(7), 770–780.
https://doi.org/10.1177/0956797620939054
Pennycook, G., Neys, W. D., Evans, J. St. B. T., Stanovich, K. E., &
Thompson, V. A. (2018). The Mythical Dual-Process Typology. Trends
in Cognitive Sciences, 22(8), 667–668.
https://doi.org/10.1016/j.tics.2018.04.008
Pennycook, G., & Thompson, V. A. (2012). Reasoning with base rates is
routine, relatively effortless, and context dependent. Psychonomic
Bulletin & Review, 19(3), 528–534.
https://doi.org/10.3758/s13423-012-0249-3
Pennycook, G., Trippas, D., Handley, S. J., & Thompson, V. A. (2013). Base
rates: Both neglected and intuitive. Journal of Experimental
Psychology: Learning, Memory, and Cognition, 40(2), 544–554.
Perkins, D. (1995). Outsmarting IQ: The Emerging Science of
Learnable Intelligence. Simon and Schuster.
Phillips, J., & Cushman, F. (2017). Morality constrains the default
representation of what is possible. Proceedings of the National
Academy of Sciences, 114(18), 4649–4654.
Rand, D. G. (2019). Intuition, Deliberation, and Cooperation: Further
Meta-Analytic Evidence from 91 Experiments on Pure Cooperation. SSRN
Scholarly Paper ID 3390018, Social Science Research Network.
https://doi.org/10.2139/ssrn.3390018
Rand, D. G., Greene, J. D., & Nowak, M. A. (2012). Spontaneous giving and
calculated greed. Nature, 489(7416), 427–430.
https://doi.org/10.1038/nature11467
Rand, D. G., Peysakhovich, A., Kraft-Todd, G. T., Newman, G. E.,
Wurzbacher, O., Nowak, M. A., & Greene, J. D. (2014). Social heuristics
shape intuitive cooperation. Nature Communications,
5(1), 1–12. https://doi.org/10.1038/ncomms4677
Raoelison, M., Thompson, V. A., & De Neys, W. (2020). The smart intuitor:
Cognitive capacity predicts intuitive rather than deliberate thinking.
Cognition, 204, 104381.
https://doi.org/10.1016/j.cognition.2020.104381
Reeves, M., Torres, R., & Hassan, F. (2017). How to Regain the Lost Art of
Reflection. Harvard Business Review, 95(5).
https://hbr.org/2017/09/how-to-regain-the-lost-art-of-reflection
Ritov, I., & Baron, J. (1990). Reluctance to vaccinate: Omission bias and
ambiguity. Journal of Behavioral Decision Making, 3(4),
263–277. https://doi.org/10.1002/bdm.3960030404
Roberts, M. J., & Newton, E. J. (2001). Inspection times, the change task,
and the rapid-response selection task. Quarterly Journal of
Experimental Psychology, 54(4), 1031–1048.
https://doi.org/10.1080/02724980143000082
Sellier, A.-L., Scopelliti, I., & Morewedge, C. K. (2019). Debiasing
Training Improves Decision Making in the Field. Psychological
Science, 30(9), 1371–1379.
https://doi.org/10.1177/0956797619861429
Shynkaruk, J. M., & Thompson, V. A. (2006). Confidence and accuracy in
deductive reasoning. Memory & Cognition, 34(3),
619–632. https://doi.org/10.3758/BF03193584
Sloman, S. A. (1996). The empirical case for two systems of reasoning.
Psychological Bulletin, 119(1), 3–22.
Smith, E. E., Langston, C., & Nisbett, R. E. (1992). The Case for Rules in
Reasoning. Cognitive Science, 16(1), 1–40.
https://doi.org/10.1207/s15516709cog1601_1
Šrol, J., & Neys, W. D. (2020). Predicting individual differences in
conflict detection and bias susceptibility during reasoning.
Thinking & Reasoning, 1–31.
https://doi.org/10.1080/13546783.2019.1708793
Stanovich, K. E., & West, R. F. (1999). Discrepancies Between Normative
and Descriptive Models of Decision Making and the Understanding/Acceptance
Principle. Cognitive Psychology, 38(3), 349–385.
https://doi.org/10.1006/cogp.1998.0700
Stanovich, K. E., & West, R. F. (2000). Individual differences in
reasoning: Implications for the rationality debate? Behavioral and
Brain Sciences, 23, 645–726.
Stanovich, K. E., & West, R. F. (2008). On the relative independence of
thinking biases and cognitive ability. Journal of Personality and
Social Psychology, 94(4), 672–695.
https://doi.org/10.1037/0022-3514.94.4.672
Stupple, E. J. N., Ball, L. J., & Ellis, D. (2013). Matching bias in
syllogistic reasoning: Evidence for a dual-process account from response
times and confidence ratings. Thinking & Reasoning,
19(1), 54–77. https://doi.org/10.1080/13546783.2012.735622
Thaler, R. H., & Sunstein, C. R. (2008). Nudge: Improving
decisions about health, wealth, and happiness. Springer US.
Thompson, V. A., & Johnson, S. C. (2014). Conflict, metacognition, and
analytic thinking. Thinking & Reasoning, 20(2),
215–244. https://doi.org/10.1080/13546783.2013.869763
Thompson, V. A., Pennycook, G., Trippas, D., & Evans, J. S. B. T. (2018).
Do smart people have better intuitions? Journal of Experimental
Psychology: General, 147(7), 945–961.
https://doi.org/10.1037/xge0000457
Thompson, V. A., Prowse Turner, J. A., & Pennycook, G. (2011). Intuition,
reason, and metacognition. Cognitive Psychology, 63(3),
107–140. https://doi.org/10.1016/j.cogpsych.2011.06.001
Thomson, K. S., & Oppenheimer, D. M. (2016). Investigating an alternate
form of the cognitive reflection test. Judgment and Decision
Making, 11(1), 15.
Toplak, M. E., West, R. F., & Stanovich, K. E. (2011). The Cognitive
Reflection Test as a predictor of performance on heuristics-and-biases
tasks. Memory & Cognition, 39(7), 1275–1289.
https://doi.org/10.3758/s13421-011-0104-1
Tsujii, T., & Watanabe, S. (2010). Neural correlates of belief-bias
reasoning under time pressure: A near-infrared spectroscopy study.
NeuroImage, 50(3), 1320–1326.
https://doi.org/10.1016/j.neuroimage.2010.01.026
Tversky, A., & Kahneman, D. (1983). Extensional versus intuitive
reasoning: The conjunction fallacy in probability judgement.
Psychological Review, 90(4), 293–315.
Vadeboncoeur, I., & Markovits, H. (1999). The effect of instructions and
information retrieval on accepting the premises in a conditional reasoning
task. Thinking & Reasoning, 5(2), 97–113.
https://doi.org/10.1080/135467899394011
Villejoubert, G. (2009). Are representativeness judgments automatic and
rapid? The effect of time pressure on the conjunction fallacy.
Proceedings of the Annual Meeting of the Cognitive Science Society,
31(31).
Wasserman, E. A., Dorner, W. W., & Kao, S. F. (1990). Contribution of
specific cell information to judgments of interevent contingency.
Journal of Experiment Psychology: Learning, Memory, and
Cognition, 16(3), 509–521.
West, R. F., Meserve, R. J., & Stanovich, K. E. (2012). Cognitive
sophistication does not attenuate the bias blind spot. Journal of
Personality and Social Psychology, 103(3), 506–519.
https://doi.org/10.1037/a0028857
This document was translated from LATEX by
HEVEA.