Corrigendum
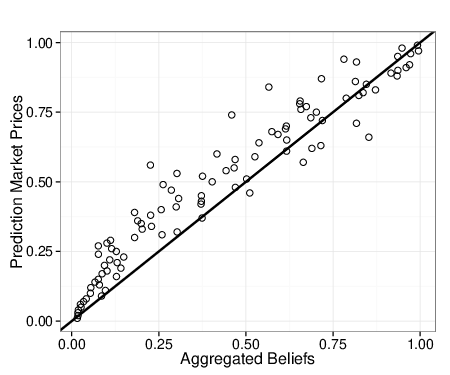
The original version Figure 2 showed forecasts for both answer
options on binary questions, producing a pattern of forced symmetry
relative to horizontal axis mid-point (0.50), i.e., data points above 0.50
were the mirror images of those below 0.50. The manuscript has been updated
with a figure based on data that only include forecasts on the first answer
option for each question. We believe this version more informative as it
avoids duplication of data points. In the updated figure, most points lie
above the diagonal line, denoting a pattern of higher prices relative to
the corresponding aggregated beliefs.
Original version:
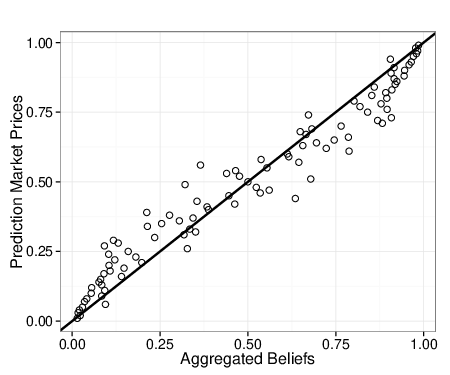
Corrected version: