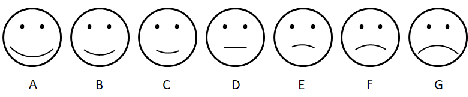
| Figure 1: Scale used to assess emotional response to salient calorie information. |
Judgment and Decision Making, Vol. 14, No. 1, January 2019, pp. 11-25
Welfare effects of nudges: The emotional tax of calorie menu labelingLinda Thunström* |
Traditionally, information has been assumed to never harm consumers, a notion recently challenged. Salience nudges have been argued to evoke negative emotions, therefore acting as “emotional taxes”. I design a hypothetical restaurant meal experiment to analyze the emotional and short-term consumer welfare impact of a calorie salience nudge (calorie menu labeling) – a policy implemented nationwide in the U.S. in 2018. I find that a calorie salience nudge may act as an emotional tax, but only for some – there is considerable heterogeneity in the emotional response to the nudge. In particular, the nudge emotionally taxes people with low eating self-control, while it emotionally subsidizes those with higher levels of eating self-control. It therefore emotionally taxes the “right” people. However, people with lower levels of self-control may experience fewer benefits from the nudge – the nudge causes them to adjust their high calorie meal consumption by less than do those with higher self-control. It is therefore unsurprising that consumers with lower self-control attach a lower (a negative) value to the calorie salience nudge. Overall, the calorie salience nudge positively affects consumer welfare, although heterogeneity over consumers is substantial – the consumer value ranges from positive to negative. I find no distributional effects over income from the calorie salience nudge.
Keywords: nudge, welfare effects, emotional tax, calorie information, menu
labeling, self-control, economic experiment
Behavioral insights and interventions are increasingly used to address policy issues (Johnson & Goldstein, 2003; Larrick & Soll, 2008; Thaler & Sunstein, 2008; Johnson et al., 2012; Sunstein, 2013; The World Bank, 2015). Of particular interest to this study are salience nudges as policy instruments, specifically calorie menu labeling in restaurants. Calorie menu labeling was implemented nationwide in the U.S. in 2018, in part to help one of the most important public health problems in the Western world – over consumption of calories.1 Specifically, the nudge makes salient calorie information by displaying it on billboards and restaurant menus, with the intent to steer consumers towards lower calorie choices.2
Behavioral scientists have traditionally assumed information serves only to improve decision making, by helping consumers better align decisions with preferences – the assumption has therefore been that information, on net, can never harm consumers (Machina et al., 1989). However, this view has recently been challenged, mainly due to the increased awareness of potential costs to receiving information, such as emotions evoked by the information. It is argued that informational nudges (salience nudges) may evoke negative emotions (e.g., pain, anxiety, fear, guilt)3, thereby acting as “emotional taxes” (e.g., Glaeser, 2006; Loewenstein & O’Donoghue, 2006).4
This study asks whether a calorie salience nudge indeed acts as an emotional tax, and asks about the distributional effects of the nudge. Specifically, I analyze the average and distributional effects of emotions and demand adjustments caused by the nudge and the net value consumers assign to the nudge. This study is the first both to directly test the emotional impact of a salience nudge as well as to examine the distributional impact of a calorie salience nudge.5
Of particular interest is the distributional impact of the nudge along the dimensions of eating self-control and income.6 Studies find low self-control increases unhealthy eating (e.g., Wills et al., 2007; de Ridder et al., 2012; Haws et al., 2016), making people of low self-control a target group for policies designed to encourage healthy choices, such as the calorie salience nudge.
Limited self-control may prevent people from consuming the level of calories they desire for themselves to consume, i.e., cause “errors” in decision making (e.g., Laibson, 1997; O’Donoghue & Rabin, 1999; 2003a). The presence of self-control problems may therefore justify paternalistic policies that help correct for these errors. Like a fiscal tax, an “emotional tax” (e.g., emotional discomfort from knowingly eating high-calorie food) adds a cost to high-calorie consumption. Studies show people with low self-control may benefit from paternalistic fiscal taxes on high-calorie food, if the tax incentivizes them to reduce their over consumption of high-calorie food (O’Donoghue & Rabin, 1999; 2003a; 2006; Aronsson & Thunström, 2008). Similarly, an emotional tax may benefit consumers with low self-control.7
The emphasis in this study on distributional effects of the nudge is grounded in the increased awareness that nudges may adversely affect subgroups in the population. Sunstein (2016) states that distributional effects of a nudge should therefore affect the decision on implementation of a nudge. Roberts (2018) takes this argument further, stating the government is ethically responsible to consider distributional effects. Still, little is known about the distributional impact of salience nudges in general. Recent studies show salience nudges might heterogeneously affect consumers, and have undesired effects overall or on sub-groups. Allcott and Kessler (2019) examine welfare effects of information in home energy conservation reports. They find the reports increase welfare for most consumers, but has a negative effect on some. Marreiros et al. (2017) find that information on companies’ privacy practices has undesired effects on consumers’ willingness to disclose identifiable information and Wilson et al. (2015) find that information intended to encourage low-calorie milk consumption increases average consumption of both low- and high-calorie milk. Thunström et al. (2018) find that a nudge that makes spending salient fails to affect those who would benefit from spending less (“spendthrifts”), while it reduces spending by those who spend too little (“tightwads”), which might cause the nudge to overall reduce consumer welfare.8 These studies all underline the importance of examining the distributional impact of nudges – are they affecting the “right” people? And what is the overall impact on consumer welfare from nudges?
Of concern is the heterogeneity in self-control in the population – while consumers with low self-control may benefit from an emotional tax, consumers with high self-control would not since the tax would distort their consumption. However, Thunström et al. (2016) argue that people with low self-control may experience negative emotions from salient calorie information, while people with high self-control may not. If so, the salience nudge might be “asymmetrically paternalistic”. Camerer et al. (2003) define a regulation as asymmetrically paternalistic “if it creates large benefits for those who make errors, while imposing little or no harm on those who are fully rational” (p. 1212). A calorie salience nudge would hence be asymmetrically paternalistic if it emotionally taxes calorie consumption for those who make behavioral errors (i.e., those with low self-control, who overconsume calories), and thereby causes a meaningful, on net welfare increasing, reduction in their overconsumption, while at the same time imposing little cost (e.g., emotional cost) on those who control their diet without the nudge.9
As a first step towards asking whether the salience nudge is asymmetrically paternalistic, it is therefore of interest to examine the distribution of emotions over different levels of self-control.10 However, again, the net consumer benefit from the nudge depends not only on the emotions evoked by the nudge, but also the benefit from being able to adjust calorie consumption to a desired level, as a result from the information provided by the nudge. For instance, if a person with low self-control experiences negative emotions from the nudge, while those emotions are not strong enough to incentivize (beneficial) reductions in high calorie consumption, he/she can only lose out from being nudged. The nudge would then not qualify as a desired asymmetrically paternalistic regulation — without resulting in a welfare increasing behavioral change, it would merely be paternalistic (Camerer et al., 2003). In contrast, if the nudge incentivizes the same person to undertake beneficial reductions in calorie consumption, he/she may perceive the net value of the nudge to be positive and substantial, even if it causes emotional costs. If a person with high self-control experiences no emotional tax from the nudge, he/she is likely to value salient calorie information – there are only benefits to being nudged, since the information on calories enables him/her to perfectly adjust calorie consumption to some individual-level ideal consumption.
The other dimension over which I examine distributional effects of the nudge is income. Distributional effects over income are typically a concern due to inequality aversion and a desire to protect those most vulnerable in society. For instance, studies find that fiscal taxes on unhealthy food are generally regressive (e.g., Cash et al., 2005; Mytton et al., 2007; Chouinard et al., 2007; Allais et al., 2010; Madden, 2015; Muller et al., 2017). This finding has been a forceful argument against their implementation (Lockwood & Taubinsky, 2017). Chouinard at el. (2007) directly argue a fiscal tax on unhealthy food is “unattractive” if regressive.11 If low-income earners are emotionally taxed by the calorie salience nudge, forcing a calorie salience nudge upon them may add to the already elevated emotional stress from being on a tight budget (see e.g., Shah et al., 2012; Mani et al., 2013). To determine if the nudge may be regressive, I both examine if low income earners are adversely emotionally affected by the nudge and assign a lower net value to the nudge, compared to higher income groups.
The analysis is based on a hypothetical restaurant meal experiment. A hypothetical experiment (relying on stated emotions and behavior) enables a richer data set, compared to a more financially costly incentivized experiment, with choices over real money and consumption. The downside of hypothetical experiments is that they may generate less reliable data due to a hypothetical bias – stated responses might differ from actual responses. This might especially affect the WTP (willingness-to-pay) in this study, given that hypothetical WTP is consistently found to be higher than actual WTP (see, e.g., Cummings et al., 1995; Johannesson et al., 1998; List & Gallet, 2001; Little & Berrens, 2004, Murphy et al., 2005; Blumenschein et al., 2007). However, the context of this study (a familiar choice and context, i.e., predicting behavior in a restaurant scenario) typically decreases the hypothetical bias (see the meta-analyses by List & Gallet, 2001 and Schläpfer & Fischhoff, 2012). For emotions, it is found that people, if the context is familiar, both accurately predict the emotion they will experience, and accurately predict which side of the neutral point their emotional response will fall (Wilson and Gilbert, 2003). For the purpose of the present study, this is sufficient, since our scope is limited to exploring if a calorie salience nudge evokes negative/positive/neutral emotions, and thereby acts as an emotional tax/subsidy.12
The results from the present study imply that the calorie salience nudge evokes emotions in consumers, and more often positive than negative emotions. Further, it seems that the nudge taxes the “right” people – it typically represents an emotional tax (cost) to people with low self-control and an emotional subsidy to people with high self-control. Further, a large share of consumers are emotionally indifferent to the nudge. Next, the results also suggest that the nudge has the intended effect – it reduces the value to consumers of high calorie meals. Here too, there is important heterogeneity over consumers. People with low self-control adjust their demand by less (i.e., may experience fewer benefits) when being nudged, compared to those with higher self-control. Hence, the next finding is not surprising – people of lower levels of self-control (on net) value the nudge less than do people with higher levels of self-control.
Hence, the results imply that those who would benefit the most in terms of improved health from responding to the nudge, value the nudge the least, both because the nudge causes them negative emotions and because it fails to incentivize health improving behavioral change. By contrast, those who benefit the least in terms of improved health assign the highest value to the nudge – they both experience positive emotions from the nudge and undertake meaningful health improving behavioral change due to the informational content of the nudge.
Importantly, the consumer value of the nudge varies from negative to positive. It is negatively valued by consumers with low self-control – i.e., those targeted by the paternalism of the nudge. It imposes an emotional cost on this group, but fails to nudge them towards meaningful adjustments to their calorie consumption. It therefore seems to fail the definition of “asymmetric paternalism”. Even so, the calorie salience nudge may be attractive to policy makers. The average consumer attaches a positive value to the nudge, such that it increases overall consumer welfare. I find no distributional effects over income.
Table 1: Summary statistics.
N Mean S.D. Min Max 417 0.540 0.499 0 1 417 45.163 16.012 21 69 417 48.052 38.949 12.5 212.5 417 2.806 1.329 1 5 417 3.523 1.258 1 5 417 3.899 1.176 1 5 417 4.233 0.944 1 5 417 0.489 0.500 0 1 417 0.511 0.500 0 1 417 1.873 1.641 0 5 388 0.388 2.183 −4 4 388 0.446 0.498 0 1 377 4.851 5.453 −5 10.5 Educational level 417 0.098 0.298 0 1 417 0.300 0.459 0 1 417 0.098 0.298 0 1 417 0.278 0.449 0 1 417 0.225 0.418 0 1 Emotions from calorie information 417 3.513 1.620 1 7 417 0.213 0.410 0 1 417 0.367 0.483 0 1 417 0.420 0.494 0 1 417 26.451 6.467 10 47 Treatments 417 0.252 0.435 0 1 417 0.501 0.501 0 1 417 0.247 0.432 0 1
I recruited 417 American subjects from the web-survey company Qualtrics’ panel. Subjects were recruited to create a nationally representative sample with regards to gender, age and education. Although recruitment costs are significantly higher, the advantage of using the Qualtrics panel, over other online panels (e.g., Amazon Mechanical Turk or Turk Prime) is the higher data quality. Qualtrics continuously performs quality checks of subjects, aimed at, for instance, ensuring the accuracy of background characteristics, and avoidance of professional survey takers (e.g., Sharpe Wessling et al., 2017).
Subjects participated in a hypothetical experiment entailing a restaurant meal scenario, and answered questions on emotional responses to calorie information, calorie information preferences, willingness-to-pay (WTP) for calorie information, marginal WTP for the high calorie meal, attitudes to health and healthy eating, eating self-control, risk preferences, and socio-demographics. Only non-vegetarian/vegan subjects were recruited (the meals in the meal scenario were non-vegetarian). For descriptive statistics of the sample and variables used in our analysis, see Table 1.
The hypothetical meal scenario places subjects in a restaurant situation, with a friend. Subjects were asked to choose between two meals (creamy shrimp pasta or meatballs and pasta), shown on pictures. They were informed one meal contains 500 calories and the other 1000 calories, but that they would not know which one, unless they got calorie information.13 The reason for giving subjects these boundaries of the calorie content was to reduce the underlying tendency for people to underestimate the calorie content in meals (Burton, 2006), which could otherwise cause subjects to perceive calorie information as less instrumental. They were asked to rate the expected taste of both meals from 1=very bad to 5=very good. Mean expected taste scores were 3.899 for the shrimp meal and 4.233 for the meatballs meal, as shown by variables Taste score shrimp and Taste score meatballs in Table 1. Subjects were thereafter asked to choose their preferred meal, if the meal prices were the same, $12.14 Variables Choice shrimp and Choice meatballs in Table 1 show around 51 percent of subjects chose the meatballs meal and around 49 percent the shrimp meal.
To enable a measure of how the nudge may affect subjects’ demand for a high calorie meal, the survey was designed such that the favorite meal chosen by a subject was always the high-calorie meal, i.e., if a subject chose shrimp (meatballs) as their favorite meal, they were directed into a version of the survey where shrimp (meatballs) was the high calorie meal.
Although the literature debating emotional effects of salience nudges focus on the negative emotions they may evoke (e.g., Glaeser, 2006; Loewenstein & O’Donoghue, 2006), there are reasons to believe the information provided by the nudge may also generate positive emotions. There is a large literature on uncertainty and ambiguity aversion (e.g., Ellsberg, 1961; Ahn et al., 2014; Machina, 2014; Gneezy et al., 2015, and a review of ambiguity attitudes by Trautman et al., 2015), implying resolving uncertainty may make (some) people feel better. Further, Litman (2005) shows people may emotionally benefit from satisfying their curiosity. Subjects could therefore state both positive and negative emotions along a 7 grade pain scale (7=very good, 1=very bad and 4=neutral, as implied by smiley faces shown in Figure 1). Measuring emotions with the Feelings Scale meant that subjects did not need to specify what positive/negative emotions they felt, thus avoiding unnecessary restrictions on responses.
Table 1 reports summary statistics on the Feelings Scale and also contains dummy variables (Negative feelings, Neutral feelings and Positive feelings) indicating whether subjects stated they would experience negative, positive or neutral feelings from calorie information.
The net benefit to consumers from the calorie salience nudge is represented by their WTP for calorie information. To elicit their WTP for calorie information, I used a multiple-price-list, entailing pairwise choices of no information/information, while varying meal prices (e.g., “Which would you prefer? (i) Calorie information + pay $12 for a meal at the restaurant, (ii) No calorie information + pay $12.50 for a meal at the restaurant,” etc.). Following Allcott and Kessler (2019), the multiple price-list allowed for both positive and negative WTP for the calorie information. Subject could state a WTP for calorie information within 9 closed intervals, or open intervals of $3 or more or −$3 or less. If a subject’s WTP fell in one of the closed intervals, they were assigned the average WTP within that interval. To calculate the mean value of the (open ended) end intervals (specified in Table 1 as $4 or −$4), I assume that those intervals are of the same width as their neighboring closed interval.15 Some of our subjects (29 subjects) were internally inconsistent when answering the WTP for calorie information questions.16 These subjects are dropped from any analysis entailing the WTP for information.
Figure 1: Scale used to assess emotional response to salient calorie information.
As shown by WTP calorie information in Table 1, the mean WTP for calorie information was $0.39, i.e., the average subject assigns a positive overall value to the calorie information. The dummy variable Negative WTP calorie info shows 45 percent of subjects stated a negative WTP, though, implying a preference for ignorance.
To elicit the marginal WTP for high calorie meals, subjects were randomized into one of three treatment groups – (1) the nudge treatment (received salient calorie information), (2) endogenous nudge treatment (could chose salient calorie information), (3) no nudge treatment (received no calorie information). Subjects in the exogenous information treatment were informed on the calorie content of the meals (1,000 calories in their favorite meal, 500 in the other meal). Subjects in the endogenous information treatment were asked to choose if they wanted costless calorie content of the meals before stating their marginal WTP for the high calorie meal. Subjects in the no information treatment were given no calorie information before stating their marginal WTP for the high calorie meal.17 Table 1 contains dummy variables No nudge, Nudge and Endogenous nudge indicating if a subject was part of one of these treatments.
Subject answers informed us if their marginal WTP for the high calorie meal took a value within 7 closed intervals or $8 or more or −$4 or less (note that symmetry in positive/negative WTP was not assumed, since all subjects preferred the high calorie meal, when not informed about calories). If a subject’s WTP fell in one of the closed intervals, he/she was assigned the average WTP within that interval. To calculate the mean of the end interval, I assumed that the (open ended) end intervals are of the same width as their neighboring closed interval, and assigned subjects the mean value of that interval (either $10.5 or −$5).18 Results are robust over different specifications of the end intervals. Subjects (30/417) who were internally inconsistent (see footnote 16) in their answers to the questions used to elicit the marginal WTP for the high calorie meal are excluded from any analysis entailing this WTP measure. Variable Marginal WTP high cal meal in Table 1 shows that the mean premium subjects were willing to pay for their favorite (high calorie) meal was $4.85.
At the end of the experimental survey, all subjects answered a battery of questions measuring eating self-control, general health and health attitudes, as well as common demographics. Self-control may be domain specific and eating-self-control has been shown to better explain behavioral responses to nutritional information, than does general self-control (Haws et al., 2016). This study uses the eating self-control measure developed by Haws et al. (2016), which is an adjustment of the frequently used general self-control measure by Tangney et al. (2004). As shown by Table 1, the scores on self-control range from 10 to 47, and the sample mean score is 26.19
The age variable is based on the midpoints of age categories. The mean age of the subjects is around 45 years. Similarly, the income variable is based on midpoints of income categories, and the mean annual subject income is $48,000.20
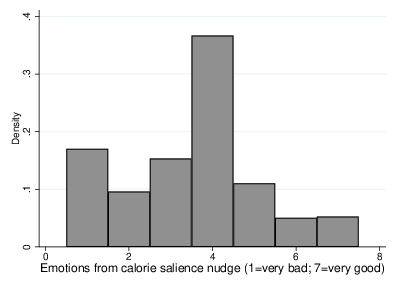
Figure 2: Histogram of the emotional response to calorie information.
Finally, Table 1 reports subjects’ stated scores on two Likert-scale questions regarding their General health and Wish to eat healthier out. These questions were posed as follows: To what extent do you agree with the following? “I am in excellent health.” (1=disagree, 5=very much agree) “I wish I could make healthier food choices when eating out.” (1=disagree, 5=very much agree).
Figure 2 is a histogram of subjects’ stated responses on the Feelings Scale, i.e., the emotional response to calorie information in our hypothetical meal scenario. Higher values on the Feelings Scale represent more positive emotions. Specifically, the value 4 represents emotional indifference (no emotional impact) from the calorie information, values higher than 4 represent a positive emotional response to the information while values lower than 4 represent a negative emotional response. On average, subjects state an emotional value of 4.487, which is slightly positive. Of all 417 subjects, 153 subjects (37 percent) are emotionally indifferent to the information, 174 subjects (42 percent) are positive, and 89 subjects (21 percent) are negative. This finding suggests that, although a calorie salience nudge may not evoke emotions in some consumers, it does evoke (positive or negative) emotions in the majority (63 percent) of consumers.
Our result matters to the notion of nudges as emotional “taxes”. Although I find that some consumers (21 percent) are emotionally taxed by the calorie salience nudge, I find a larger group of consumers (42 percent) are emotionally subsidized by the same nudge, while the remaining consumers are indifferent. Hence, on average, consumers seem to be emotionally subsidized by the calorie salience nudge.
Are negative emotions more likely to be experienced by people with low self-control, i.e., those who may benefit from such emotions? To address this question, I examine the correlation between the Feelings Scale and eating self-control. I find the correlation coefficient (Pearson’s r) is 0.124 (p=0.012, N=417). The sign of the correlation coefficient indicates that negative emotions are more likely to be experienced by people of lower self-control – people with lower levels of self-control are more likely to be emotionally taxed, while people with high self-control are more likely to be subsidized.
Income shows no correlation with the Feelings Scale (r=0.000 (N=417). Thus, the emotional tax represented by the calorie salience nudge seems neither regressive nor progressive – it seems to be “flat”.
People with low self-control inherently have a harder time regulating their food consumption, than do those with high self-control. However, it is entirely possible that their behavioral adjustments from the nudge differ, and even exceed, the behavioral adjustments from people with high self-control, given the heterogeneous emotional impact of the nudge. People with low self-control are likely to be emotionally taxed (as opposed to indifferent or subsidized).
Behavioral adjustments from the nudge are measured by changes in a person’s marginal WTP for his/her favorite meal. As stated in Section 2, the hypothetical nature of the experiment offered the advantage of designing the experiment such that a subject’s favorite meal (regardless of if they chose shrimp or meatballs), was always high calorie. Hence, the calorie salience nudge should nudge all subjects to switch to the lower calorie meal, if they are concerned with the calorie amount of their favorite meal.
The individual change in demand for the high calorie (i.e., favorite) meal is the change in WTP for the favorite meal when subjected to the Nudge treatment, compared to when not being nudged, the No Nudge treatment. In total, 289 subjects participated in these treatments and provided internally consistent answers to the meal WTP questions.
First, I ask whether the calorie salience nudge affects average demand for high calorie meals. Mean marginal WTP was $6.10 in the No Nudge treatment and $4.65 in the Nudge treatment (p=.029 by t test, N=289).
To ask whether the nudge has a similar effect on demand for the high calorie meal (as measured by marginal WTP) across levels of self-control, I first divided subjects into equal-sized categories of low, medium and high self-control. For the low self-control consumers, the nudge has no effect on the marginal WTP ($5.15 for No Nudge, $5.34 for Nudge; p=.568 by one-tailed t-test; note that the nudge is designed to reduce demand for high calorie, so this effect is slightly in the wrong direction). In contrast, the nudge has the expected effect on WTP for the high calorie meal for people with higher self-control. Specifically, the mean marginal WTP for the high calorie meal for people with high self-control is $6.70 (N=41) when not subjected to the nudge and $4.43 (N=65) (p=0.021, one tailed). Thus, people with high self-control respond to the nudge by reducing their demand for the high calorie meal. Results are similar for those with medium self-control ($6.14 when not nudged, N=32; $4.07 when nudged, N=56, p=0.050). Using a continuous measure of self-control rather than the three categories, the interaction between self-control and presence of the nudge, in their effect on marginal WTP, was significant (p=.049 two tailed).
In sum, people with higher levels of self-control seem to benefit more from the nudge than those with low self-control, in terms of health improving behavioral adjustments. This also raises the question – is a nudge that represents an emotional subsidy (as experienced by those with high self-control) more efficient in changing behavior, compared to a nudge that represents a tax (as experienced by those with low self-control)? Or is the asymmetric behavioral response across self-control levels mainly driven by the bias itself – that it is harder for those with low self-control to adjust consumption, and the emotional tax is not high enough to incentivize behavioral change? Future research might want to address these questions.
So far, the findings imply that people with low self-control both experience a (higher) emotional cost from the nudge and no (or, at best, few) benefits from consumption adjustments, compared to higher level self-control consumers. It therefore seems reasonable to expect people with low self-control to value the nudge less, compared to those with higher self-control. In the following two sections, I empirically investigate the value consumers assign to the nudge, on average and across self-control and income.
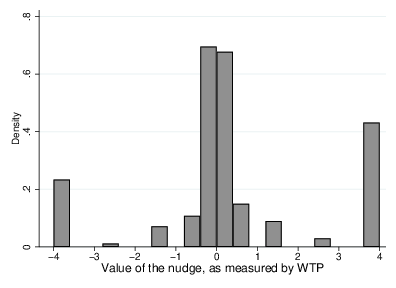
Figure 3: Histogram of the consumer value of the calorie salience nudge.
Figure 3 shows a histogram of the value consumers attach to the nudge, as given by WTP for calorie information (WTP calorie info). Of all 417 subjects, 388 answered the WTP questions in an internally consistent manner (see Footnote 16). Of these subjects, 40.46% state a WTP that is between −$0.05 and $0.05, implying they are either entirely, or close to, indifferent to the calorie salience nudge. The share of subjects stating a negative WTP that is −$0.30 or lower is 22.16%, while 39.95% state a positive WTP that is $0.30 or higher. The average WTP for calorie information is $0.39, and the sum of WTP for the calorie information over all 388 subjects is $152.85, suggesting the calorie salience nudge increases total consumer welfare in this study.
I proceed by examining the distributional impact of the nudge over self-control and income. The correlation coefficient (r) for WTP for calorie information and eating self-control is 0.137 (p=0.007, N=388). This implies that consumers with lower levels of self-control are less likely to believe they will obtain short-term benefit from the calorie salience nudge, compared to consumers with higher levels of self-control. I also examine the impact of WTP for calorie information from self-control using Tobit regressions, censored at the lower limit (−4) and the upper limit (4). The main result is unchanged. The regression model implies that if eating self-control increases by one unit on the scale (from 10 to 47), subjects are willing to pay around $0.10 more for calorie information, which is quite substantial, given the mean WTP for calorie information is $0.39. There is no apparent correlation between the value of the nudge and income (r=.055).
Table 2: Reasons for wanting the calorie salience nudge with percentage of subjects who agree.
Reason for wanting information % The calorie content would matter to my meal choice. 0.487 I would enjoy my meal more if I knew the calorie content. 0.272 The calorie information would not affect my meal choice, but I would be curious to know. 0.448 I do not know. 0.043 Other. 0.034
Finally, subjects were surveyed on why they assigned a positive or negative value to the calorie salience nudge. Specifically, subjects who stated a positive WTP for the calorie salience nudge (N=232) were provided the following message: “Please let us know why you would want calorie information when deciding on your meal at the restaurant. Mark all alternatives that apply”. They were then presented with the alternatives shown in the first column in Table 2.
The answer alternatives provided to subjects who positively value the nudge focused on benefits from food adjustments, emotional benefits and curiosity. As stated above, the benefit of information is typically that people can make choices that better align with their preferences, e.g., adjust their meal choice based on the information. Some people might also experience negative emotions from uncertainty (e.g., Ellsberg, 1961; Ahn et al., 2014; Machina, 2014; Gneezy et al., 2015; Trautman et al., 2015). Further, studies show curiosity strengthens the desire to learn new information (Berlyne, 1949, 1966; Loewenstein, 1994; Collins et al., 2004; Litman et al., 2005) and people may emotionally benefit from satisfying their curiosity (e.g., Litman, 2005).
Table 3: Reasons for not wanting the calorie salience nudge with percentage of subjects who agree.
Reason for not wanting information % I don’t want to think of calories when I eat out. 0.654 I would not want to know the calorie content because it would not matter to my meal choice anyway. 0.422 Knowing the calorie content would make me feel guilty about eating my meal. 0.184 I would enjoy my meal less if I knew the calorie content. 0.189 I knew the calorie content of the meals without having to take the calorie information. 0.022 Calorie information doesn’t mean anything to me, since I do not know how many calories I’m supposed to eat anyway. 0.189 I do not know. 0.038 Other. 0.016
The second column in Table 2 shows the share of subjects who agreed with each alternative. The main reasons people value calorie information are that it helps adjust consumption (i.e., it matters to meal choice) and satisfies curiosity – 45%–50% of subjects who positively value calorie information state those reasons for wanting calorie information. A large share (almost 30 percent) state that they would enjoy their meal more if they knew the calorie content. These results support the idea that people who positively value information do so because information may benefits them emotionally and enables them to adjust consumption.
Subject who instead stated that they negatively value calorie information (N=185) were asked to mark any of the alternatives in the first column of Table 3. The second column shows the share of subjects who agreed with each alternative.
Here, the statements provided to subjects focused on emotional discomfort from the information and aversion to irrelevant information as the main benefits to choosing ignorance. Studies suggest people often want to avoid costless health-related information because it evokes negative emotions (Kőszegi, 2003; Oster et al., 2013; Thunström et al., 2016). Also, people may negatively value information they know will be irrelevant (Rop et al., 2017). People who a priori expect the information not to affect their meal choice (e.g., someone who does not care about calorie information, has very low self-control, or does not know how to interpret the information) may therefore prefer to avoid the information. The statements provided to subjects who stated negatively value calorie information therefore focused on negative emotions evoked by the information and preferences for ignorance as a result of the information being irrelevant.
Table 3 implies both hedonic reasons and irrelevance of the information are important motivations for not wanting calorie information, thus supporting the idea that people who experience negative emotions and less of meal adjustments attach less value to the nudge. Around 65% of those who prefer ignorance of costless calorie information state they do not want to think of calorie information when eating out, while 18%–19% state the information would make them feel guilty and/or enjoy their meal less. Further, 42% state the information would not matter to their meal choice, and 19% state the information is irrelevant because they do not know the meaning of the information – the amount of calories in a meal will not matter to people who do not know how much of calories they should aim to eat. Very few subjects (2 percent) state they would not want the nudge because the nudge is not informative.
Information, such as salience nudges, helps consumers make decisions better aligned with their preferences, and may thereby increase consumer utility. However, information may also come at an emotional cost. Salience nudges have been referred to as “emotional taxes”, based on the argument that the message they convey evokes negative emotions (e.g., Glaeser, 2006; Loewenstein & O’Donoghue, 2006). The welfare impact of information may therefore result from a tradeoff between the benefit from adjustments to consumption and an emotional cost. This paper examines the extent to which a restaurant meal calorie salience nudge – a policy implemented U.S. wide in 2018 – evokes emotions and affects short-run consumer welfare. Both average and distributional effects are addressed, with a focus on distributional effects over eating self-control and income.
I find that emotions evoked by the calorie salience nudge range from positive to negative, such that some consumers (21 percent of subjects) are emotionally taxed, while others (42 percent of subjects) are emotionally subsidized by a calorie salience nudge. Remaining consumers are emotionally unaffected by the nudge. These results support the idea that a salience nudge may act as an emotional tax but only for some. This study suggests the calorie salience nudge is more likely to act as an emotional subsidy than an emotional tax – a possibility not previously discussed in the literature.
The results could suggest that a calorie salience nudge evokes the right emotions in the right people – negative emotions are evoked in those who might benefit from such emotions (people with low eating self-control) while positive emotions are evoked in those with high self-control. However, for the emotional tax to benefit people with low self-control, it needs to result in behavioral change (reduced calorie consumption) – otherwise it only causes emotional discomfort, without providing any benefits. The results from this study imply that the nudge causes little, if any, behavioral adjustments for people of low self-control. People with high self-control adjust their consumption by more. Given people with low self-control are emotionally taxed and receive less adjustment benefits from the nudge, it is unsurprising that the results also indicate that people with low self-control are more likely to assign a negative/lower net value to the calorie salience nudge.
The results in this study imply that health improvements from the nudge may be particularly limited for people with low self-control, not only because they make no, or little, adjustments to consumption when exposed to the nudge (as in our study), but also because a negative value of the nudge implies they might avoid the nudge altogether (experiencing no adjustments), if possible.21 In contrast, those who benefit the least in terms of improved health assign the highest value to the nudge – people with high self-control benefit emotionally from the nudge and also to the greatest extent use the informational content of the nudge to undertake health improving behavioral change. A policy maker focused on public health might find this disappointing, given public health benefits from the nudge are likely more limited if calorie consumption of people with low self-control is unaffected. Many studies find that people with low levels of self-control are particularly prone to making unhealthy food choices (Tangney et al., 2004; Wills et al., 2007; de Ridder et al., 2012; Salmon et al., 2014).
This study finds that the net value assigned by consumers to the nudge ranges from negative to positive. Results also indicate that the average consumer positively values the nudge. From a consumer perspective, mandatory calorie labeling may therefore be welfare increasing. Further, the overall positive impact on consumer welfare from the nudge ($152.85) in the context of the experiment is likely on the conservative end. If all experiment subjects who negatively value the nudge successfully avoid the nudge (i.e., if subjects with a negative WTP are excluded from the calculation of total consumer welfare from the nudge), overall short-term consumer welfare from the nudge more than doubles, to $356.40.
Further, the results in this study support recent findings on the welfare effects of information. Allcott and Kessler (2019) find consumers assign a value to home energy usage reports substantially lower than the so called “endpoints” (adjustments to savings and costs), that is often used to represent the impact on consumers in cost-benefit analysis. Sunstein (2018) argues that emotional and cognitive costs might explain this discrepancy, and need to be included in the welfare measure. This study lends support to that argument. If there are no behavioral adjustments for people of low self-control from a calorie salience nudge, endpoints (the monetary equivalent of health savings and cost savings) from the nudge should be zero for this subgroup. Yet, the emotional discomfort causes people with low self-control to negatively value the nudge, implying that endpoints would overstate the welfare impact of the nudge for this subgroup. In contrast, endpoints might underestimate the value for those with high self-control.
However, WTP as a measure of consumer welfare from the nudge should also be interpreted with caution. As discussed in depth in Sunstein (2018), obtaining an unbiased welfare measure of information is a difficult task. If consumers are unbiased and fully informed about all benefits and costs (including emotional costs and benefits) to the nudge, the WTP measure is indeed an unbiased measure of the consumer value of the nudge (see, e.g., Viscusi, 2018). However, this requires that the consumer accurately predicts the extent to which the nudge affects his/her calorie consumption, the full benefits and costs (direct and emotional) that follow from the adjustments, attaches an appropriate time discount rate to any future benefits and costs, and is otherwise unbiased in how he/she weighs costs and benefits. Given this daunting task, one might expect that many (most/all?) consumers will fail to produce an unbiased WTP measure.
Of concern is also that the very bias the nudge should help (low self-control) might cause consumers to undervalue the nudge. It makes sense that low self-control consumers in this study attach a lower value to the nudge, given they experience higher emotional costs and no or little benefits (health-improving consumption adjustments), compared to those with higher self-control. However, it is possible that their WTP is sub-optimally low, as a direct consequence of their self-control problem. In fact, Thunström et al. (2016) show that low self-control may cause a person to negatively value calorie information. However, in their study, subjects are in a “hot” state when making the choice of taking/ignoring calorie information – they are asked about their preferences for calorie information in conjunction with eating a real meal. The design of this study might help counteract a biasing effect on WTP from low self-control. Due to the hypothetical nature of this study, subjects value the nudge in a “cold” state, meaning they are less likely to be influenced by their bias when stating their WTP. How to elicit unbiased estimates of welfare effects from salience nudges is a difficult, but important, area for future research.22
Let us compare the incidence of a calorie salience nudge to a sales tax designed to achieve the same purpose as a calorie salience nudge – a tax on unhealthy food (e.g., a “fat tax”). This study generally suggests an interesting feature of emotional taxes, compared to fiscal taxes – a nudge evokes different emotions (both in magnitude and sign) in different people. It is found that this emotional heterogeneity might be beneficial – those who might benefit from reducing their calorie consumption are taxed, while others are subsidized. As formalized by O’Donogue and Rabin (2006), this is not the case with a fiscal tax aimed at correcting over-consumption from low self-control – a fiscal tax on high calorie food, aimed to correct for over-consumption due to limited self-control, benefits those with low self-control while it always harms consumers with perfect self-control, unless they are fiscally compensated. An important distinction between a sales tax and a salience nudge is also that sales taxes are legally binding. A salience nudge can, however, be avoided. If consumers who might be harmed by the nudge successfully avoid it, consumer welfare increases. Finally, fiscal taxes designed to encourage healthier food choices have generally been found to be regressive (e.g., Cash et al., 2005; Mytton et al., 2007; Chouinard et al., 2007; Madden, 2015; Muller et al., 2017). I find no adverse effects on low income earners from a calorie salience nudge. This finding may be a feature that speaks to the advantage of a calorie salience nudge, over a sales tax on calories/unhealthy food.
However, an important topic for future research is to compare the behavioral impact on consumption and welfare from sales taxes versus emotional taxes. This study finds no or little behavioral impact from the nudge on those who might benefit the most from making healthier food choices. Hence, the calorie salience nudge might be too weak of a policy (perhaps cause too little of emotional discomfort) to correct for over consumption from low self-control. This result might help explain results from field studies that observe no, or minor, effects on behavior from calorie salience nudges (e.g., Borgmeier & Westenhoefer, 2009; Elbel et al., 2009, 2011; Vadiveloo et al., 2011). The efficiency of salience nudges in nudging people to behavioral change is important to document, given there is a risk that salience nudges become quick fixes in a complex political landscape, crowding out alternative policies with more beneficial impacts on social welfare (that may, however, be harder to implement politically).
The results from this study also raise questions about the design of nudges. Why do people with high levels of self-control adjust their consumption by more when nudged, compared to those with low self-control? Is it because low self-control makes it inherently difficult to make adjustments (and the emotional tax provides insufficient incentives to do so), or it is because of the type of emotion the nudge evokes – that emotional taxes are less efficient than emotional subsidies in encouraging a desired behavior – or both? It is also worth asking whether different types and designs of calorie salience nudges may have different impacts on emotions, adjustments and net consumer welfare. For instance, Enax et al. (2016) find that, the more salient the nutritional label, the more effective in changing food choices. Do more salient nudges also have a greater impact on emotions, behavioral adjustments and/or consumer welfare? Future research may want to investigate further these issues.
Finally, this study has some limitations. It is the first study to measure emotional effects of nudges, and connect those to consumer welfare effects. Its results should therefore be regarded as preliminary findings, and might be nudge, context and sample dependent. Second, this study only examines short-term emotional and welfare effects of a calorie salience nudge. The long-term impact of the nudge may differ. For instance, Garrett et al. (2016) find that feelings of guilt are eroded with the frequency of (knowingly) engaging in impulsive behavior. Such guilt erosion may be possible also with food consumption, which would imply negative emotions from the nudge might evaporate over time. Further, nudges may cause reactance (Brehm, 1966) – studies find people may increase the behavior a salience nudge was intended to restrict (e.g., Cacioppo & Petty, 1979; Calder & Sternthal, 1980; Petty & Cacioppo, 1986; Erceg-Hurn & Steed, 2011; LaVoie et al., 2017) Hall et al. (2018). Reactance to nudges affect their welfare effects (Debnam & Just, 2017). The strength of such reactance may differ over the short and long run. The long-term effects of the calorie salience nudge is an important topic for future research.
Ahn, D., Choi, S., Gale, D., & Kariv, S. (2014). Estimating ambiguity aversion in a portfolio choice experiment. Quantitative Economics, 5(2), 195–223.
Alberts, H. J., Martijn, C., & De Vries, N. K. (2011). Fighting self-control failure: Overcoming ego depletion by increasing self-awareness. Journal of Experimental Social Psychology, 47(1), 58–62.
Allais, O., Bertail, P., & Nichèle, V. (2010). The effects of a fat tax on French households’ purchases: A nutritional approach. American Journal of Agricultural Economics, 92(1), 228-245.
Allcott, H., & Kessler, J. B. (2015). The welfare effects of nudges: A case study of energy use social comparisons. American Economic Journal: Applied Economics, 11(1), 236–276.
Andrade, E. B., & Ariely, D. (2009). The enduring impact of transient emotions on decision making. Organizational Behavior and Human Decision Processes, 109(1), 1–8.
Arneson, R. (1997) Paternalism, Utility and Fairness. In J.S. Mill’s on liberty: Critical essays, ed. G. Dworkin, Lanham, Md, Rowman & Littlefield, 82–112.
Aronsson, T., & Thunström, L. (2008). A note on optimal paternalism and health capital subsidies. Economics Letters, 101(3), 241-242.
Auchincloss, A. H., Leonberg, B. L., Glanz, K., Bellitz, S., Ricchezza, A., & Jervis, A. (2014). Nutritional value of meals at full-service restaurant chains. Journal of Nutrition Education and Behavior, 46(1), 75–81.
Berlyne, D. E. (1949). ‘Interest’ as a psychological concept. British journal of psychology. General section, 39(4), 184–195.
Berlyne, D. E. (1966). Curiosity and exploration. Science, 153(3731), 25–33.
Blumenschein, K., Blomquist, G. C., Johannesson, M., Horn, N., & Freeman, P. (2008). Eliciting willingness to pay without bias: Evidence from a field experiment. The Economic Journal, 118(525), 114–137.
Borgmeier, I. & Westenhoefer, J. (2009). Impact of different food label formats on healthiness evaluation and food choice of consumers: A randomized-controlled study. BMC Public Health, 9, 184.
Bosman, R., & Van Winden, F. (2002). Emotional hazard in a power-to-take experiment. The Economic Journal, 112(476), 147–169.
Brey, J., & Otterbein, H. (2016). The soda tax battle’s biggest winners and losers. Philadelphia, June 16. http://www.phillymag.com/citified/2016/06/16/soda-tax-passes-winners-and-losers.
Buehler, R., & McFarland, C. (2001). Intensity bias in affective forecasting: The role of temporal focus. Personality and Social Psychology Bulletin. 27(11), 1480–1493.
Camerer, C., Issacharoff, S., Loewenstein, G., O’Donoghue, T., & Rabin, M. (2003). Regulation for conservatives: Behavioral economics and the case for “asymmetric paternalism.” University of Pennsylvania Law Review, 151(3), 1211–1254.
Cash, S. B., Sunding, D. L., & Zilberman, D. (2005). Fat taxes and thin subsidies: Prices, diet, and health outcomes. Acta Agriculturae Scand Section C, 2(3-4), 167–174.
Chouinard, H. H., Davis, D. E., LaFrance, J. T., & Perloff, J. M. (2007). Fat taxes: Big money for small change. In Forum for Health Economics & Policy (Vol. 10, No. 2).
Collins, R. P., Litman, J. A., & Spielberger, C. D. (2004). The measurement of perceptual curiosity. Personality and Individual Differences, 36(5), 1127–1141.
Coricelli, G., Joffily, M., Montmarquette, C., & Villeval, M. C. (2010). Cheating, emotions, and rationality: An experiment on tax evasion. Experimental Economics, 13(2), 226–247.
Cubitt, R. P., Drouvelis, M., & Gächter, S. (2011). Framing and free riding: Emotional responses and punishment in social dilemma games. Experimental Economics, 14(2), 254–272.
Cummings, R. G., Harrison, G. W., & Rutström, E. E. (1995). Homegrown values and hypothetical surveys: Is the dichotomous choice approach incentive-compatible? American Economic Review, 85(1), 260–266.
Dana, J., Weber, R.A., & Xi Kuang, J., (2007). Exploiting moral wiggle room: Experiments demonstrating an illusory preference for fairness. Economic Theory, 33(1), 67–80.
Debnam, J., & Just, D. R. (2017). Endogenous responses to paternalism: Examining psychological reactance in the lab and the field. Unpublished Working Paper.
de Ridder, D. T. D., Lensvelt-Mulders, G., Finkenauer, F. C., Stok, M. & Baumeister, R.F. (2012). Taking stock of self-control: A meta-analysis of how trait self-control relates to a wide range of behaviors. Personality and Social Psychology Review, 16(1), 76–99.
Diepeveen, S., Ling, T., Suhrcke, M., Roland, M., & Marteau, T. M. (2013). Public acceptability of government intervention to change health-related behaviours: A systematic review and narrative synthesis. BMC Public Health, 13(1), 756.
Eckel, C.C., & Grossman, P.J. (2002). Sex differences and statistical stereotyping in attitudes toward financial risk. Evolution and Human Behavior, 23(4), 281–295.
Elbel, B., Kersh, R., Brescoll, V. L., & Dixon, L. B. (2009). Calorie labeling and food choices: A first look at the effects on low-income people in New York City. Health Affairs, 28(6), w1110–w1121.
Elbel, B., Gyamfi, J., & Kersh, R. (2011). Child and adolescent fast-food choice and the influence of calorie labeling: A natural experiment. International Journal of Obesity, 35(4), 493–500.
Ellsberg, D. (1961). Risk, ambiguity, and the savage axioms. The Quarterly Journal of Economics, 75(4), 643–669.
Erceg-Hurn, D. M., & Steed, L. G. (2011). Does exposure to cigarette health warnings elicit psychological reactance in smokers? Journal of Applied Social Psychology, 41(1), 219–237.
Felsen, G., Castelo, N., & Reiner, P. B. (2013). Decisional enhancement and autonomy: Public attitudes towards overt and covert nudges. Judgment and Decision Making, 8(3), 202–213.
Gigerenzer, G., & Garcia-Retamero, R. (2017). Cassandra’s regret: The psychology of not wanting to know. Psychological Review, 124(2), 179.
Gilbert, D. T., Driver-Linn, E., & Wilson, T. D. (2002). The trouble with Vronsky: Impact bias in the forecasting of future affective states. In L. Feldman-Barrett & P. Salovey (Eds.), The wisdom of feeling (pp. 114-143). New York: Guilford.
Gneezy, U., Imas, A., & List, J. (2015). Estimating individual ambiguity aversion: A simple approach. (No. w20982), National Bureau of Economic Research.
Glaeser, E.L. (2006). Paternalism and psychology. University of Chicago Law Review, 73(1), 133–156.
Golman, R., Hagmann, D., & Loewenstein, G. (2017). Information avoidance. Journal of Economic Literature, 55(1), 96-135.
Grossman, Z. (2014). Strategic ignorance and the robustness of social preferences. Management Science, 60(11), 2659–2665.
Grossman, Z., & van der Weele, J. (2017). Self-image and willful ignorance in social decisions. Journal of the European Economic Association, 15(1), 173–217.
Hagman, W., Andersson, D., Västfjäll, D., & Tinghög, G. (2015). Public views on policies involving nudges. Review of Philosophy and Psychology, 6(3), 439–453.
Hall, M. G., Marteau, T. M., Sunstein, C. R., Ribisl, K. M., Noar, S. M., Orlan, E. N., & Brewer, N. T. (2018). Public support for pictorial warnings on cigarette packs: An experimental study of US smokers. Journal of Behavioral Medicine, 41(3), 398–405.
Haws, K. L., Davis, S. W., & Dholakia, U. M. (2016). Control over what? Individual differences in general versus eating and spending self-control. Journal of Public Policy & Marketing, 35(1), 37–57.
Hertwig, R., & Engel, C. (2016). Homo ignorans: Deliberately choosing not to know. Perspectives on Psychological Science, 11(3), 359–372.
Incekara-Hafalir, E., & Linardi, S. (2017). Awareness of low self-control: Theory and evidence from a homeless shelter. Journal of Economic Psychology, 61, 39–54.
Johannesson, M., Liljas, B., & Johansson, P. O. (1998). An experimental comparison of dichotomous choice contingent valuation questions and real purchase decisions. Applied Economics, 30(5), 643-647.
Johnson, E. J., & Goldstein, D. (2003). Do defaults save lives? Science, 302, 1338–1339.
Johnson, E. J., Shu, S. B., Dellaert, B. G., Fox, C., Goldstein, D. G., Häubl, G., Larrick, R.P., Payne, J.W., Peters, E., Schkade, D., Wansink, B., & Weber, E.U. (2012). Beyond nudges: Tools of a choice architecture. Marketing Letters, 23(2), 487–504.
Jordan, J., McAuliffe, K., & Rand, D. (2016). The effects of endowment size and strategy method on third party punishment. Experimental Economics, 19(4), 741–763.
Jung, J. Y., & Mellers, B. A. (2016). American attitudes toward nudges. Judgment and Decision Making, 11(1), 62–74.
Junghans, A. F., Cheung, T. T., & de Ridder, D. T. D. (2015). Under consumers’ scrutiny — an investigation into consumers’ attitudes and concerns about nudging in the realm of health behavior. BMC Public Health, 15(1), 336.
Karlsson, N., Loewenstein, G., & Seppi, D. (2009). The ostrich effect: Selective attention to information. Journal of Risk and Uncertainty, 38(2), 95–115.
Kőszegi, B. (2003). Health anxiety and patient behavior. Journal of Health Economics, 22(6), 1073–1084.
Krieger, J. W., Chan, N. L., Saelens, B. E., Ta, M. L., Solet, D., & Fleming, D. W. (2013). Menu labeling regulations and calories purchased at chain restaurants. American Journal of Preventive Medicine, 44(6), 595–604.
Lachat, C., Nago, E., Verstraeten, R., Roberfroid, D., Van Camp, J., & Kolsteren, P. (2012). Eating out of home and its association with dietary intake: A systematic review of the evidence. Obesity Reviews, 13(4), 329–346.
Laibson, D. (1997). Golden eggs and hyperbolic discounting. The Quarterly Journal of Economics, 112(2), 443–478.
Larrick, R. P., & Soll, J. B. (2008). The mpg illusion. Science, 320, 1593–1594.
LaVoie, N. R., Quick, B. L., Riles, J. M., & Lambert, N. J. (2017). Are graphic cigarette warning labels an effective message strategy? A test of psychological reactance theory and source appraisal. Communication Research, 44(3), 416–436.
Lerner, J. S., Small, D. A., & Loewenstein, G. (2004). Heart strings and purse strings: Carryover effects of emotions on economic decisions. Psychological Science, 15(5), 337–341.
Lerner, J. S., Li, Y., Valdesolo, P., & Kassam, K. S. (2015). Emotion and decision making. Annual Review of Psychology, 66.
Lin, B., Guthrie, J.F., & Frazao, E. (1999). Nutrient contribution of food away from home. America’s Eating Habits: Changes and Consequences. Washington, DC: US Department of Agriculture, Economic Research Service, 213–242.
List, J. A., & Gallet, C. A. (2001). What experimental protocol influence disparities between actual and hypothetical stated values? Environmental and Resource Economics, 20(3), 241–254.
Litman, J. (2005). Curiosity and the pleasures of learning: Wanting and liking new information. Cognition & Emotion, 19(6), 793-814.
Litman, J., Hutchins, T., & Russon, R. (2005). Epistemic curiosity, feeling-of-knowing, and exploratory behaviour. Cognition & Emotion, 19(4), 559–582.
Little, J., & Berrens, R. (2004). Explaining disparities between actual and hypothetical stated values: Further investigation using meta-analysis. Economics Bulletin, 3(6), 1–13.
Lockwood, B. B., & Taubinsky, D. (2017). Regressive sin taxes. (No. w23085), National Bureau of Economic Research.
Loewenstein, G. (1994). The psychology of curiosity: A review and reinterpretation. Psychological Bulletin, 116(1), 75–98.
Loewenstein, G. (2000). Emotions in economic theory and economic behavior. American Economic Review, 90(2), 426–432.
Loewenstein, G., & O’Donoghue, T. (2006). We can do this the easy way or the hard way: Negative emotions, self-regulation, and the law. University of Chicago Law Review, 73(1), 183–206.
Machina, M. (1989). Dynamic consistency and non-expected utility models of choice under uncertainty. Journal of Economic Literature, 27(4), 1622–1668.
Machina, M. (2014). Ambiguity aversion with three or more outcomes. American Economic Review, 104(12), 3814–40.
Madden, D. (2015). The poverty effects of a ‘fat-tax’ in Ireland. Health Economics, 24(1), 104–121.
Mancino, L., Todd, J., & Lin, B. H. (2009). Separating what we eat from where: Measuring the effect of food away from home on diet quality. Food Policy, 34(6), 557–562.
Mani, A., Mullainathan, S., Shafir, E., & Zhao, J. (2013). Poverty impedes cognitive function. Science, 341(6149), 976-980.
Marreiros, H., Tonin, M., Vlassopoulos, M., & Schraefel, M. C. (2017). “Now that you mention it”: A survey experiment on information, inattention and online privacy. Journal of Economic Behavior & Organization, 140, 1–17.
Miller, F. G., & Wertheimer, A. (2007). Facing up to paternalism in research ethics. Hastings Center Report, 37(3), 24-34.
Mitchell, T. R., Thompson, L., Peterson, E., & Cronk, R. (1997). Temporal adjustments in the evaluation of events: The “rosy view”. Journal of Experimental Social Psychology, 33(4), 421-448.
Mokdad, A. H., Marks, J. S., Stroup, D. F., & Gerberding, J. L. (2004). Actual causes of death in the United States, 2000. JAMA, 291(10), 1238–1245.
Muller, L., Lacroix, A., Lusk, J. L., & Ruffieux, B. (2017). Distributional impacts of fat taxes and thin subsidies. The Economic Journal.
Murphy, J. J., Allen, P. G., Stevens, T. H., & Weatherhead, D. (2005). A meta-analysis of hypothetical bias in stated preference valuation. Environmental and Resource Economics, 30(3), 313–325.
Mytton, O., Gray, A., Rayner, M., & Rutter, H. (2007). Could targeted food taxes improve health? Journal of Epidemiology & Community Health, 61(8), 689–694.
Naqvi, N., Shiv, B., & Bechara, A. (2006). The role of emotion in decision making: A cognitive neuroscience perspective. Current Directions in Psychological Science, 15(5), 260–264.
Nickerson, R. S. (1998). Confirmation bias: A ubiquitous phenomenon in many guises. Review of General Psychology, 2(2), 175-220.
O’Donoghue, T., & Rabin, M. (1999). Doing it now or later. American Economic Review, 89(1), 103–124.
O’Donoghue, T., & Rabin. M. (2003a). Studying optimal paternalism, Illustrated by a model of sin taxes. American Economic Review, 93(2), 186–191.
O’Donoghue, T., & Rabin, M. (2003b). Self-awareness and self-control. In G. Loewenstein, D. Read, and R. Baumeister (Eds.), Time and decision: Economic and psychological perspectives on intertemporal choice (pp. 217-243). New York, NY, US: Russell Sage Foundation.
O’Donoghue, T., & Rabin, M. (2006). Optimal sin taxes. Journal of Public Economics, 90(10), 1825–1849.
Onwezen, M. C., & van der Weele, C. N. (2016). When indifference is ambivalence: Strategic ignorance about meat consumption. Food Quality and Preference, 52, 96–105.
Oster, E., Shoulson, I. & Dorsey, E.R. (2013). Optimal expectations and limited medical testing: Evidence from Huntington disease. American Economic Review, 103(2), 804–830.
Pfister, H. R., & Böhm, G. (2008). The multiplicity of emotions: A framework of emotional functions in decision making. Judgment and Decision Making, 3(1), 5–17.
Rachman, S. (1994). The overprediction of fear: A review. Behaviour Research and Therapy, 32(7), 683–690.
Rachman, S., & Arntz, A. (1991). The overprediction and underprediction of pain. Clinical Psychology Review, 11(4), 339–355.
Reisch, L., & Sunstein, C. (2016). Do Europeans like nudges? Judgement and Decision Making, 11(4), 310–325.
Roberts, J. L. (2018). Nudge-proof: Distributive justice and the ethics of nudging. Michigan Law Review, 6, 1045–1066.
Rop, G., Verkoeijen, P. P., & van Gog, T. (2017). With task experience students learn to ignore the content, not just the location of irrelevant information. Journal of Cognitive Psychology, 29(5), 599–606.
Salmon, S. J., Fennis, B. M., de Ridder, D. T. D., Adriaanse, M. A., & De Vet, E. (2014). Health on impulse: When low self-control promotes healthy food choices. Health Psychology, 33(2), 103–109.
Sanfey, A. G., Rilling, J. K., Aronson, J. A., Nystrom, L. E., & Cohen, J. D. (2003). The neural basis of economic decision-making in the ultimatum game. Science, 300(5626), 1755–1758.
Sharpe Wessling, K., Huber, J., & Netzer, O. (2017). MTurk character misrepresentation: Assessment and solutions. Journal of Consumer Research, 44(1), 211–230.
Schkade, D. A., & Kahneman, D. (1998). Does living in California make people happy? A focusing illusion in judgments of life satisfaction. Psychological Science, 9(5), 340–346.
Schläpfer, F., & Fischhoff, B. (2012). Task familiarity and contextual cues predict hypothetical bias in a meta-analysis of stated preference studies. Ecological Economics, 81, 44–47.
Schmidt, N. B., Jacquin, K., & Telch, M. J. (1994). The overprediction of fear and panic in panic disorder. Behaviour Research and Therapy, 32(7), 701–707.
Schwarz, N. (2000). Emotion, cognition, and decision making. Cognition and Emotion, 14(4), 433–440.
Scourboutakos. M.J., & L’Abbe, M.R. (2012). Restaurant menus: Calories, calorie density, and serving size. American journal of preventive medicine, 43(3), 249–255.
Scourboutakos. M.J., Semnani-Azad, Z., & L’Abbe, M.R. (2013). Restaurant meals: Almost a full day’s worth of calories, fats and sodium. JAMA Internal Medicine, 173(14), 1373–1374.
Shah, A. K., Mullainathan, S., & Shafir, E. (2012). Some consequences of having too little. Science, 338(6107), 682–685.
Sieff, E. M., Dawes, R. M., & Loewenstein, G. (1999). Anticipated versus actual reaction to HIV test results. The American Journal of Psychology, 112(2), 297.
Symmons, D. P. (2002). Epidemiology of rheumatoid arthritis: Determinants of onset, persistence and outcome. Best Practice & Research Clinical Rheumatology, 16(5), 707–722.
Sunstein, C. R. (2013). Simpler: The future of government. New York, NY: Simon & Schuster.
Sunstein, C. R. (2016). The ethics of influence: Government in the age of behavioral science. Cambridge University Press.
Sunstein, C. R. (2018). The welfare effects of information. Journal of Risk and Uncertainty, Forthcoming; Harvard Public Law Working Paper No. 18-41, https://ssrn.com/abstract=3193996
Sweeny, K., Melnyk, D., Miller, W., & Shepperd, J. A. (2010). Information avoidance: Who, what, when, and why. Review of general psychology, 14(4), 340–353.
Tangney, J. P., Baumeister, R. F., & Boone, A. L. (2004). High self-control predicts good adjustment, less pathology, better grades, and interpersonal success. Journal of Personality, 72(2), 271–322.
Thaler, R. H., & Sunstein, C. R. (2008). Nudge: Improving decisions about health, wealth, and happiness. New Haven, CT: Yale University Press.
Thunström, L., Nordström, J., Shogren, J. F., Ehmke, M., & van’t Veld, K. (2016). Strategic self-ignorance. Journal of Risk and Uncertainty, 52(2), 117–136.
Thunström, L., Gilbert, B., & Jones Ritten, C. (2018). Nudges that hurt those already hurting - distributional and unintended effects of salience nudges. Journal of Economic Behavior & Organization, 153, 267–282.
USDA (2018). Food expenditures. Accessed August 21 2018. https://www.ers.usda.gov/data-products/food-expenditures.aspx
Vadiveloo, M. K., Dixon, L. B., & Elbel, B. (2011). Consumer purchasing patterns in response to calorie labeling legislation in New York City, International Journal of Behavioral Nutrition and Physical Activity, 8, 51.
Viscusi, W.K. (2018) Pricing Lives. Princeton: Princeton University Press.
Wills, T. A., Isasi, C. R., Mendoza, D., & Ainette, M. G. (2007). Self-control constructs related to measures of dietary intake and physical activity in adolescents. Journal of Adolescent Health, 41(6), 551–558.
Wilson, T. D., & Gilbert, D. T. (2003). Affective forecasting. Advances in Experimental Social Psychology, 35(35), 345–411.
Wilson, A. L., Bogomolova, S., & Buckley, J. D. (2015). Lack of efficacy of a salience nudge for substituting selection of lower-calorie for higher-calorie milk in the work place. Nutrients, 7(6), 4336–4344
World Bank (2015). World development report 2015: Mind, society, and behavior. Washington, DC.
Zeelenberg, M., Nelissen, R. M., Breugelmans, S. M., & Pieters, R. (2008). On emotion specificity in decision making: Why feeling is for doing. Judgment and Decision Making, 3(1), 18–27.
Financial support from USDA/NIFA (grant number 2016–09907) is gratefully acknowledged. This study has been registered in the American Economic Association Registry for Randomized Controlled Trials (registry number AEARCTR-0003268).
Copyright: © 2019. The authors license this article under the terms of the Creative Commons Attribution 3.0 License.
This document was translated from LATEX by HEVEA.