Judgment and Decision Making, Vol. 14, No. 4, July, 2019, pp. 455-469
Beyond reach: Do symmetric changes in motor costs affect |
Executing an important decision can be as easy as moving a mouse cursor or reaching towards the preferred option with a hand. But would we decide differently if choosing required walking a few steps towards an option? More generally, is our preference invariant to the means and motor costs of reporting it? Previous research demonstrated that asymmetric motor costs can nudge the decision-maker towards a less costly option. However, virtually all traditional decision-making theories predict that increasing motor costs symmetrically for all options should not affect choice in any way. This prediction is disputed by the theory of embodied cognition, which suggests that motor behavior is an integral part of cognitive processes, and that motor costs can affect our choices. In this registered report, we investigated whether varying motor costs can affect response dynamics and the final choices in an intertemporal choice task: choosing between a readily available small reward and a larger but delayed reward. Our study compared choices reported by moving a computer mouse cursor towards the preferred option with the choices executed via a more motor costly walking procedure. First, we investigated whether relative values of the intertemporal choice options affect walking trajectories in the same way as they affect mouse cursor dynamics. Second, we tested a hypothesis that, in the walking condition, increased motor costs of a preference reversal would decrease the number of changes-of-mind and therefore increase the proportion of impulsive, smaller-but-sooner choices. We confirmed the hypothesis that walking trajectories reflect covert dynamics of decision making, and rejected the hypothesis that increased motor costs of responding affect decisions in an intertemporal choice task. Overall, this study contributes to the empirical basis enabling the decision-making theories to address the complex interplay between cognitive and motor processes.
Keywords: motor costs, response dynamics, mouse tracking, walking path tracking, intertemporal choice
Most, if not all, of our decisions are eventually expressed in a motor output. Even if a decision seems simple (e.g., choosing between two products in a supermarket), the execution of that decision often requires our body to produce sophisticated motion (we approach and pick up the preferred product). However, motor execution of decisions and the environment surrounding the decision maker are rarely considered as a part of the decision-making process. In contrast, an embodied approach to cognition implies that perceptual experience and motor behavior are not just input and output, but an integral part of our cognitive processes (Clark, 2008,Shapiro, 2019). In the context of decision making, this approach suggests that task constraints (even those seemingly unrelated to the decision options) and the resources available to the decision-maker (e.g., the body, the environment) have direct influence on a decision (Araújo et al., 2006,CisekPastor-Bernier, 2014,LeporaPezzulo, 2015). However, the mainstream theories still treat decision making as a purely cognitive process, assuming that actions are simply a means of reporting the decision and are segregated from the underlying cognitive processes.
A notable departure from the traditional approach to decision making is the notion that cognitive processes can leave traces in their motor output, for instance, mouse cursor trajectories (Spivey et al., 2005). This notion implies that motor behavior during decision making might provide an important source of evidence concerning the character of the cognitive processes involved in a decision. In particular, hand reaching or mouse cursor trajectories can expose the degree of attraction towards an option which was not eventually chosen, or vacillation experienced prior to making the final decision (Freeman et al., 2011,McKinstry et al., 2008,Resulaj et al., 2009,SpiveyDale, 2006). These insights are not immediately available from traditional measures of decision making (choice outcomes and response times). The use of mouse- and hand-tracking paradigms has thus increased in a variety of fields (Freeman, 2018,KoopJohnson, 2013,Schulte-Mecklenbeck et al., 2017,SongNakayama, 2009).
Recent computational models explicitly link purely cognitive mechanisms (for instance, evidence accumulation) to the mouse-tracking or hand-reaching data (Calluso et al., 2015,Friedman et al., 2013,LeporaPezzulo, 2015,Quinton et al., 2014,Scherbaum et al., 2012,Wispinski et al., in press). However, most of these models assume that the link between cognition and movement is unidirectional (feedforward), stipulating that the response dynamics are affected by cognitive processes, but not the other way around. Embodied accounts, however, theorize that there must also be the link in the opposite direction: the motor constraints on decision execution will affect the decision process (CisekPastor-Bernier, 2014,LeporaPezzulo, 2015). Some evidence for this hypothesis comes from the studies on perceptual discrimination: subjects are biased towards options with lower motor costs (Hagura et al., 2017,Marcos et al., 2015). However, if only the available options are equal in terms of effort required to choose them, virtually all non-embodied models agree that our preference is invariant to the motor costs of expressing this preference.
In this registered report, we investigated whether the motor costs of reporting a decision affect decision dynamics and decisions themselves, as predicted by embodiment theories. By testing this prediction we contribute to the debate between the embodied approach and the more traditional accounts of decision making. We devised a new experimental paradigm, in which a decision maker indicates their choice by physically walking towards a preferred option; the continuous movement trajectory is recorded by a motion capture system. Our subjects also completed a mouse-tracking task, which offered the same choices and similar task geometry. In this way, we could compare the final choices and response dynamics between the walking and mouse-tracking conditions. Given that increasing motor costs reduces the probability of a preference reversal on the way to the final decision (Burk et al., 2014,MoherSong, 2014), we hypothesized that the subjects would change their mind less often when walking. We expected that this may result in systematic differences in the expressed preference between the tasks.
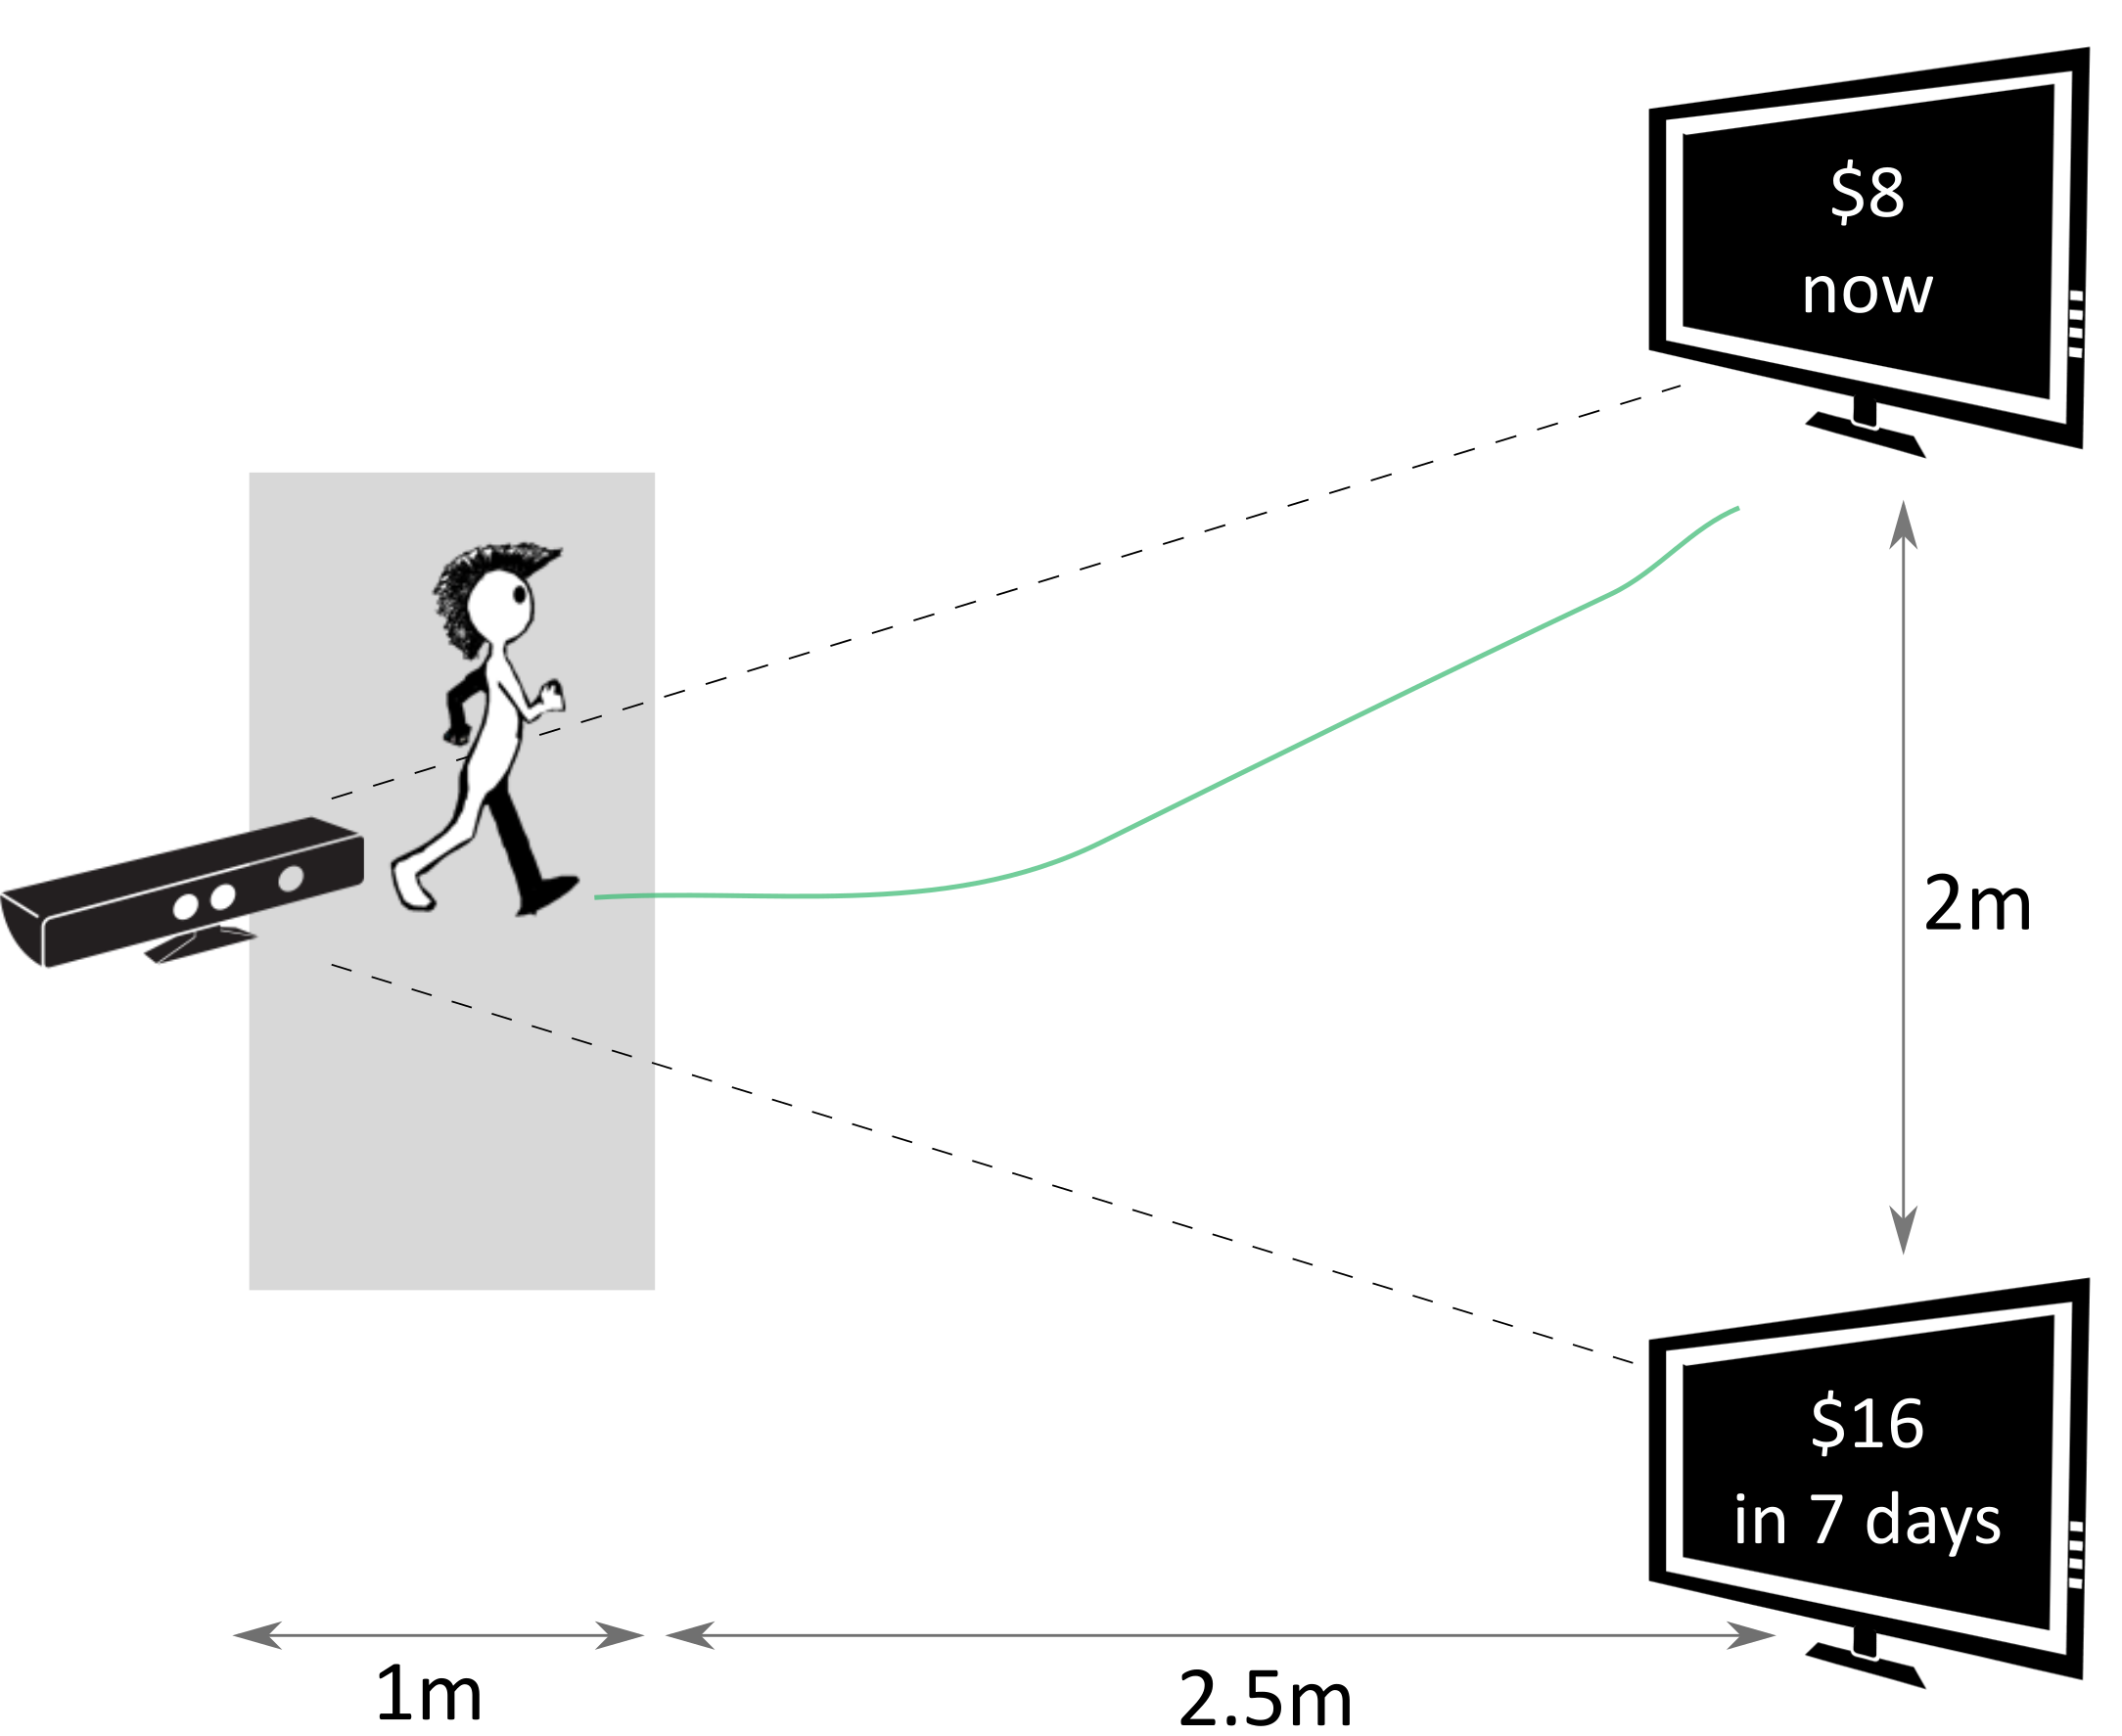
We asked whether motor costs of reporting a decision affect decision-makers’ preference and response dynamics in intertemporal choices. Such choices present a conflict between a readily available smaller reward (e.g., $8 now) and a more beneficial, yet delayed, reward (e.g., $16 in a week). Understanding intertemporal choices may help us in addressing complex societal challenges including substance abuse (Kirby et al., 1999), medication non-adherence (Elliott et al., 2008), and impulsive spending (HochLoewenstein, 1991). Real-life intertemporal choices are often executed via the kind of large-scale bodily movement that constitutes the focus of the current study (e.g., walking towards an expensive TV set, or exiting the shop to avoid spending money). In this study, we used the Bayesian statistics approach to provide evidence for or against two hypotheses.
First, we aimed to test whether the walking dynamics paradigm can reproduce the key effects found in the mouse-tracking studies of intertemporal choice. In mouse tracking, as the two options become more similar in their relative value, the response trajectories tend to be slower and more curved towards the non-chosen alternative (Calluso et al., 2015,Dshemuchadse et al., 2013,O’Hora et al., 2016,StillmanFerguson, 2019). The embodied models of choice predict that with increasing motor costs of reporting a decision, the response dynamics becomes more constrained (e.g. LeporaPezzulo, 2015). This can be manifested in a lower probability of a change-of-mind (Burk et al., 2014) and reduced variability of the trajectory curvature and response time. However, it’s not clear whether such reduced variability would diminish the effects of ongoing decision dynamics on the trajectory curvature and response times that are observed in mouse tracking.
Second, we aimed to analyze whether choice outcomes differ between the walking and mouse versions of the same intertemporal choice task. In particular, we hypothesized that in the walking task, the subjects discount the future rewards stronger than in the mouse-tracking task. Whereas the embodied choice models predict the existence of the effect of motor costs on choice, the rationale for the possible direction of this effect in intertemporal choice comes from the observations in a related mouse-tracking study. Specifically, (Scherbaum et al., 2012) found that imposing a sense of urgency on the subjects via introducing a response deadline leads to stronger delay discounting. They suggest a possible explanation: the subjects are initially attracted to the more impulsive, smaller-but-sooner option, and the response deadline leaves no time to consider overriding the initially formed preference and switching to the larger-but-later option. Importantly, this effect was linked to decreased probability of changing one’s mind after committing to an initial decision (Dshemuchadse et al., 2013,Scherbaum et al., 2012). We hypothesized that in the walking task, even without a strict response deadline, increased costs of a change-of-mind would have a similar effect of stronger discounting of future rewards.
Subjects with no major movement disorders and normal or corrected-to-normal vision were recruited from the students and staff of University of Aizu, and from the general population. The total number of subjects was N=74, including 17 female and 56 male subjects (male students are substantially overrepresented in the student population of University of Aizu); no sex information was reported for one subject. The subjects ranged in age between 18 and 65 years old (median age 26.5 years).
Student subjects received fixed monetary compensation for participating (approximately 10 US dollars). The experimental procedures and analysis plan were pre-registered on Open Science Framework (https://osf.io/c3xgn/). All subjects were informed of the purpose and procedure of the experiment, and gave written consent to participate. The anonymized data, stimulus presentation code, data analysis scripts, and supplementary information are available from a permanent public repository at https://osf.io/qn2w6/.
The subjects were asked to complete two tasks, a walking task and a mouse-tracking task. All subjects, except for one, performed both tasks on the same day with at least one-hour break between the tasks; the order of tasks was counterbalanced across subjects. In each task, the subjects were asked to answer a series of binary intertemporal choice questions. Each question involved a choice between a smaller amount of money now (smaller but sooner, SS) and a larger amount at a later time point (larger but later, LL), for instance, 8$ today and 16$ in 7 days. The subjects were instructed to decide as if the choices were real, but they did not actually receive any of the chosen amounts (previous studies have reported no differences between hypothetical and real intertemporal choices (e.g., Madden et al., 2003,JohnsonBickel, 2002)).
In each of the two tasks, the subjects completed 47 trials, which included 27 items of the Monetary Choice Questionnaire (MCQ; Kirby et al., 1999), and 20 staircase trials (O’Hora et al., 2016). The staircase trials comprised five independent staircase procedures for five delays: 7, 30, 183, 365, and 1095 days; each staircase procedure consisted of four choices. For each delay, the staircase procedure started with a choice between $8 now (SS) and $16 at that delay (LL).1 If the SS option was chosen, its reward decreased for the next trial of the staircase; if LL was chosen, the SS reward increased. At the same time, the LL option reward ($16 at a delay) remained unchanged in all staircase trials. The increments/decrements of the SS reward decreased after each block: after block 1 of each staircase, the SS rewards increased/decreased by $4, after block 2 by $2, and after block 3 by $1.
Previous studies have shown that simple sequential manipulation of presented intertemporal choice options can introduce systematic bias in discounting behavior (RoblesVargas, 2008,Scherbaum et al., 2016). To mitigate sequential effects, the staircase trials were randomly interleaved with the MCQ trials. Overall, the 47 trials were split into 4 blocks (according to the number of decisions in each staircase procedure). In block 1, five initial staircase trials ($8 now vs. $16 at different delays) were shuffled with seven random MCQ items. In each of blocks 2 and 3, the SS rewards of the staircase trials were adjusted according to the choices in the previous block, and the resulting trials were again mixed with another seven randomly chosen MCQ trials. In block 4, the last five staircase trials were shuffled with the six remaining MCQ trials.
In this task, the two options were presented on two spatially separated monitors (Figure 1). The mapping of the SS and LL options on the two monitors was randomly determined in the beginning of each experimental session, and remained consistent throughout all 47 trials of a given session for each subject. To report their choice, the subjects walked from the starting position towards the monitor with the preferred option, stopped in the response location in front of that monitor, and clicked a button on a remote controller (Logitech R400). Walking trajectories during each trial were recorded by a motion capture camera (Microsoft Kinect V1).
The subjects started each trial right in front of the camera. A dynamic starting procedure was implemented to ensure that subjects do not prepare the decision in advance and then walk directly to the chosen option only after the decision was made (ScherbaumKieslich, 2018). Specifically, after clicking the button on the remote controller to begin the trial, the subjects started walking away from the camera and towards the empty screens. The options were presented on the screens only once a subject left the area spanning approximately one meter in front of the camera. In this way, the subjects already had had walking momentum at the time the options were presented, which was supposed to increase the possibility of the preference formation process “leaking” into walking dynamics. The subjects were instructed to walk with constant speed after leaving the starting area. A trial ended once a subject stopped in the response area and confirmed their choice by clicking a button on the remote controller.
The setup of this version replicated the geometry of the walking task, and was otherwise similar to the setup used previously by (O’Hora et al., 2016). The subjects performed the task on the computer equipped with a high-precision mouse (Logitech G703), and reported their choice by moving the mouse cursor from the center bottom of the screen to one of the response areas in the top part of the screen and then clicking on the preferred option. Importantly, unlike the typical mouse-tracking setup, the cursor movement area was horizontally constrained to match (up to scale) the movement area in the walking task (the ratio of y to x dimensions of the area in both tasks was approximately 5:4). Similarly to the walking task, the dynamic starting procedure was used: the options were displayed only when the subject moved the mouse cursor from the starting position upwards. Mouse acceleration was switched off and the mouse cursor sensitivity was set to 800 dpi using Logitech Gaming Software v8.96.
For each task, individual subjects’ measures of discounting behavior were calculated using the data from the staircase trials (discounting behavior in the MCQ trials was not analyzed). First, we derived the individual subjects’ indifference points. For each of the five staircase delays, the indifference point is the ratio between the SS amount and the LL amount at which a subject would switch from SS to LL or vice versa at that delay. Then, we calculated k=1−AUC based on the approximated area under discounting curve (AUC) (Myerson et al., 2001,O’Hora et al., 2016):
| k = 1 − |
| f((ti+1 + ti)/2) × (ti+1 − ti), (1) |
where {ti, i=1,5} are the five staircase delays expressed as a fraction of the largest delay, 1095 days, and t0=1/1095 (today; f(t0)=1). We approximated individual discounting curves f(t) as piecewise-linear functions based on the estimated indifference points at all delays. Therefore, a subject always choosing the LL option is characterized by k≈0 (no discounting), and k≈1 represents the extreme discounting behavior in a subject who only chose the SS option.
In analyzing decision dynamics, we considered two independent variables characterizing each decision: the final choice (binary categorical variable, SS or LL), and λ, per-day added value provided by the LL option (continuous variable),
| λ = log |
| . (2) |
That is, λ quantifies how much more reward the LL option provides per day over the SS option. As λ increases, the benefit of LL over SS should become more evident; therefore, choosing LL becomes cognitively easier and choosing SS becomes cognitively more difficult.
The two dependent variables characterizing the decision dynamics are response time (RT) and maximum deviation (max-d). RT was measured from the onset of the stimuli to the moment when a subject confirms their choice. Response trajectory curvature was measured by max-d, maximum deviation of the trajectory from the idealized, straight-line path between the start- and end-points of the trajectory.
14 subjects with extreme discounting behavior in both tasks (k outside of the range [0.02, 0.98]) were excluded from the analysis. In the walking task, we excluded the trials with discontinuous walking dynamics where a subject moved slower than 0.2 m/s for more than 1s on their way to a response area. In both tasks, we excluded the trials with response times greater than 8s. In addition, trials with substantial data loss and otherwise irregular movement patterns were excluded based on visual inspection of recorded trajectories. Six subjects with more than 20% of trials discarded in either task were excluded from the analysis. After all exclusions, we analyzed the data of 54 subjects, which included 2490 mouse-tracking trials and 2451 walking trials (overall, 99% of the trials were retained after trial-level exclusions in the remaining subjects). The excluded data were not analyzed, but are publicly shared together with the rest of the data.
Our goal was to infer the plausibility of the two main hypotheses given the data. To do this, we adopted the Bayesian model selection approach (KruschkeLiddell, 2018,RouderMorey, 2012,Wagenmakers et al., 2016). For both hypotheses, the inference was based on hierarchical Bayesian linear models (Gelman et al., 2013,Kruschke, 2014,McElreath, 2016). Optional stopping based on Bayes factors was used to optimize data collection (Rouder, 2014,Schönbrodt et al., 2017,SchönbrodtWagenmakers, 2018). The brms package (version 2.9.0) for R (version 3.6.1) was used for model fitting and Bayes factor calculation (Bürkner, 2017,Bürkner, 2018).
If Hypothesis 1 was true, then, as λ increases (the delayed option becomes more beneficial with respect to the amount available now), the walking trajectories towards the LL option would become faster and more direct, and the trajectories to the SS option would become slower and more curved. To test this, we used Bayes factors to measure the evidence in favor of including the choice-by-λ interaction in the models explaining the variance in max-d and RT based on choice and λ. If the interaction model was preferred over the no-interaction models, we would confirm Hypothesis 1; if a no-interaction model was preferred, Hypothesis 1 would be rejected.
For each task, we have built two families of multilevel Bayesian linear models, one for RT and one for max-d, with each family consisting of three models
Using subject-level intercepts allowed for individual baseline values of walking time/trajectory curvature, whereas subject-level main effect of choice captured potential individual differences in how predisposed subjects are towards the SS and LL options. At the same time, we hypothesized population-level rather than subject-level choice-by-λ interaction in Mchoice × λ to mitigate convergence issues.
In addition to testing Hypothesis 1, we also performed the same analysis for the mouse-tracking data.
If our Hypothesis 2 was true, then the k-values measured in the walking task would be on average different than those obtained from the same subjects in the mouse-tracking task. Similar to Hypothesis 1, we used Bayes factors to estimate the relative plausibility of the candidate models explaining the variance of k-values
If Mtask was preferred over the other candidate models, we would confirm Hypothesis 2; if Msession or Mnull was preferred, Hypothesis 2 would be rejected. Furthermore, we predicted not only the presence but also the direction of the task effect: we hypothesized that if the effect is present, walking task should reveal larger k-values than the mouse-tracking task.
Our pilot experiments provided preliminary evidence that both RT and max-d are normally distributed in the walking task. The k-values measured previously in the similar paradigm can be approximated by the truncated normal distribution (O’Hora et al., 2016). For this reason, the brms parameter family was initially set to gaussian for all models. The prior distributions of centralized intercepts were normal with the parameters defined by the mean and variance of the corresponding dependent variables. Cauchy distribution with the scale parameter of √2/2 was used for the standardized regression slopes (RouderMorey, 2012). The default priors provided by the brms package were used for all other regression parameters.
For pairwise comparison of the models, we used Bayes factors (BF), which quantify the relative support provided by the data to each of the models being compared. BFij measures how much more likely the observed data are under Mi than under Mj. We interpreted Bayes factors according to Jeffreys (Jeffreys, 1961): BFij exceeding 3, 10, or 30 corresponds to “moderate”, “strong” or “very strong” evidence in favor of Mi over Mj, respectively. The model most supported by the data was chosen based on the highest BF with respect to the corresponding null model.
As Bayes factors can fluctuate slightly depending on concrete realization of samples from posterior distributions of the model, each BF was calculated as an average over ten independent runs of the bayes_factor function in brms. Bayes factors can also be sensitive to the choice of priors, so in the supplementary information we report the target Bayes factors obtained under more and less informative priors on the regression slopes (the scale parameter of the Cauchy priors on slopes set to 1/2 and 1 respectively). To establish a link to the traditionally used statistics, in the supplementary information we also report the fits of frequentist linear mixed-effects models corresponding to the most supported Bayesian models using the lme4 package (version 1.1-21) for R (Bates et al., 2015).
To ensure efficient data collection, we employed the optional stopping procedure using sequential Bayes factor analysis (Rouder, 2014,Schönbrodt et al., 2017,SchönbrodtWagenmakers, 2018). We first collected the data from 30 subjects3, and then calculated the Bayes factors for the first time. We then aimed to collect the data in the batches of five subjects until 1) the feasibility limit of 75 subjects is reached (see the Stage 1 report at https://osf.io/c3xgn/ for justification of this limit), or 2) for all analyses, the Bayes factor in favor of the model most supported by the data over the second-best model exceeds 10. However, we decided to terminate data collection at 54 subjects (74 prior to applying exclusion criteria) even though the preregistered Bayes factor for the most supported model when testing Hypothesis 2 has not reached 10; the following subsection justifies this decision.
The pre-registered protocol specified a different response procedure in the walking task. Specifically, instead of clicking the button on the remote controller, the subjects were supposed to physically touch the top of the monitor displaying the chosen option (at which point the experimenter had to press a button on the keyboard to record the subject’s response). We opted for using the remote controller as it allowed us to fully automate the flow of the experiment, while still allowing the subjects to change their mind before finalizing the response.
The preregistered exclusion criteria were adopted to take into account increased variability of the data in the actual experiment compared to the pilot data. Trials with response times greater than 8 seconds were excluded in both tasks, while the preregistered cutoff values were 7 seconds for the walking task and 5 seconds in the mouse task. Response times less than 2 seconds in the walking task and 1 second in the mouse task were not observed so the corresponding preregistered cutoffs were not applied. The criterion for excluding walking trajectories where a subject stopped in the middle of the trial was relaxed: instead of discarding trials where a subject slowed down to less than 0.2 m/s (resulting in 23% trajectories excluded), we only excluded the trials in which a subject walked slower than 0.2 m/s for longer than one second before they reached a response area.
In sequential Bayesian testing of Hypothesis 1, we quickly reached the threshold BF=10 for both RT and max-d analyses of the walking data. As for Hypothesis 2, around N=50 we reached conclusive evidence in favor of null and against Mtask, suggesting that our Hypothesis 2 should be rejected. However, the collected evidence remained inconclusive with respect to Msession even after collecting more data. We decided to terminate data collection at this point, because providing evidence for or against Msession was not the primary goal of this registered report (see Exploratory results for exploratory analysis of the session effect).
We found that the walking speed and curvature of walking trajectories reflect the underlying decision dynamics. For both maximum deviation and response time, Bayes factors indicated very strong support of the models including the choice × λ interaction over the choice-only models (Table 1). The posterior distributions of the model coefficients bλ demonstrate that max-d and RT increase with λ for SS choices, and decrease with λ for LL choices (Figure 2). Together, these results confirm Hypothesis 1: relative values of the available options do affect walking trajectories during decision making.
Table 1: Results of testing Hypothesis 1: Bayes factors in favor of Mchoice × λ over Mchoice
max-d RT 2*walking All data 1.4 × 10¹¹ 7.2 × 10¹⁰ CoM excluded 3.9 × 10¹⁰ 3.8 × 10⁹ 2*mouse-tracking All data 5.6 × 10³ 1.2 × 1025 CoM excluded 1.5 × 10⁻² 8.0 × 10²¹
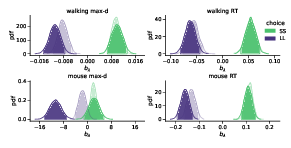
Figure 2: Posterior distributions of the slope parameters bλ of the Bayesian hierarchical models Mchoice × λ. In smaller-but-sooner (SS) walking choices, maximum deviation and response time increased with relative advantage λ of the delayed option (bλSS>0). For larger-but-later (LL) walking choices, both max-d and RT decreased with λ (bλLL<0). Shaded areas indicate 95% credible intervals of the parameters. Semi-transparent distributions represent the models fitted to a subset of data without changes-of-mind (91% of the mouse-tracking trials, 99% of the walking trials).
The analogous analysis of the mouse cursor movements revealed weaker support for the effect of decision options on the curvature of mouse trajectories (Table 1). However, compared to the walking data, the mouse-tracking data provided much stronger support for the effect of decision options on response time.
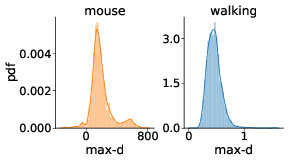
We have tested whether the observed effects of λ on max-d or RT are driven by a small proportion of trials with changes-of-mind (FischerHartmann, 2014), although Hartigans’ dip test did not provide evidence against unimodality of the max-d distributions (walking task: D = 0.006, p=0.84, mouse-tracking task: D = 0.005, p=0.97, Figure 3). Excluding trials with changes-of-mind4 (CoM) did not substantially affect the results of the walking task analysis and the analysis of RT in the mouse-tracking task. At the same time, the subset of data without CoM provided very strong evidence against the choice × λ interaction effect on max-d in the mouse-tracking task (Table 1, Figure 2). This suggests that curvature of the mouse cursor trajectories was not sensitive to the relative values of the options, and the overall effect of λ on max-d is due to the increased frequency of changes-of-mind in the high-conflict trials.
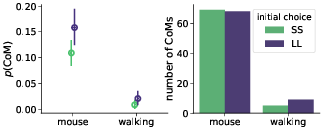
Hypothesis 2 was based on two basic premises: first, that in the walking task the subjects will change their mind less often than in the mouse-tracking task, and, second, that most of these changes-of-mind will be from the more impulsive SS option to the more beneficial in the long term LL option.
Confirming the first basic premise, we found that changes-of-mind (CoM) appeared more often in the mouse-tracking task (9% mouse-tracking trials vs. 1% of walking trials). However, contrary to the second key initial assumption, changes-of-mind were almost evenly distributed between SS-to-LL and LL-to-SS (Figure 4). This rendered the potential mechanism behind hypothesized stronger discounting in the walking task unlikely.
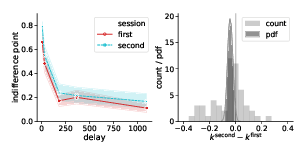
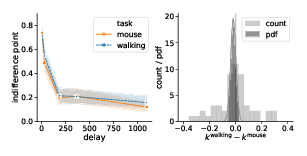
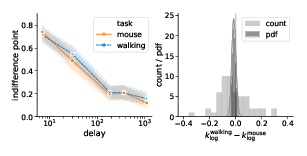
Figure 5: Task (walking vs. mouse-tracking) and experimental session (first vs. second) did not affect subjects’ discounting behavior (as quantified by the preregistered measure k). Left panels represent piecewise-linear approximations of the discounting curves, shaded areas indicate 95% confidence intervals. Right panels represent the histograms of difference in corresponding k-values across subjects (count) and posterior probability distribution functions (pdf) of the task and session effect sizes.
Indeed, Bayes factor analysis provided very strong evidence against the task effect on k-values (BF=11.2 in favor of Mnull over Mtask). The data did not provide conclusive evidence for or against the session effect (BF=1.9 in favor of Mnull over Msession). Taken together, these findings suggest that on average k-values did not change between the walking and mouse-tracking versions of the task (Figure 5).
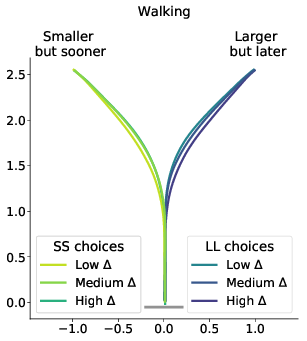
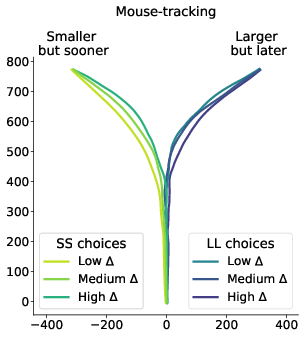
Figure 6: Average response trajectories depend on the relative value of the LL option (Δ) in walking and mouse-tracking tasks. Tertiles of Δ (SS trials: -0.5 and -0.16, LL trials: 0.03 and 0.22) divided the SS and LL data into three thirds each (low/medium/high Δ). In the upper panel, the unit of measurement is meter, and the gray bar in the bottom indicates the average shoulder width in a representative subgroup of participants (40 cm). In the lower panel, the unit of measurement is pixel.
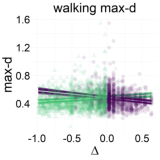
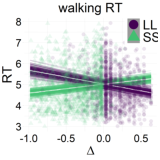
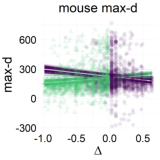
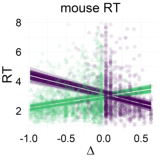
Figure 7: Relationship between the relative value of the LL option (Δ) and response dynamics measures (max-d and RT). Each data point represents an individual trial, and the lines represent independent samples from the posterior distributions of the choice-by-Δ interaction in fitted Bayesian regressions Mchoice × Δ.
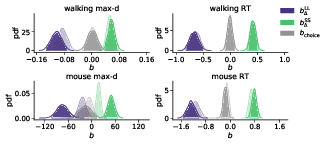
Figure 8: Posterior distributions of the slope coefficients of the Bayesian hierarchical models Mchoice × Δ. The exploratory analysis taking into account subjects’ individual preferences corroborated the preregistered analysis (Figure 2). Positive/negative values of bΔ indicate that the corresponding variable (max-d or RT) increases/decreases with the subjective relative value of the larger-but-later option. Semi-transparent distributions represent the models fitted to a subset of data without changes-of-mind (91% of the mouse-tracking trials, 99% of the walking trials).
Depending on whether or not the trials with changes-of-mind are excluded, the preregistered analysis reveals conflicting evidence regarding the effect of λ on max-d in the mouse-tracking task. This prompted us to check the robustness of our findings using an alternative measure of relative values of the two options. (Dshemuchadse et al., 2013) have previously suggested measuring decision difficulty using absolute distance to indifference point; here we use the signed version of this distance, denoted by Δ, as an alternative measure of the relative value of the LL option. For each decision,
| Δ = f(delayLL) − amountSS/amountLL, (3) |
where f(t) is the subject’s approximated indifference point at a delay t (expressed as a proportion of amountLL). Thus, Δ quantifies the subjective attractiveness of the LL option in a given decision, taking into account individual preferences of the subjects. Negative values of Δ correspond to decisions which, according to a subject’s discounting curve, should result in the SS choice. As Δ increases above zero, the advantage of LL over SS should become more evident; therefore, choosing LL should become cognitively easier and choosing SS should become cognitively more difficult.
Table 2: Results of testing Hypothesis 1 using Δ instead of λ to measure relative values of the options: Bayes factors in favor of Mchoice × Δ over Mchoice
max-d RT 2*walking All data 9.5 × 10¹⁴ 7.2 × 10²³ CoM excluded 1.4 × 10¹⁴ 4.1 × 10²² 2*mouse-tracking All data 6.7 × 10⁸ 1.2 × 1037 CoM excluded 8.3 1.9 × 1030
The results of our analyses using Δ instead of λ further reinforce Hypothesis 1. In the walking task, as the relative value of the LL option increases, the trajectories towards the SS option become slower and more deflected, and trajectories towards the LL option become faster and more direct (Figure 6, 7). This was also the case in the mouse-tracking task; when the changes-of-mind were excluded, Mchoice × Δ for max-d was still supported by the data, although to a much lesser extent (Table 2, Figure 8).
To further highlight the relationship between the relative values of the options and observed decision dynamics, we reconstructed decision landscapes from the walking trajectories. Decision landscape is an analogue of an energy potential field mathematically derived from the response trajectories; its visualization incorporates both temporal and spatial characteristics of the underlying decisions (Zgonnikov et al., 2017). Conceptualizing the response locations as attractors in the space of all possible positions of a decision-maker, decision landscapes characterize the strength of these attractors as expressed in the decision-makers’ movement. As expected, with increasing Δ, the attractor corresponding to the SS option becomes weaker, and the LL attractor becomes stronger (Figure 9). This corroborates the results of the statistical analysis.
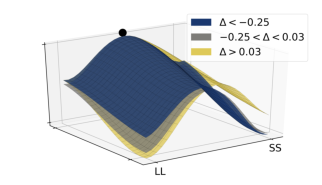
Figure 9: Decision landscapes (Zgonnikov et al., 2017) reconstructed from the walking trajectories: with increasing relative value of the LL option (Δ) the LL option becomes more attractive, and the SS option becomes less attractive. Unlike Figure 6, tertiles of Δ (first tertile: -0.25, second tertile: 0.03) were calculated across both SS and LL decisions.
Contrary to the preregistered assumption that k-values are normally distributed, the observed distribution of k-values was skewed towards 1, indicating that many subjects were largely insensitive to delayed rewards. We explored two possible ways of accounting for this skewness in our statistical analysis: changing the model parameters, and modifying the definition of k-value to emphasize changes in discounting behavior at small delays.
First, we changed the preregistered value of the brms parameter family to weibull, because the observed distribution of k was well-approximated by the Weibull distribution. This produced inconclusive Bayes factors, which did not allow us to further clarify the effects of task and session on discounting behavior (Table 3).
Second, we analyzed a modified version of the k measure, which uses logarithmically scaled delays when calculating the area under discounting curve (Figure 10)
| klog = 1 − |
| f((ti+1 + ti)/2) × (log(ti+1) − log(ti)), (4) |
where ti and f(t) are defined in the same way as in Eq. (1). Compared to the preregistered k, klog emphasizes changes in the decisions at short delays. Its analysis provides further grounds to rejecting Hypothesis 2, indicating strong evidence against the task effect on discounting behavior (Table 3). At the same time, we found very strong evidence of the session effect on klog: the subjects discounted future rewards less in the task they performed second (Table 3, bsession 95% credibility interval [−0.093, −0.037]).
Table 3: Results of testing Hypothesis 2: Bayes factors of the task-only and session-only models over the null model produced by the preregistered analysis (k ∼ Gaussian) and two exploratory analyses
dependent variable Mtask Msession k ∼ Gaussian 1/11.2 1/1.9 k ∼ Weibull 1/3.0 1.4 klog ∼ Gaussian 1/12.5 532.6
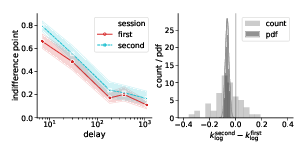
Figure 10: Session but not task affected the discounting behavior (as quantified by klog defined in Eq. (4)): the subjects discounted future rewards less in the second experimental session. Left panels represent piecewise-linear approximations of the discounting curves, shaded areas indicate 95% confidence intervals. Right panels represent the histograms of difference in corresponding klog-values across subjects (count) and posterior probability distribution functions (pdf) of the task and session effect sizes.
Overall, in our exploratory analysis we adjusted the statistical tests and the discounting measure to account for the strong discounting behavior in the recruited sample. This provided further evidence against the effect of task on final choice, but suggested preliminary evidence in favor of weaker discounting in the second experimental session.
This registered report confirms that walking trajectories reflect covert dynamics of decision making, and rejects the hypothesis that increased motor costs of responding bias decisions in an intertemporal choice task.
In this study we hypothesized that the relative values of the available options affect the duration and curvature of the walking trajectories of a decision-maker. Testing this hypothesis contributes to defining the directions for future developments of dynamic models of decision making and adds to the process-tracing methodology. If we had found that walking trajectories do not change with the relative values of the options, this would have provided experimental evidence that increased movement costs substantially constrain response dynamics. Therefore, explicit assumptions about the mapping between the internal cognitive state and actual motor response would need to be incorporated in future dynamic decision-making models.
However, our data strongly supports the effect of ongoing decision dynamics on walking trajectories: as the subjective value of the larger-but-later option increases, the trajectories towards that option become faster and more direct, and the trajectories towards the smaller-but-sooner option become slower and swerve more towards the non-chosen option (Figures 6, 7). This confirms the robustness of the findings from the previous mouse- and hand-tracking literature, and reinforces the evidence for the recent dynamical accounts of decision making linking cognitive processing to response trajectories (Calluso et al., 2015,ChristopoulosSchrater, 2015,Christopoulos et al., 2015,Quinton et al., 2014,Scherbaum et al., 2012). Furthermore, very strong evidence in favor of Hypothesis 1 (which is robust to excluding trajectories with changes-of-mind) confirms the validity of tracking walking trajectories as a new paradigm allowing for reverse inference of cognitive processes which are executed via complex bodily movements.
A growing number of studies employ mouse-tracking to trace ongoing dynamics of cognitive processes (Freeman, 2018,Schulte-Mecklenbeck et al., 2017). At the same time, mouse tracking is subject to certain limitations, e.g., lack of continuous link between the current state of a cognitive process and the hand or mouse cursor position due to intermittent nature of reaching movements (Friedman et al., 2013,van der Wel et al., 2009), and a large number of researchers’ degrees of freedom in setting up a mouse-tracking experiment (Hartmann et al., 2012,ScherbaumKieslich, 2018,Schoemann et al., in press). Tracking walking trajectories, although being more demanding in terms of set-up costs, provides an alternative method to track decisions based on movements, which can operate in more ecologically valid paradigms.
Previous studies have demonstrated that decision makers can be biased towards a less motor costly decision in action selection and perceptual choice (Cos et al., 2011,Hagura et al., 2017,Marcos et al., 2015,Morel et al., 2017), which prompts that metabolic costs of the actions and the associated rewards interact during decision making (Shadmehr et al., 2016,Wispinski et al., in press). At the same time, up to now it remained unclear whether symmetrically increased costs of reporting a decision can affect choice. Clarifying this could provide evidence either for or against the embodied choice theories (CisekPastor-Bernier, 2014,LeporaPezzulo, 2015). In the context of our paradigm, the embodied choice model assumes that the spatial position of a decision-maker directly affects the accumulation of evidence via the commitment effect: once a movement toward a target is initiated, the evidence in favor of changing one’s mind must outweigh the motor costs of doing so (LeporaPezzulo, 2015).
Previous work on intertemporal choice have suggested that the smaller-but-sooner option is activated early on during a decision, and is later suppressed by the larger-but-later option if there is enough time (Dshemuchadse et al., 2013,Scherbaum et al., 2012). Consequently, we assumed that the smaller-but-sooner option would be chosen more often in the walking task compared to the mouse-tracking task, due to a reduced number of changes-of-mind to the larger-but-later option caused by an increase in motor costs of movement (Burk et al., 2014,MoherSong, 2014).
The confirmatory analyses demonstrated that although the number of changes-of-mind was substantially reduced in the walking task, the discounting behavior did not vary between the walking and mouse-tracking task (Figure 5). The exploratory analyses further disproved Hypothesis 2 (Figure 10, Table 3). One potential explanation for the observed lack of effect of motor costs on behavior is that the feedback link from the motor system to the decision-making processes is weak, which would suggest that symmetrically increased motor costs are unlikely to bias choice in principle. This might provide grounds for the decision-making models to treat motor constraints of the tasks as having little effect on cognitive processing. On the other hand, our results indicate another potential explanation: the lack of asymmetry in the distribution of changes-of-mind between SS and LL choices in the mouse-tracking task.
We hypothesized that in the mouse-tracking task the subjects would mostly change their mind from SS to LL, and not the other way around, but the data revealed that changes-of-mind were almost evenly distributed between the SS and LL choices (Figure 4). For this reason, even the observed substantial reduction in the number of changes-of-mind in the walking task (Figure 4) did not induce changes in the discounting behavior. Furthermore, analysis of the response trajectories revealed that SS and LL choices did not differ in terms of response time and trajectory curvature when distance to subjective indifference point (Δ) was controlled for (Figure 8). This is in contrast with the findings of (Dshemuchadse et al., 2013), who identified a bias towards the SS option in mouse cursor trajectories. To further complicate the issue, (Calluso et al., 2015) and (O’Hora et al., 2016) found a bias in the opposite direction, towards the LL option.
Collectively, these considerations suggest that the hypothetical effect of motor costs on choice outcomes can manifest itself only if the asymmetry in changes-of-mind between the two options is more pronounced than in the current paradigm. Particularly, this can occur in the paradigms including decisions with a high degree of competition between the options, one of which is still chosen substantially more often than the other, which might be the case, for example, in decisions between two aversive stimuli in approach-avoidance studies (e.g. Garcia-Guerrero et al., 2019). Designing such paradigms is a promising avenue for future investigations of embodied choice.
One confounding factor that might have affected the subjects’ behavior is that the two studied tasks differ not only in motor costs but also in the time required to report a choice and inter-trial interval. The average response time in the mouse-tracking task was 2.8 seconds, while walking took on average 4.8 seconds. Still, despite having more time to decide during walking, the subjects often informally reported that the walking task was more challenging. The possible reasons for this are increased cognitive-motor interference in walking (Al-Yahya et al., 2011) and that the subjects might have felt the need to finalize a decision early on to avoid a costly change-of-mind later. In addition, (Scherbaum et al., 2016) have previously demonstrated an early tendency to repeat a motor movement from a previous trial, which decreased with inter-trial interval. In our study, the inter-trial interval during the walking task was much longer than in the mouse-tracking task, which could also have affected the subjects’ behavior. Designing the tasks with similar response times and inter-trial intervals but different motor costs (for example, employing robotic manipulanda with variable resistance or response angle (Burk et al., 2014,Hagura et al., 2017)) can potentially address these limitations.
Up to now, most mouse-tracking studies have focused on averaged decision trajectories, implicitly assuming homogeneity of underlying responses. However, changes-of-mind can form a separate cluster of response trajectories (van der Wel et al., 2009,Wulff et al., 2019), which is especially important in light of recent studies that link changes-of-mind to the neural mechanisms distinct from those generating the initial decisions (Fleming, 2016,Atiya et al., 2019a,Atiya et al., 2019b). Here we wish to call for investigating mouse- and hand-tracking data in more detail, paying close attention to changes-of-mind. We believe that doing so can provide important insights into potential changes in behavior under varying motor constraints.
We demonstrated a close relationship between decision making and full-body movements. In addition to theoretical significance for the field of judgment and decision making, this relationship has wider methodological implications and potential practical applications. Particularly, experimental studies in the field of neuroeconomics and consumer behavior employ increasingly more ecologically valid paradigms (Hui et al., 2009,Rangel et al., 2008,Sanfey et al., 2006,Sharp et al., 2012); the current study suggests that fine-grained recording of full-body movements in the laboratory can allow to track the time course of the underlying cognitive processes. Furthermore, the current work provides basis for principally new field studies tracking decision-makers’ behavior in the real world: recent progress in computer vision (e.g., ToshevSzegedy, 2014,Cao et al., 2017,Mehta et al., 2017) enables the researchers to reconstruct walking trajectories during decision making from video stream data, eliminating the need for dedicated motion capture hardware. These trajectories can then be used for reverse inference of the walkers’ cognitive processes across domains. In particular, this has potential implications for forensics: mouse-tracking studies have demonstrated that deceptive behavior results in more conflicted mouse cursor trajectories (Duran et al., 2010,Monaro et al., 2017,O’Hora et al., 2018). Further research should investigate whether walking trajectories can also reveal deceptive behavior. Finally, the present work can provide theoretical support for intelligent activity recognition based on video data, for instance, in automated surveillance (DeeVelastin, 2008).
In this study we confirmed the hypothesis that walking trajectories reflect ongoing cognitive processes. This opens up a range of theoretical questions, and has implications for applied research. Second, we disproved the hypothesis that symmetrically increased motor costs of responding bias decision-makers towards a readily available option in intertemporal choice. The latter result suggests that in our paradigm the decision-making mechanisms were insensitive to the influences of task constraints, producing consistent decision outcomes regardless of the motor costs of reporting a decision. Overall, our findings establish the empirical basis for future investigations of the reciprocal effects of full-body movement and decision making.
Copyright: © 2019. The authors license this article under the terms of the Creative Commons Attribution 3.0 License.
This document was translated from LATEX by HEVEA.