Judgment and Decision Making, Vol. 14, No. 1, January 2019, pp. 58-71
Anti-social motives explain increased risk aversion for others in decisions from experience
Sebastian Olschewski*
Marius Dietsch#
Elliot A. Ludvig$
|
When deciding for others based on explicitly described odds and
outcomes, people often have different risk preferences for others than
for themselves. In two pre-registered experiments, we examine risk
preference for others where people learn about the odds and outcomes by
experiencing them through sampling. In both experiments, on average,
people were more risk averse for others than for themselves, but only
when the risky option had a higher expected value. Furthermore, based
on a separate set of choices, we classified people as pro- or
anti-social. Only those people classified as anti-social were more risk
averse for others, whereas those classified as prosocial chose
similarly for themselves and others. When the uncertainty was removed,
however, all participants exhibited less anti-social behavior.
Together, these results suggest that anti-social motives contribute to
the observed limited risk taking for others and that outcome
uncertainty facilitates the expression of these motives.
Keywords: decisions from experience, uncertainty, decision making for others, social interaction, anti-social behavior
1 Introduction
Many risky decisions that people make affect other people, which can
effectively spread, share, or even offload the risk. Some situations
are more obviously social, such as when a financial advisor invests a
portfolio for a client, but others are less so, such as when people
make career decisions that affect themselves, their families, and their
friends. Though most studies of risky choice are devoid of an explicit
social context (e.g., Gneezy & Potters, 1997; Holt & Laury, 2002),
several studies have examined risk taking for others. Findings in this
literature are mixed: Some studies have found that people tend to be
more risk averse for others than themselves (e.g., Bolton & Ockenfels,
2010; Reynold, Joseph & Sherwood, 2009), a result often attributed to
a sense of responsibility (Charness & Jackson, 2009). In contrast,
other studies have found that people tend to be more risk seeking for
others than themselves (e.g., Chakravarty, Harrison, Haruvy &
Rutström 2011; Pollmann, Potters & Trautmann, 2014; Stone &
Allgaier, 2008), a result sometimes attributed to a social norm of risk
taking that is heeded more in choices for others than for oneself.
Irrespective of the direction of change in risk taking, the differences
in choices for self and others are usually attributed to prosocial
attitudes, assuming that people choose what they think would be best
for the other person. This supposed ubiquitous prosociality conforms
with the hyperaltruism observed when people are faced with causing harm
to others (Crockett et al., 2014; Perera et al., 2016), but conflicts
with findings that people also have a competitive streak, such as when
people are happier when their income exceeds that of those around them
(e.g., Clark & Oswald, 1996) or even an anti-social streak, such as
when they do not contribute to a public good even though it is in their
self-interest to do so (Brandts, Saijo & Schram, 2004; Saijo, 2008).
This occasional anti-social behavior in social comparison suggests that
differences in risk taking for self and other could also be due to
anti-social motives. For example, people might choose the better of two
lotteries (in terms of their expected utility) for themselves and the
worse for another person. This pattern could then lead to more or less
risk taking for others, depending on the exact characteristics of those
lotteries. Here, in two pre-registered experiments, we examine how
decision making for others differs in an experience-based learning
environment and test whether pro- or anti-social motives are connected
to any observed differences.
People have strong social preferences about how to equitably distribute
outcomes to others (Fehr & Schmidt, 1999), which might also affect
their risk taking for others. These social preferences, however, have
mostly been tested under certainty. For example, in the dictator game,
where participants decide how to distribute money between themselves
and a second person, non-zero outcomes for others are typically
selected (Engel, 2011; Kahneman, Knetsch & Thaler, 1986). To
disentangle the different potential motives in these social games, a
collection of dictator games with a fixed choice set has been developed
into the social-value-orientation (SVO) scale (e.g., Liebrand, 1984;
Murphy, Ackerman & Handgraaf, 2011). Based on the choices made, this
scale provides both a quantitative estimate of prosociality (the SVO
angle, described later) as well as a discrete classification of people
into competitive, selfish, prosocial, or altruistic groups based on
this quantitative score. According to this measure, around 12% of
people express competitive behavior, which can be considered as
anti-social, whereas 46% behave in accordance with prosocial motives
(Au & Kwong, 2004). These behavioral results have led to models of
social preference which assume that people value equity in outcomes
(e.g., Bolton & Ockenfels, 2000; Fehr & Schmidt, 1999; but see
Charness & Rabin, 2002).
Whereas laboratory studies often find prosocial tendencies and inequity
aversion, field studies find that happiness increases with an increase
in relative income rank compared to others in one’s respective peer
group (e.g., Brown, Gardner, Oswald & Qian, 2008; Clark & Oswald,
1996; Tideman, Frijters & Shields, 2008). One potential
interpretation of this finding is that people gain utility from having
more than someone else, which resembles competitive behavior in the SVO
classification. Consequently, there might be an inherent tension
between people’s pro- and anti-social tendencies, and the expression of
these tendencies might at least depend partly on the environment. One
apparent difference between the laboratory experiments and real-world
surveys is the degree of ambiguity in the link between choice and
outcome: Ambiguity is typically absent in the former setting, but
present in the latter. Simply introducing risk with pre-defined
probabilities of rewards into the dictator game affects social
preferences: People do still share chance outcomes with others, but to
a lesser extent (Brock, Lange & Ozbay, 2013; Krawczyk & Le Lec,
2010). Moreover, across individuals, there is no correlation between
social preferences under certainty and risk (Bolton, Ockenfels &
Stauf, 2015; Bradler, 2009). Given this anti-social streak, especially
under uncertainty, it is potentially problematic that predominantly
prosocial tendencies have been invoked to explain differences in risky
decisions for self and others.
Almost all previous studies examining risky choice for others have used
decisions from description, where the odds and outcomes are explicitly
presented (e.g., Bolton & Ockenfels, 2010; Charness & Jackson, 2009;
Raynold, Joseph & Sherwood, 2009). In contrast, in real life, the odds and outcomes
are often not known when people make decisions for themselves or for
other people. In this study, we developed a decisions-from-experience
(DfE) design where people have no prior knowledge of the odds or
outcomes, but can only learn them by sampling from the different
options. This procedure makes the odds and outcomes more ambiguous
compared to decisions with explicitly described risks and thus might
affect the expression of social preferences. In decision making without
a social context, the same odds and outcomes can lead to different
behavior when presented either in a described or experience-based
format (Hertwig, Weber, Barron & Erev, 2004). For example, rare
events are weighted differently in experience compared to description
(Wulff, Mergenthaler-Canseco & Hertwig, 2018; Glöckner,
Hilbig, Henninger & Fiedler, 2016; Kellen, Pachur & Hertwig, 2016)
and extreme outcomes gain more importance in experience (Ludvig &
Spetch, 2011; Ludvig, Madan & Spetch, 2014, Madan, Ludvig & Spetch,
2017). Given these dissimilarities in individual risky choice, how
social preferences under certainty and risk will generalize to an
experience-based protocol is not clear.
In this paper, we present two experiments that examine how social
preferences interact with outcome uncertainty, using a DfE design. The
first experiment focuses on the following pre-registered question: How
do risk preferences change in choices for others compared to oneself?
Post-hoc, we classified people according to their social preferences
and examined which motives correspond with risk taking for others.
Furthermore, we compared social preferences in the DfE task with those
under certainty. Then, in a second pre-registered experiment, using
different rewarding outcomes, we replicate the core results and confirm
the post-hoc findings from the first experiment.
2 Experiment 1
2.1 Method
2.1.1 Participants
Sixty-two participants were recruited in 4 sessions of 10–20 participants
from the University of Warwick paid participant pool via the Sona system —
an online system for managing experimental participants
(https://www.sona-systems.com/). The Warwick participant pool is run
jointly by Psychology, Economics, and the Business School, and consists of
both students (mostly) and staff from all disciplines as well as former
students and members of the local community. The number of participants was
determined prior to the experiment through a power analysis with 80% power
to find a medium effect size (d = 0.5) at the 5% significance
level with a two-sided, two-sample t test. Four participants were
excluded, who could either not be matched to another participant in an
individual session or failed at the catch trials, leaving 58 participants
(Mage = 21.4, SDage =
3.1; 42 female, 16 male). We did not collect other demographic details from
the participants. Participants were paid a show-up fee of £4 plus a
variable bonus depending on their own choices or the choices of a matched
partner (ranging from £0.50 to £8.00, M =
£4.82). All procedural details,
including hypotheses, recruited participant numbers, exclusion criteria,
and planned analyses were preregistered at the Open Science Framework:
https://osf.io/2bts4. Code for experiments and analysis as well as
the raw data are available at the same link.
2.1.2 Procedure and Materials
Upon arrival to the laboratory, participants received an information
sheet and then provided written informed consent to participate in the
experiment. The experiment was performed at a computer and consisted of
six blocks of trials. There were 3 sampling and 3
choice blocks, with each sampling block followed by a choice
block. The experiment was programmed with PsychoPy 1.84 (Peirce, 2007).
Instructions were provided on the computer screen and could be read at
the participant’s own pace; questions could also be asked of the
experimenter. The instructions described the task and framed it as a
group decision-making experiment in which participants could choose
between monetary lotteries for themselves and for another randomly
selected participant in the room. The instructions stressed that the
choices for oneself and the other person were separate from each other.
In the sampling blocks, participants distributed 40 samples among 8 decks
of cards in whatever order or quantity they wished. Each deck had a unique
symbol that was the same for a given distribution throughout the experiment
(see Figure 1). The connections between the symbols and the underlying
distributions were randomized for each participant. All distributions were
continuous and uniform. There were 2 low-value decks (mean = £2.5), 4
medium-value decks (mean = £4.5), and 2 high-value decks (mean =
£6.5). Draws from the decks were randomly distributed around these
means. Half the decks for each mean value had a small range (i.e., lower
variance, range of ±0.5), and the other half had a medium range (i.e.,
medium variance, range of ±2); decks with an even larger range of ±3.5
were used only in Study 2. In the choice blocks (see below), all the
high-value and low-value decks appeared in the choices for both self and
other. The 4 medium decks, however, were split such that 2 decks (one small
and one medium range) appeared only in self choices, and the other 2 decks
only appeared in choices for the other. This split aimed to examine whether
people sample differently once they find out that some decks are relevant
only in choices for themselves and some only in choices for other
participants (see the
Supplement for an
analysis of sampling behavior, which did not provide evidence for this
conjecture). Participants could learn about the range of possible outcomes
only from experience and were told neither the means nor the ranges of the
different decks.
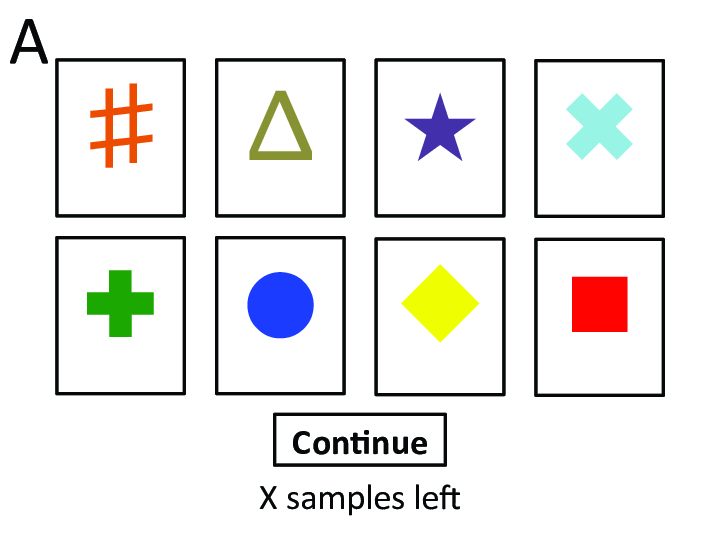
| Figure 1: Screenshot from (A) the sampling block and (B) the choice
block. Each square represents a deck of cards, and the symbols
indicated the underlying distribution for a draw from that deck. The
distributions could only be learned by sampling from each of the decks. |
Figure 1A shows a schematic of how, during the sampling blocks, the
screen displayed all 8 decks as well as a decreasing count of the
number of samples remaining. The 8 decks always appeared in the same
locations during sampling, providing an additional memory cue for the
symbol. Participants sampled from a given deck by left-clicking on it
with the mouse. The symbol for the selected deck then disappeared and,
at its former position, a random draw from the corresponding
distribution (see above) rounded to two digits (e.g., £2.36) appeared
for 0.5 s. After that, the symbol for the given deck reappeared. While
the outcome was displayed, no sampling was possible. Once participants
had no samples left, they clicked on continue, and a choice block
followed.
In the choice blocks, participants made 21 pairs of binary
choices between the decks. On each of the 21 trials, participants made
two choices: They chose between two of the decks for themselves and
between two (possibly different) decks for a second participant. Figure
1B shows how the screen was divided down the middle by a line, with two
decks of cards vertically positioned on each side (for a total of 4
decks). One side, indicated by the word “self”, displayed the two decks
to choose between for oneself, and the other side, indicated by the
word “other”, displayed the two decks to choose between for the other
participant. The self/other location was counterbalanced across
participants, but constant across trials for each participant.
Participants made choices by clicking on their preferred deck with the
mouse. After a mouse-click on a deck, the deck’s borders switched to
green, indicating the deck had been clicked. Once a selection had been
made both for self and other, the participant confirmed these choices
by clicking on a continue button or by pressing “enter” on the
keyboard. Selections could be changed until they were confirmed. No
additional feedback was provided during the choice blocks, so
participants had to rely on what they had learned during the sampling
blocks to guide their choices.
| Table 1: Choice situations in Experiment 1. % Self-B is the percentage of trials where option B was chosen for
oneself. % Oth.-B is the percentage of trials where option B was chosen for the
other person. |
| | Self-A | Self-B | Other-A | Other-B | % Self-B | % Oth.-B |
| Risk Attitude | |
| 1 | 4.5L | 4.5M | 4.5L | 4.5M | 51 | 50 |
| 2 | 2.5L | 2.5M | 2.5L | 2.5M | 47 | 52 |
| 3 | 6.5L | 6.5M | 6.5L | 6.5M | 52 | 52 |
| 4 | 2.5L | 4.5M | 2.5L | 4.5M | 80 | 49 |
| 5 | 4.5L | 6.5M | 4.5L | 6.5M | 90 | 49 |
| Social Aspiration level | |
| 6 | 4.5L | 4.5M | 6.5L | 6.5M | 53 | 52 |
| 7 | 2.5L | 2.5M | 4.5L | 4.5M | 41 | 48 |
| 8 | 2.5L | 2.5M | 6.5L | 6.5M | 43 | 55 |
| 9 | 4.5L | 4.5M | 2.5L | 2.5M | 54 | 45 |
| 10 | 6.5L | 6.5M | 4.5L | 4.5M | 51 | 44 |
| 11 | 6.5L | 6.5M | 2.5L | 2.5M | 53 | 44 |
| Inequity Aversion | |
| 12 | 4.5L | 4.5M | 4.5L | 6.5L | 55 | 48 |
| 13 | 4.5L | 4.5M | 4.5M | 6.5M | 51 | 50 |
| 14 | 2.5M | 4.5L | 4.5L | 6.5M | 80 | 45 |
| 15 | 4.5L | 6.5L | 4.5L | 4.5M | 88 | 45 |
| 16 | 4.5M | 6.5M | 4.5L | 4.5M | 83 | 47 |
| 17 | 4.5L | 6.5M | 2.5M | 4.5L | 87 | 43 |
| Comparison – No Inequity Aversion |
| 18 | 4.5L | 6.5L | 4.5L | 6.5L | 91 | 51 |
| 19 | 4.5M | 6.5M | 4.5M | 6.5M | 91 | 56 |
| Catch Trials & Classification |
| 20 | 2.5L | 6.5L | 2.5L | 6.5L | 96 | 49 |
| 21 | 2.5M | 6.5M | 2.5M | 6.5M | 94 | 51 |
| Note. The first number of each option is the expected value, and the
letter symbolizes outcome ranges: L = ± 0.5, M = ± 2.0. H
for high is reserved for stimuli in Experiment 2.
|
Table 1 shows the 21 choice situations, each consisting of a choice between
2 decks for the decision maker and a choice between 2 decks for the other
participant. Choices were presented in an order randomized for each
participant and presented once in each block. Each of the situations was
selected to test a particular hypothesis about how risk and inequity
influence decision making in this social situation. The first 5 choices in
the table examined risk attitude for self and other, comparing risk
preference for identical choices, with a risk-return trade-off in choices 4
and 5. The next 6 choices examined whether the rewards potentially
available to the other participant (higher or lower) influence risky choice
(and vice versa). The next 6 choices examined inequity aversion (both
advantageous and disadvantageous) by offering different potential reward
levels for self and other. The next 2 choices were used as comparison to
the inequity-aversion choices without differences in the choice menu
between self and other. The final two choices served as catch trials, with
an obvious dominant alternative, and, post-hoc, as a means of classifying
participants as pro- or anti-social based on how they chose for the other
participant.
In anticipation of Experiment 2, we define dominant choice situations as
ones where one option has a higher EV and the same or smaller range than
the other option and where the choice sets were the same for self and
other. Choices 18 and 19 also have this characteristic; however, because
they were used as comparisons for the inequity-aversion analysis (see the
Supplement), they were
not included in the primary classification. We revisit these trials in
later robustness checks.
As the task was self-paced, at the end of the experiment, some participants
had to wait for the other participants to finish. Once all participants
finished, participants were matched in groups of two, and one participant
from each pair was randomly determined to be the decision maker for that
pair. One trial was randomly selected, and the distributions selected by
the decision maker were played out for the decision maker and the other
group member separately. The outcomes of these draws determined the
variable payoffs for the two group members, respectively. Participants saw
their own outcome on the computer screen and learned whether their own
decision has been implemented or whether their outcome was determined by
the other participant. Nobody, however, knew with whom they had been
paired. Payment was given individually at the end of the experiment.
While participants waited for the payment and before they saw their
experimental gains, they filled out the paper-and-pencil 6-item version of
the SVO-Slider (Murphy, Ackerman & Handgraaf, 2011). This task consists of
6 mini-dictator games. In each game, participants chose how to distribute
money for themselves and someone else from 9 different distributions; these
distributions varied across the 6 games. The different available
distributions systematically varied the possible choice sets, thus allowing
us to distinguish different motives, such as maximizing own outcome or
maximizing social outcome. These choices were not incentivized. For each
participant, an SVO angle was computed based on the choices made (see
Murphy et al., 2011, for a
graphical depiction of the logic behind these calculations). This angle is
calculated as the inverse tangent of the ratio between the mean allocation
for the other person and for oneself (subtracted by 50 monetary units
each). Larger angles mean a higher degree of prosocial attitudes. Zero
degrees signifies a perfectly selfish individual who maximizes their own
allocation and otherwise chooses a random allocation for the other
person. The computed angles are divided into a discrete classification
system that bunches people into four groups from low to high prosociality:
Competitive (SVO angle below −12.04°) means people gain utility
from having a high difference in outcomes between oneself and someone
else. Selfish (SVO angle between −12.04° and 22.45°) means that
people gain utility only from their own outcomes and do not care about the
outcome of others. Prosocial (SVO angle between 22.45° and 57.17°)
means that people gain utility from their own and from someone else’s
outcome or by minimizing the distance between their own and someone else’s
outcome. Finally, altruistic (SVO angle above 57.17°) means that
people only gain utility from outcomes for others.
All data analyses were conducted in RStudio 0.99 (R studio team, 2015)
based on R 3.3.0 (R core team, 2016). Regressions were performed with
the packages lme4 (Bates, Maechler, Bolker & Walker, 2015) and
lmerTest (Kuznetsova, Brockhoff & Christensen, 2017). Regressions had
subject random intercepts and used the logit link function with
interaction and main effects as reported in the text. Effect sizes were
calculated as Cohen’s d from the choice proportion
differences, and mean differences are presented with 95% confidence
intervals. In general, the data analyses followed the pre-registered
plan. Any deviations from this pre-registered analysis plan are clearly
marked in the Results section.
2.2 Results
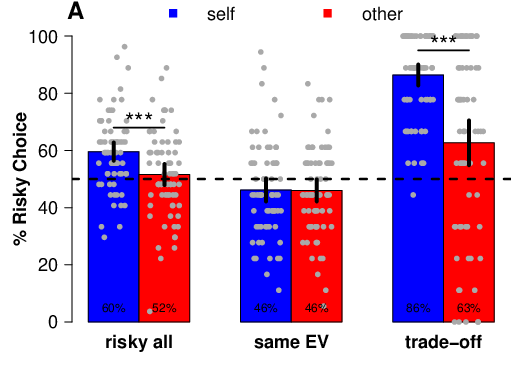
2.2.1 Risky Choices
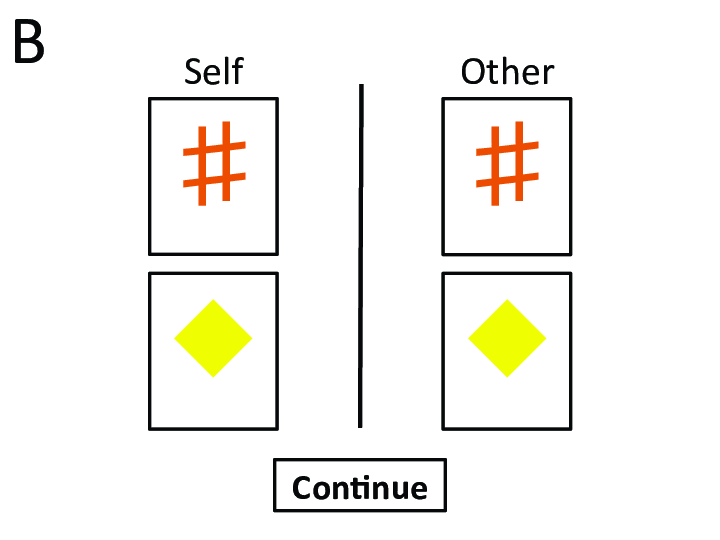
First, we examined how risky choices differed when participants chose
for themselves or another participant from the same choice set. Figure
2A shows the percentage of risky choices aggregated over all trials and
all participants for choice situations 1–5 (left), 1–3 (middle), and
4–5 (right). For choices 1–5 (see Table 1), there was one smaller and
one larger range option. Participants chose the larger range option
13.3 ± 6.5 percentage points (Mean ± 95% confidence
interval) more often for themselves than for someone else. A Wilcoxon
test confirmed a significant difference between choices for self and
other (W(n = 58) = 1178.5, d = 0.52,
p < .001).1 Follow-up exploratory analyses showed that this effect,
however, was entirely due to choices 4–5, which differed from choices
1–3 in that there was a risk-return trade-off between a small-range,
low-expected-value (EV) option and a large-range, high-EV option. Here,
people chose the safer option 35.3 ± 9.3% more often for others
than themselves (W(n = 58) = 836, d =
0.94, p < .001). There was little difference,
however, between choices for self and other in choices 1–3 (−1.3
± 6.9%), where the expected value was the same for both options
(W(n = 58) = 579, d = 0.05, p
> .250). These results were confirmed by a logistic
regression with random subject effects showing that there was a
significant interaction between the choice type (1–3 vs. 4–5) and
choices for self and other (b = 1.83, SE = 0.22,
p < .001).
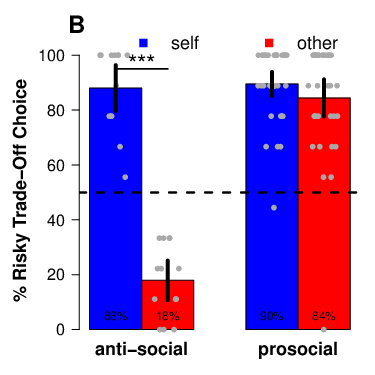
| Figure 2: (A) Mean percentage (± 95% CI) of risky choices for all
risk-attitude choice situations and then separately for those with the
same expected value (1–3) and those with a risk-return trade-off (4–5).
Grey dots are choice percentages for individual participants using
horizontal jitter. (B) Mean percentage (± 95% CI) of risky
choices for choice with a risk-return trade-off (4–5), split by
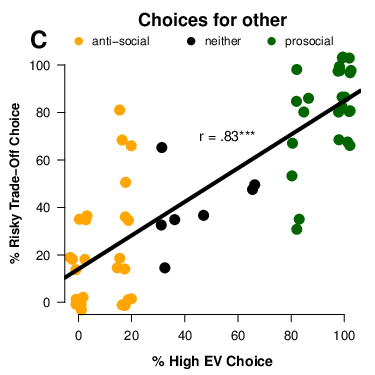
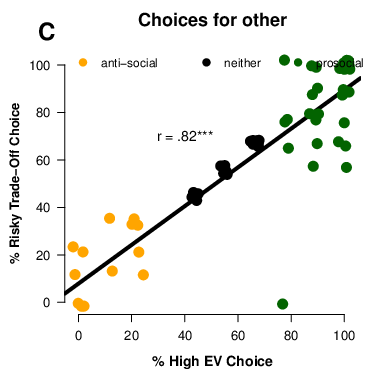
participant classification as prosocial or anti-social. (C) Percentage
of risky choices for others in the risk-return trade-off choices (4–5)
correlated with the percentage of dominant choice for other in
classification trials (20–21), where colors illustrate the
classification scheme applied and vertical and horizontal jitter was
applied to make all points visible. *** = p < .001. |
Further exploratory analyses revealed that there was a strongly bimodal
distribution of choice proportions when deciding for others in choices
20 and 21. These situations consist of options with one low-EV and one
high-EV option with equal range for both self and other. Thus, one
option dominated the other. In choices for oneself, these situations
were used as catch trials. In choices for others, these situations were
used to classify participants. People used two clearly distinct
strategies in choices for others: Figure 2C shows how 25 participants
chose the higher-EV option for the other participants 5 or 6 out of 6
times they encountered the choice situation (green in figure), whereas
26 participants chose the higher-EV option 0 or 1 out of 6 times
(yellow). In line with the literature about distributional choices, we
term these two choice patterns as prosocial, where people either try to
maximize the outcome for the other participant or minimize the
difference between outcomes (as they chose the higher-EV option for
themselves most of the time), and anti-social, where people try to
minimize the outcome for the other participant or maximize the
difference between outcomes.
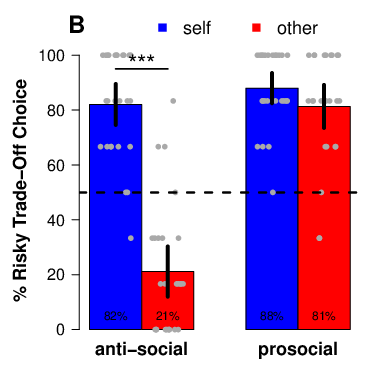
Figure 2B shows that participants classified as anti-social chose the
risky option 60.9 ± 13.3% more often for themselves than for
others in choice situations (Choices 4–5) involving a risk-return
trade-off (W(n = 26) = 323.5, d = 1.76,
p < .001), as compared to prosocials, who only did
so 6.7 ± 7.5% more often (W(n = 25) = 42.5,
d = 0.35, p = .134). Anti-social participants
consistently chose the lower-EV option for the other participant. This
pattern was corroborated by a mixed-effects logistic regression where
the interaction between choosing for oneself or other and being
classified as either anti-social or prosocial was significant in the
risk-return trade-off choices 4–5 (b = 2.49, SE =
0.45, p < .001). Moreover, Figure 2C plots risky
choice in risk-return trade-off choices 4–5 against the choices in
situations 20–21: There was a strong correlation between the number of
higher-EV choices for others in the classification trials and the
number of risky choices for others in the risk-return trade-off choices
(r(56) = 0.83, p < .001).
2.2.2 Classification Results Compared to the SVO Questionnaire
Using the standard classification borders, the SVO slider questionnaire
classified 25 people as prosocial, 33 as selfish, and 0 as competitive
or altruistic. For the choice task, SVO prosocials would be expected to
choose the higher-EV option for others consistently, because they
benefit from minimizing the difference between themselves and another
participant or because they want to maximize joint welfare. Those
classified as selfish by the SVO should be indifferent with respect to
the other participant’s outcome. Thus, they should respond at a chance
level with respect to choices for others with different expected
values. In contrast, in the classification trials 20–21, 26
participants consistently chose the lower-EV option for the other
participant — a strongly anti-social pattern, which may arise out of
competitive motives. Yet, none of these 26 participants were classified
as competitive by the SVO. To see whether the classifications of the
experience-based task and the SVO are homogenous, we conducted a
Stuart-Maxwell test on the joint frequency table. This test rejects
homogeneity of the two classifications (χ2(2)
= 17, p < .001). We thus conclude that the
classification based on the SVO differs from the classification
according to the main experience-based task. In particular, as is
apparent in Figure 3A, the SVO did not classify the same number of
people as anti-social or competitive compared to the main
classification task.
Using the continuous scale of the SVO slider (Figure 3), where higher
values indicate more prosocial behavior, there was a slight, but not
statistically significant, positive correlation between angle and
percentage of high-EV choices for the other participant in the choice
task (r(56) = .23, p = .077). The
correlation of the SVO angle with choosing the risky (and high-EV)
option for other was numerically somewhat smaller in the risk-return
trade-off choices (r(56) = .15, p >
.250).
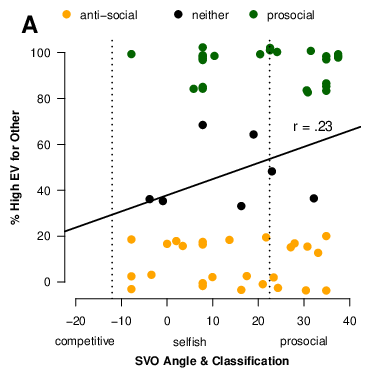
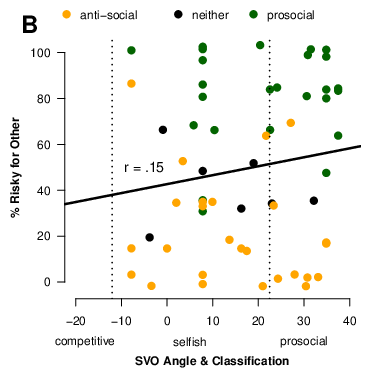
| Figure 3: (A) Comparison of classification of prosocial behavior in the
decision-from-experience task (choices 20 & 21) and the SVO
Questionnaire (mini-dictator games). (B) Correlation between risky
choice for others in the risk-return trade-off choices (4 & 5) and the
SVO Questionnaire. In both figures the colors signify classification
based on the decision-from-experience task, and vertical jitter was
used to ensure visibility of all datapoints. |
2.2.3 Robustness
As a robustness check, we assessed a different classification criterion,
using choices 18 and 19 (instead of 20 and 21; see Table 1), where
there was also a dominant option. With this alternate classification,
19 participants were classified as anti-social (of whom one was not
classified as anti-social originally and 8 previously classified as
anti-social are absent) and 24 as prosocial (of whom one was not
classified as prosocial originally and two previously classified as
prosocial are absent). As before, the anti-social participants chose
the risky option 68.4 ±14.3% more often for themselves than others
when there was a risk return trade-off in choices 4–5
(W(n = 19) = 171, d=2.15, p
<.001), whereas prosocials only did so 4.9 ±7.0% of the
time (W(n = 24) = 32.5, d = 0.28, p
> .250). A logistic regression confirmed a significant
interaction between choosing for self and other and being classified
anti-social or prosocial according to choices 18 and 19 in risk-return
trade-off choices: b = 3.08, SE = 0.51, p
< .001.
Furthermore, we checked for robustness of our analyses with respect to
sampling errors. To do so, we compared the sampled mean and range with the
theoretical mean and range of the respective choice options. After the
first round of sampling, in none of the 348 relevant comparisons
(risk-return trade-off choices 4 & 5 and classification choices 20 & 21)
did the lower-EV option have a higher experienced EV, and in only 5
comparisons, was the higher-EV option better by less than £0.5 (compared to
a £2 difference in the generative distributions). In only 7 out of 464
relevant comparisons (risky choices 1–5), the smaller-range option had the
higher experienced range, and in only 18 comparisons, the difference
between experienced ranges was less than ¼ of the theoretical range
difference after the first round of sampling. The number of deviations
between experienced and planned distributions was even lower after the
second and third round of sampling.
To see whether these few trials affected our results, we excluded
choices in all rounds where the previously experienced means or ranges
were much closer to each other than planned (given the criteria above)
after the first round of sampling. This exclusion removed 63 out of
1218, or roughly 5% of the relevant choices (risky choices 1–5 and
classification 20 & 21). All the Wilcoxon tests performed above
yielded qualitatively similar results after these exclusions.
In the pre-registration, we also asked questions about how the rewards
of others influence risk preference (Choices 6–11), inequity aversion
(Choices 12–19), and the sampling process. These analyses are included
in the Supplement
for completeness.
3 Experiment 2
In Experiment 1, people were more risk averse when deciding for others
than for themselves in an experience-based task. Exploratory analyses
showed that this effect was related to anti-social motives: Some of the
participants consistently chose lower-EV options for others in
risk-return trade-off situations. In addition, classification of
participants based on the experience-based task was a much better
predictor of anti-social behavior in risk-return trade-off choices than
was classification based on the SVO slider task.
We pre-registered a second study to confirm the exploratory result by
increasing the number of gambles used to examine risky choice and
classify participants (see Table 2). In addition, we wanted to address
two further open questions: First, participants were risk neutral in
choices that differed only in range. This pattern could reflect a
genuine preference, but could also reflect a lack of learning about
range differences between the decks. Therefore, we increased the range
differences, reduced the number of decks, and explicitly asked
participants about the ranges of outcomes. Second, we aimed to confirm
the result that high levels of anti-social behavior were specific to
choices under uncertainty. Therefore, we used a computerized version of
the SVO and an extra one-shot choice under certainty, both fully
incentivized, so as to be more comparable to the main task.
| Table 2: Choice situations in Experiment 2. % Self-B is the percentage of trials where option B was chosen for
oneself. % Oth.-B is the percentage of trials where option B was chosen for the
other person. |
| | Self-A | Self-B | Other-A | Other-B | % Self-B | % Oth.-B |
| Risk Attitude | |
| 1 | 4L | 4M | 4L | 4M | 40 | 42 |
| 2 | 4M | 4H | 4M | 4H | 47 | 45 |
| 3 | 4L | 4H | 4L | 4H | 37 | 39 |
| 4 | 6L | 6M | 6L | 6M | 44 | 50 |
| 5 | 6M | 6H | 6M | 6H | 54 | 52 |
| 6 | 6L | 6H | 6L | 6H | 54 | 49 |
| 7 | 4L | 6M | 4L | 6M | 84 | 62 |
| 8 | 4M | 6H | 4M | 6H | 89 | 62 |
| 9 | 4L | 6H | 4L | 6H | 87 | 65 |
| Inequity Aversion | |
| 10 | 4L | 6L | 4L | 4M | 79 | 35 |
| 11 | 4M | 6M | 4M | 4H | 78 | 44 |
| 12 | 4H | 6H | 4M | 4H | 81 | 49 |
| 13 | 4L | 4M | 4L | 6L | 38 | 64 |
| 14 | 4M | 4H | 4M | 6M | 44 | 52 |
| 15 | 4M | 4H | 4H | 6H | 51 | 56 |
| Comparison – No Inequity Aversion |
| 16 | 4L | 6L | 4L | 6L | 82 | 65 |
| 17 | 4M | 6M | 4M | 6M | 88 | 68 |
| 18 | 4H | 6H | 4H | 6H | 85 | 67 |
| Catch Trials & Classification | |
| 19 | 4H | 6L | 4H | 6L | 85 | 66 |
| 20 | 4M | 6L | 4M | 6L | 86 | 66 |
| 21 | 4H | 6M | 4H | 6M | 88 | 69 |
| Note. The first number of each option is the mean value, and the letter
symbolizes the range: L = ±0.5, M = ±2, H = ±3.5.
|
3.1 Method
3.1.1 Participants
Sixty-nine participants were recruited in 7 sessions of 4–12
participants from the same participant pool as Experiment 1. The number
of participants was estimated prior to the experiment with a power
analysis, as in the first experiment. Two participants were excluded
who either could not be matched to a partner or failed the exclusion
criterion (i.e., sampled one option fewer then 5 times), which left 67
participants (Mage = 23.6,
SDage = 3.1; 40 female, 27 male). Participants
were paid a show-up fee of £4 plus a variable bonus depending on their
own choices or the choices of a matched partner (ranging from £1.50 to
£8.59, M = £4.71). Again, all methods and analyses were
pre-registered and can be found together with all other material at
https://osf.io/2bts4.
3.1.2 Procedure
The procedure was largely the same as in Experiment 1, with some changes
in the reward distributions and the choice situations (see Table 2). In
particular, the number of distributions (decks) was reduced from 8 to
6, a third range level was introduced, and only 2 mean values were
used. The uniform distributions had a mean value of either 4 or 6 and a
range of either ±0.5 (low), ±2 (medium), or ±3.5 (high). Table 2 shows
the revised choice situations, which were selected to best follow up
the results from the first study. There were 9 choice situations
assessing risk attitude, of which 3 contained a risk-return trade-off.
Furthermore, as in the first experiment, 9 choice situations assessed
inequity aversion and 3 additional situations were used for classifying
participants and as a manipulation check. The number of samples in each
sampling block was changed slightly to boost learning about the 6 decks
during the first block. Specifically, people sampled 80 times in the
first block and only 30 times in each of the second and third sampling
blocks. Again, participants could distribute these samples in any order
they wanted among the 6 available decks.
After the final choice block, there was an additional choice between two
certain options (a certain £4 vs. a certain £6) both for oneself and
for another participant. After that question, the computerized version
of the SVO slider (6 items) was presented. Finally, 4 additional
questions assessing participants’ knowledge about the ranges of the
decks were presented. For each EV level, two questions were asked:
First, all three decks with the same EV were presented, and
participants were asked which deck was the riskiest. Second, all three
decks were again presented, and participants were asked which deck was
the safest. The same two questions were then repeated with the other
three decks with the other EV. The payment mechanism was the same as in
the first experiment, with the difference that a payoff-relevant trial
could also be chosen from the SVO choices or from the choice under
certainty. Thus, all choices were incentivized, but the questions about
the decks’ ranges were not.
3.2 Results
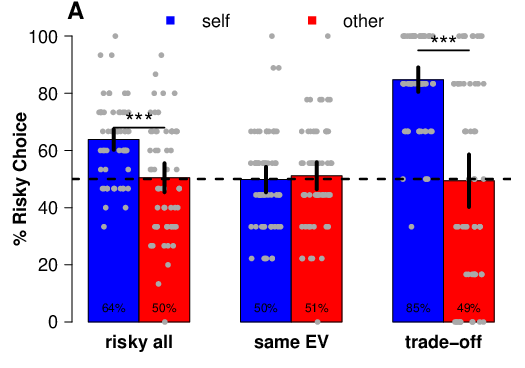
| Figure 4: (A) Mean percentage (± 95% CI) of risky choices for
self and other in all choice situations with different ranges (choice
situations 1–9, left) and separately for those with the same expected
value (1–6, middle) and those with a risk-return trade-off (7–9,
right). Grey points represent individual participants with horizontal
jitter. (B) Mean percentage (± 95% CI) of risky choices for self
and other with a risk-return trade-off (7–9), split by participant
classification. (C) Percentage of risky choices for others in the
risk-return trade-off choices (7–9) correlated with the percentage of
dominant choice for other in classification trials (19–21), where
colors illustrate the classification scheme applied and both vertical
and horizontal jitter were used. *** = p < .001. |
3.2.1 Risky Choices
With more risky-choice situations (1–9 in Table 2), the pattern from
Experiment 1 was confirmed. Figure 4A shows how, overall, people chose
the risky option 8.0 ± 4.0% more often for themselves than for
others (W(n=67) = 709, d = 0.48, p
< .001). This difference was again driven by choices with a
risk-return trade-off (7–9), where people chose the risky option 23.7
± 7.9% more often for themselves (W(n=67) =
780.5, d = 0.72, p < .001), as opposed to
those with equal expected value (1–6), where people only chose the
risky option 0.2 ± 4.2% more often for themselves
(W(n=67) = 2202, d = 0.01, p
> .250). This interaction in the percentage of risky
choices for oneself and others in trade-off choices (7–9) as compared
to choices with the same EV (1–6) was confirmed through a mixed-effects
logistic regression (b = 1.37, SE = 0.17, p
< .001).
As pre-registered, situations where one option dominated the other in
terms of EV and range (19–21 in Table 2) were used as a measure of
other-regarding preferences to classify the participants. Participants
were classified as anti-social if they chose the dominating option for
the other participant up to 2 out of 9 trials (13 participants) and as
prosocial if they chose it at least 7 times (35 participants). These
criteria left 19 participants unclassified (see Figure 4C). Figure 4B
shows that those classified as anti-social chose the safe option 70.1
± 12.9% more often for others than for themselves in the
risk-return trade-off choice situations (W(n=13) =
169, d = 2.95, p < .001), whereas those
classified as prosocial did so only 5.1 ± 5.7% more often
(W(n=35) = 685, d = 0.30, p =
.108), yielding a significant interaction in a mixed-effects logistic
regression (b = 3.35, SE = 0.48, p
< .001). Thus, the main results of the first study were
confirmed in this replication with different choice situations. In
addition, in choices with the same EV where only the range differed,
people trended toward expressing slight risk aversion; that is, they
chose the larger range option slightly less than 50% of the time for
themselves and others (Self: W(n=67) = 670.5,
d = 0.23, p = .048; Other: W(n=67)
= 745.5, d = 0.25, p = .071)
3.2.2 Classification Results
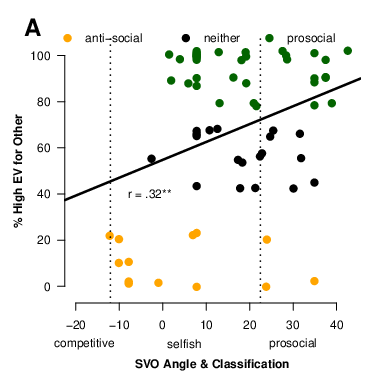
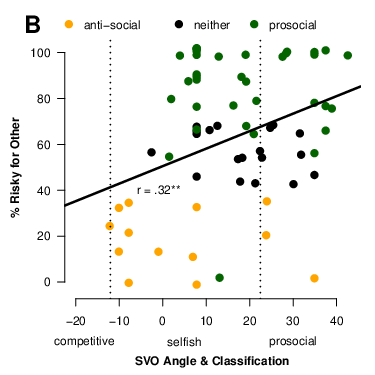
| Figure 5: (A) Comparison of the two methods for classification of
prosocial individuals in Exp 2 — choices with a dominant option for
others in the main DfE task (i.e., choices 19–21) and the SVO
Questionnaire (dictator games). (B) Correlation between choosing
riskily for others in the risk-return trade-off choices (Choices 7–9 in
the DfE task) and classification from the SVO Questionnaire. In both
figures the colors signify classification based on the
decision-from-experience task and vertical jitter was used. ** p
< .01. |
Because the SVO questionnaire in the first study did not capture the
observed anti-social behavior in risk-return trade-off trials, we
implemented a computerized and incentivized version of the SVO in
Experiment 2. Nonetheless, classification results in the SVO were
comparable to Experiment 1: 22 prosocial, 44 selfish, and 1
competitive. The classifications from the SVO and the experience-based task
differed significantly from one another, as confirmed by a Stuart-Maxwell
test (χ2(2) = 19.94, p < .001). Using the
continuous scale of the SVO slider (Figure 5), however, where higher values
signify more prosocial behavior, there was a significant positive
correlation between the SVO angle and percentage of high-EV choices for the
other participant (r (65) = .32, p = .008). Furthermore,
there was a significant correlation between the SVO angle and the choice of
risky (and high-EV) options for others in the risk-return trade-off choices
(r(65) = .32, p = .007). This pattern indicates that the
SVO does not predict the amount of anti-social behavior present in the
decisions-from-experience task, but does capture part of the individual
differences in this task.
In the two-choice distribution task under certainty, where people
decided between taking either a certain £4 or £6 for themselves and
then again for the other person, 17 of 67 participants chose the lower
outcome for the other person. Thus, anti-social behavior was more
pronounced here than in the SVO, where there were trade-offs between
one’s own and another person’s outcome.
3.2.3 Robustness
Above, as pre-registered, we classified individuals on the basis of a
subset of trials where there were dominant (higher mean; equal or
smaller range) options for others (Choices 19–21 in Table 2). As in
Experiment 1, by this definition, there were additional choices with a
dominant option, which served as a comparison for any potential
inequity aversion (see supplemental material). As a robustness check,
we re-did our analyses with these trials to classify participants. With
these trials, 10 participants were classified as anti-social (of whom 2
were not classified as anti-social according to the original
classification trials and 5 previously classified as anti-social are
absent) and 36 as prosocial (of whom 5 were not classified as prosocial
according to the original classification trials and 4 previously
classified as prosocial are absent). On the risk-return trade-off
choices (7–9), the anti-social individuals chose the risky (higher EV)
option 72.2 ±17.9% more often for themselves than others
(W(n = 10) = 100, d = 2.51, p
< .001), whereas prosocials did so only 4.6 ±4.1% more
often (W(n = 36) = 743, d = 0.37, p
> .250. A logistic regression confirmed this significant
interaction between risk preference for self and other and being
classified as antisocial or prosocial according to Choices 16–18:
b = 3.53, SE = 0.53, p < .001.
As in Experiment 1, we also checked for robustness of the analyses with
respect to sampling errors. To do so, we examined how the experienced
outcomes matched the generative distributions. After the first round of
sampling, the lower EV option had the higher experienced EV in only 3
of 402 relevant comparisons (risk-return trade-off choices 7–9 and
classification choices 19–21). In addition, this difference was smaller
than £0.50 in only 5 additional comparisons (compared to the planned
£2). In terms of the range, in the 804 relevant comparisons (risky
choices 1–9 and classification choices 19–21), the smaller-range option
had the higher experienced range 10 times and the difference in ranges
was smaller than ¼ of the planned difference 28 additional times after
the first round of sampling. The numbers of such sampling errors were
even lower after the second and third round of sampling. Excluding all
these trials led to the exclusion of 90 out of 2412 choices, or 4% of
the relevant choices, and the qualitative results for all statistical
tests remained identical.
To check whether participants learned about the different levels of outcome
ranges associated with the decks, we asked people to name the safest or
riskiest out of each set of three decks with the same EV. There were 4
questions with 3 potential answers, thus the guessing rate was 1.33 correct
answers. Figure 6 plots the frequencies of correct answers for all
participants: 53 participants were above the guessing rate, and the average
score was significantly better than this guessing rate (M = 2.1
± 0.2). There was no reliable correlation between the number of
correct range answers and the likelihood of choosing the high-EV option for
others in the classification trials, r(65) = -0.11, p
> .250. In addition, anti-social and prosocial participants
did not reliably differ in the number of correct answers to the range
questions (MAntisocial = 2.31 and
MProsocial = 2.03, t(18.99) = 0.80,
p > .25, corrected for heterogeneity of variance).
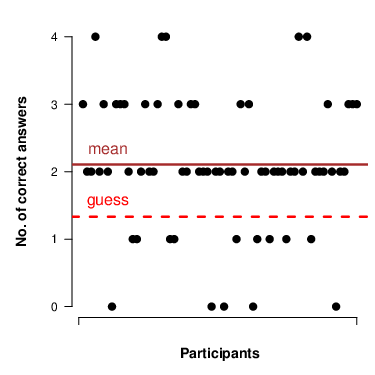
| Figure 6: Scatterplot of people based on the number of correct answers
given for the range questions (4 total questions with three answer
options for each). |
To see whether the key effects were driven by participants who could not
distinguish between the different levels of range, we excluded participants
who were below the guessing rate of 1.33 (14 participants with 0 or 1
correct answers excluded). There was still a significant difference between
self and other for all risky choices 1–9 of 7.6 ± 4.3%
(W(n = 53) = 454, d = 0.49 p
< .001). Furthermore, there was also a significant difference in
the risk-return trade-off choices 7–9: 24.5 ±8.8% (W(n
= 53) = 514, d = 0.75, p < .001).
The pre-registered analyses concerning inequity aversion (choices 10–18)
and the analyses of the sampling process are again included in the
Supplement
for completeness.
4 General Discussion
Across two experiments, people were more risk averse for others, largely
due to a subset of participants who showed reward-maximizing behavior
for themselves, but not for others. This anti-social behavior emerged
only when there was uncertainty around the actual outcomes, but not in
the social-value-orientation (SVO) questionnaire where decisions were
made between certain outcomes. This study represents one of the first
examinations of risky choice for others in a task that uses decisions
from experience (Hertwig et al., 2004), building on prior work that
used explicit descriptions of the risky outcomes (Bolton & Ockenfels,
2010; Chakravarty et al. 2011; Pollmann et al., 2014; Raynold et al., 2009). The
results suggest that prior interpretations of differences in risky
choices for self and other as an expression of prosocial motives (e.g.,
Charness & Jackson, 2009) may need to be reconsidered.
The anti-social behavior amongst a significant subset of the
participants seems to be enabled by the outcome uncertainty in the
experience-based task, which is not present with the SVO slider, where
outcomes are certain. With uncertain outcomes, EV-minimizing choices
for others might feel less severe because the consequences have not yet
materialized. Similarly, people are known to give less in dictator
games if the relation between one’s own choice and the outcome for the
other person is uncertain or not transparent (Dana, Weber and Kuang,
2007; Haisley & Weber, 2010). This lack of transparency creates some
mental wiggle room, which allows for maintenance of a positive
self-image despite seemingly anti-social actions (e.g., Mazar, On &
Ariely, 2008; Rabin, 1995). Thus, in the DfE task, people could
potentially justify their selecting the not-yet-materialized bad
outcomes for the other person by engaging in wishful thinking and
assuming that, despite the non-maximizing choice, a relatively high
outcome might still occur.
The experience-based task used here introduces empirical uncertainty
about the possible outcomes into a social-choice task. Similarly,
greater uncertainty about another person’s motives is associated with
less cooperative behavior; for example, introducing uncertainty about
another person’s previous choices into a repeated prisoner’s dilemma
leads to less cooperation (Fudenberg, Rand & Dreber, 2012; Güth,
Mugera, Musau & Ploner, 2014). This study builds on these findings,
demonstrating that uncertainty not only increases selfish behavior, but
can even lead to anti-social behavior.
The design of our studies allows elimination of several alternative
explanations for the results. First, participants classified as
anti-social were not indifferent with respect to the other person’s
outcomes — choices for others systematically differed from random choice
both for choice situations with a risk-return trade-off and for the
classification choices (Figures 2 and 4). In addition, participants
learned the values of the different sets, as they consistently selected
for themselves the same high-EV decks that they denied to others.
Moreover, excluding those who performed poorly in a task where
participants had to distinguish decks by their variability in
Experiment 2 did not change the results. Our conclusions, however, must
be tempered by the observation that participants also exhibited
increased levels of anti-social behavior in a single question under
certainty, when asked directly to give a large or small amount to
oneself and another participant. This task differed from the SVO tasks
in that participants chose one outcome for themselves and one for the
other person, whereas they chose distributions for both players at once
in the SVO. The answers to this single choice suggest that, in addition
to shifting to experience-based questions, other changes to the answer
format might also trigger more anti-social behavior.
The observed increase in risk aversion for others in these
experience-based decisions resembles behavior in some studies when
decisions are based on summary descriptions (e.g., Raynold et al., 2009), though other description-based studies have instead
found more risk seeking for others (e.g., Chakravarty et al., 2011).
Anti-social motives, as found here, might help provide an explanation
as to why people sometimes choose more riskily and sometimes less so
for others with described choices: When choosing between two options
with different variances, if the higher variance option is more
attractive to the decision maker, people may act more risk averse for
others because they, anti-socially, choose this attractive
high-variance option less often for others (as was the case with the
risk-return trade-off trials in our experiments). If, however, the
low-variance option is more attractive to the decision maker, people
may, anti-socially, select the low-variance less often for others,
producing more risk-seeking (as was the case in the classification
trials in Exp. 2). Whether this line of reasoning about anti-social
motives applies to description-based choices is an open question. At
first glance, the explicit descriptions of probabilistic outcomes would
seem to provide less mental wiggle room to justify a bad choice for
another person (Haisely & Weber, 2010). Nonetheless, wishful thinking
about the unrealized outcomes is still possible, even when the odds and
outcomes are fully described.
Our results have implications for other, related situations where people
make decisions for others. For example, one design variation in the
literature examines choices for a team including the decider, so that
choices for self and other are not separate (e.g., Bolton & Ockenfels,
2010; Rohde & Rohde, 2011). It would be interesting to see in future
studies whether a similar share of anti-social people would also be
present when those who choose a bad option for the team would also
suffer themselves. There is also some related research on how people
predict the risk attitudes of others. People can be very inaccurate
when predicting other people’s risk preferences (Faro & Rottenstreich,
2006; Hsee & Weber, 1997); this inaccuracy could be a further reason
why they choose differently for others. It would be interesting to
examine whether predictions about other people’s preferences are more
or less accurate after the decision maker experiences the outcomes
rather than reading descriptions of them. Finally, choices for others
can occur not only in the monetary realm, but also in the social
domain, as in, for example, romantic relationships (e.g., Beisswanger,
Stone, Hupp, Allgaier, 2003). In these instances, experience-based
learning might have an even more pronounced effect on choices than in
the monetary domain because non-monetary outcomes might be more
memorable once experienced.
Social preferences differ significantly under risk or uncertainty relative
to certainty (Bolton, et al., 2015; Bradler, 2009). Given the
uncertainty in our daily interactions and in the economy more generally,
measuring social preferences only under certainty (e.g., in a dictator
game) may underestimate the role that anti-social behavior plays in daily
life. Our experiments suggest that categorizations based on the SVO
Questionnaire may underestimate the role of competitive behavior under
uncertainty, though the continuous SVO measure does capture some of the
individual differences (Exp. 2). Prosocial preferences thus do seem to
generalize across certainty and uncertainty, but there are also
considerable individual differences in how people deal with uncertainty
that are not captured by social preferences under certainty (Roch &
Samuelson, 1997). People may, for example, differ in the degree they create
and use the mental wiggle room that provides for plausible deniability in
highly uncertain situations.
The high level of anti-social behavior in the current DfE task is more
congruent with the competitive motives observed in real-world studies
of the links between happiness and income rank (Clark & Oswald, 1996)
than with behavior typically observed in laboratory studies of
prosociality (Engel, 2011). Our results suggest that, in the real
world, a key difference that enables the expression of such anti-social
behavior is the level of uncertainty. In line with this idea, people
use the risk in the outcome of a donation to a charity as an excuse not
to give (Exley, 2015). Similarly, returning to the example from the
introduction, making decisions that affect one’s own career path or the
career paths of peers is only indirectly connected to income levels,
which are known only with uncertainty. Reducing the uncertainty of
potential future outcomes would thus seem to be one way to increase
prosociality.
References
Au, W. T., & Kwong, J. Y. (2004). Measurements and effects of social-value
orientation in social dilemmas. In R. Suleiman, D. V. Budescu, I. Fisher,
& D. M. Messick (Eds.), Contemporary Psychological Research on
Social Dilemmas (pp. 71–98). Cambridge University Press.
Bates, D., Maechler, M., Bolker, B., & Walker, S. (2015). Fitting
linear mixed-effects models using lme4. Journal of Statistical Software,
67(1), 1–48.
Beisswanger, A. H., Stone, E. R., Hupp, J. M., & Allgaier, L. (2003).
Risk taking in relationships: Differences in deciding for oneself versus for a
friend. Basic and Applied Social Psychology, 25(2), 121–135.
Bolton, G. E., & Ockenfels, A. (2000). ERC: A theory of equity,
reciprocity, and competition. American Economic Review, 90(1), 166–193.
Bolton, G. E., & Ockenfels, A. (2010). Betrayal aversion: Evidence from
Brazil, China, Oman, Switzerland, Turkey, and the United States:
Comment. American Economic Review, 100(1), 628–633.
Bolton, G. E., Ockenfels, A., & Stauf, J. (2015). Social responsibility
promotes conservative
risk behavior. European Economic Review, 74, 109–127.
Bradler, C. (2009). Social Preferences under Risk-An Experimental
Analysis. Jena Economic Research Papers, 022.
Brock, J. M., Lange, A., & Ozbay, E. Y. (2013). Dictating the risk:
Experimental evidence on
giving in risky environments. American Economic
Review, 103(1), 415–437.
Brown, G. D. A., Gardner, J., Oswald, A. J., & Qian, J. (2008). Does
wage rank affect
employees’ well-being? Industrial Relations: A Journal of
Economy and Society, 47(3), 355–389.
Charness, G., & Jackson, M. O. (2009). The role of responsibility in
strategic risk-taking. Journal of Economic Behavior &
Organization, 69(3), 241–247.
Charness, G., & Rabin, M. (2002). Understanding social preferences with
simple tests. The
Quarterly Journal of Economics, 117(3), 817–869.
Chakravarty, S., Harrison, G. W., Haruvy, E. E., & Rutström, E. E.
(2011). Are you risk
averse over other people’s money? Southern Economic
Journal, 774), 901–913.
Clark, A. E., & Oswald, A. J. (1996). Satisfaction and comparison
income. Journal of Public
Economics, 61(3), 359–381.
Crockett, M. J., Kurth-Nelson, Z., Siegel, J. Z., Dayan, P., & Dolan,
R. J. (2014). Harm to others outweighs harm to self in moral decision
making. Proceedings of the National Academy of
Sciences, 111(48), 17320–17325.
Engel, C. (2011). Dictator games: A meta study. Experimental
Economics, 14(4), 583–610.
Exley, C. L. (2015). Excusing selfishness in charitable giving: The role
of risk. The Review of Economic Studies, 83(2), 587–628.
Dana, J., Weber, R. A., & Kuang, J. X. (2007). Exploiting moral wiggle
room: experiments
demonstrating an illusory preference for fairness. Economic
Theory, 33(1), 67–80.
Faro, D., & Rottenstreich, Y. (2006). Affect, empathy, and regressive
mispredictions of others’ preferences under risk. Management
Science, 52(4), 529–541.
Fehr, E., & Schmidt, K. M. (1999). A theory of fairness, competition,
and cooperation. The
Quarterly Journal of Economics, 114(3), 817–868.
Fudenberg, D., Rand, D. G., & Dreber, A. (2012). Slow to anger and fast
to forgive:
Cooperation in an uncertain world. American Economic
Review, 102(2), 720–749.
Glöckner, A., Hilbig, B. E., Henninger, F., & Fiedler, S. (2016). The
reversed description-experience gap: Disentangling sources of presentation format effects in
risky choice. Journal of Experimental Psychology:
General, 145(4), 486.
Gneezy, U., & Potters, J. (1997). An experiment on risk taking and
evaluation periods. The
Quarterly Journal of Economics, 112(2), 631–645.
Güth, W., Mugera, H., Musau, A., & Ploner, M. (2014). Deterministic
versus probabilistic
consequences of trust and trustworthiness: An experimental
investigation. Journal of Economic Psychology, 42,
28–40.
Haisley, E. C., & Weber, R. A. (2010). Self-serving interpretations of
ambiguity in other-regarding behavior. Games and Economic
Behavior, 68(2), 614–625.
Hertwig, R., Barron, G., Weber, E. U., & Erev, I. (2004). Decisions
from experience and the
effect of rare events in risky choice. Psychological
Science, 15(8), 534–539.
Holt, C. A., & Laury, S. K. (2002). Risk aversion and incentive
effects. American
Economic Review, 92(5), 1644.
Hsee, C. K., & Weber, E. U. (1997). A fundamental prediction error:
Self–others
discrepancies in risk preference. Journal of Experimental
Psychology: General, 126(1), 45.
Kahneman, D., Knetsch, J. L., & Thaler, R. (1986). Fairness as a
constraint on profit seeking:
Entitlements in the market. American Economic Review,
76, 728–741.
Krawczyk, M., & Le Lec, F. (2010). ‘Give me a chance!’ An experiment in
social decision under risk. Experimental
Economics, 13(4), 500–511.
Kellen, D., Pachur, T., & Hertwig, R. (2016). How (in)variant are
subjective representations
of described and experienced risk and rewards? Cognition, 157,
126–138.
Kuznetsova, A., Brockhoff, P. B., & Christensen, R. H. B. (2017).
LmerTest package: Tests in linear mixed effects models. Journal
of Statistical Software, 82(13), 1–26.
Liebrand, W. B. (1984). The effect of social motives, communication and
group size on
behaviour in an N-person multi-stage mixed-motive
game. European Journal of Social Psychology, 14(3),
239–264.
Ludvig, E. A., & Spetch, M. L. (2011). Of black swans and tossed coins:
is the description-experience gap in risky choice limited to rare events?. PloS
One, 6(6), e20262.
Ludvig, E. A., Madan, C. R., & Spetch, M. L. (2014). Extreme outcomes
sway risky decisions
from experience. Journal of Behavioral Decision Making, 27(2),
146–156.
Madan, C. R., Ludvig, E. A., & Spetch, M. L. (2017). The role of memory
in distinguishing
risky decisions from experience and description. The Quarterly
Journal of Experimental Psychology, 70(10), 2048–2059.
Mazar, N., Amir, O., & Ariely, D. (2008). The dishonesty of honest
people: A theory of self-concept maintenance. Journal of Marketing
Research, 45(6), 633–644.
Murphy, R. O., Ackermann, K. A., & Handgraaf, M. J. (2011). Measuring
social value
orientation. Judgment and Decision Making, 6(8),
771–781.
Peirce, J. W. (2007) PsychoPy - Psychophysics software in Python.
Journal of Neuroscience
Methods, 162(1–2), 8–13.
Perera, P., Canic, E., & Ludvig, E. A. (2016). Cruel to be kind but not
cruel for cash: Harm aversion in the dictator game. Psychonomic
Bulletin & Review, 23(3), 893–898.
Pollmann, M. M., Potters, J., & Trautmann, S. T. (2014). Risk taking by
agents: The role of ex-ante and ex-post accountability. Economics Letters, 123(3),
387–390.
R Core Team (2016). R: A language and environment for statistical
computing. R Foundation for Statistical Computing, Vienna, Austria.
URL: https://www.R-project.org/.
R Studio Team (2015). RStudio: Integrated Development for R. RStudio,
Inc., Boston, MA
URL: http://www.rstudio.com/.
Rabin, M. (1995). Moral preferences, moral constraints, and
self-serving biases. Economics
Working Papers 95–241. University of California at Berkeley.
Reynolds, D. B., Joseph, J., & Sherwood, R. (2011). Risky shift versus
cautious shift:
determining differences in risk taking between private and public
management decision-making. Journal of Business & Economics
Research, 7(1), 63–77.
Roch, S. G., & Samuelson, C. D. (1997). Effects of environmental
uncertainty and social
value orientation in resource dilemmas. Organizational Behavior
and Human Decision Processes, 70(3), 221–235.
Rohde, I. M., & Rohde, K. I. (2011). Risk attitudes in a social
context. Journal of Risk and
Uncertainty, 43(3), 205–225.
Selten, R. (2001). Blame avoidance as motivating force in the first
price sealed bid private
value auction. In: G. Debreu, W. Neuefeind, & W. Trockel (Eds),
Economics Essays. (pp. 333–344). Berlin: Springer.
Stone, E. R., & Allgaier, L. (2008). A social values analysis of
self–other differences in
decision making involving risk. Basic and Applied Social
Psychology, 30(2), 114–129.
Tideman, S., Frijters, P., & Shields, M. A. (2008). Relative income,
happiness, and utility: An
explanation for the Easterlin paradox and other puzzles. Journal
of Economic Literature, 46(1), 95–144.
Wulff, D. U., Mergenthaler-Canseco, M., & Hertwig, R. (2018). A
meta-analytic review of
two modes of learning and the description-experience
gap. Psychological Bulletin, 144(2), 140–176.
This document was translated from LATEX by
HEVEA.