Judgment and Decision Making, Vol. 13, No. 6, November 2018, pp. 514-528
Children’s application of decision strategies in a compensatory environment
Tilmann Betsch*
Anne Lehmann#
Marc Jekel$
Stefanie Lindow$
Andreas Glöckner$!
|
Adaptive actors must be able to use probabilities as decision weights.
In a computerized multi-attribute task, the authors examined the
decisions of children (5–6 years, n = 44; 9–10 y., n = 39) and adults
(21–22 y., n = 31) in an environment that fosters the application of a
weighted-additive strategy that uses probabilities as weights (WADD:
choose option with highest sum of probability-value products). Applying a
Bayesian outcome-based strategy classification procedure from adult
research, we identified the utilization of WADD and several other
strategies (lexicographic, equal weight, naïve Bayes, guessing, and
saturated model) on the individual level. As expected based on theory,
the prevalence of WADD-users in adults was high. In contrast, no
preschoolers could be classified as users of probability-sensitive
strategies. Nearly one-third of third-graders used probability-sensitive
strategies.
Keywords: child decision making, probabilistic inference, strategy
classification, information board
1 Introduction
Individuals use different strategies when searching and evaluating
information for decision making. The economist Herbert Simon introduced
this notion to decision research in the mid-20th century (Simon, 1955).
Still, decision researchers did not begin to study the application of
decision strategies systematically until some years later. A
groundbreaking development in research methodology paved the way for
such studies – information-board technology (Payne, 1976). In an
important paper, Payne, Bettman and Johnson (1988) introduced the
Mouselab, in which monetary gambles were displayed in a
matrix on a computer screen that crossed options (the choice
alternatives) with attribute dimensions. Dimensions differed with
regard to the probability that outcomes (certain amounts of money)
could occur. Individuals could inspect the outcomes by opening cells in
the matrix with the computer mouse. The gathering of information was
tracked by the computer. These search data were subsequently used to
identify strategies of information acquisition.
Using the Mouselab, decision processes are inferred from search
movements, i.e., the course and amount of inspected information.
However, inspecting a certain piece of information does not necessarily
imply that it is actually used in subsequent preference formation and
choice. With the advance of formal modelling, it became possible to
identify strategies without search data (Glöckner & Witteman, 2010,
for overviews). In outcome-based strategy classification (Bröder,
2010), the researcher varies patterns of information in such a way that
each decision strategy predicts a distinct choice sequence over a
series of decision trials. Participant’s choices can then be compared
to the strategy predictions. These and other sophisticated techniques
have been frequently applied in decision research on adults (e.g.,
Bröder 2003; Glöckner & Betsch, 2008; Jekel, Glöckner, Bröder &
Maydych, 2014; Lee, 2016) and adolescents (e.g., van Duijvenvoorde,
Jansen, Visser & Huizenga, 2010) and have significantly advanced our
understanding of strategy application in adults. For children, however,
empirical evidence is scarce. In most studies using an
information-board, classification of strategies rarely reached the
standards of research on adults (but see Mata, Helversen & Rieskamp,
2011). In this paper, we apply the outcome-based classification method
to preschoolers and compare their performance with third-graders and
adults in order to gain insight into the development of strategy
application in a probabilistic, multi-dimensional environment.
Specifically, we focus on the application of a weighted-additive (WADD)
strategy that uses probabilities as weights for values.
1.1 Strategies
Subjective expected utility theory (Edwards, 1954) implies that actors
should choose the option with the highest expected utility. Accordingly,
for each outcome of an option, the decision maker assesses its subjective
value and subjective probability of occurrence. Then, each value is
weighted by its probability. Those products are then summed over all
outcome dimensions to determine the expected utility for a particular
option. The option with the highest expected utility is then chosen. The
manner in which information is integrated can be described by a so-called
weighted-additive rule (WADD, Payne et al., 1988).1 WADD is one of the
most complex decision making strategies (Shah & Oppenheimer, 2008) because
it is responsive to the relative importance of outcomes (via weighting) and
considers all available information (adding all value-probability
products). It underlies the integration rule in the utility maximization
approach in economic theory (e.g., von Neumann & Morgenstern, 1947). As
such, it is part of an approach that is considered a normative model
(Simon, 1983). Consequently, WADD has often been used as a comparison
standard in early process tracing studies and modelling of adaptive
decision making (Payne, Bettmann & Johnson, 1993).
It is important to note, however, that WADD, as a rule for information
search and integration, is not the rational or normative benchmark per
se. There are other rules rooted in probability theory that also allow
individuals to improve or even optimize decision accuracy. Naïve Bayes, for
example, also takes the relative importance of all outcomes into
account. In contrast to WADD, naïve Bayes transforms probabilities of
outcomes into log-odds. For each option, the model then sums the log-odds
of outcomes that support the option. The model finally chooses the option
with the highest sum of log-odds. Naïve Bayes is the optimal solution when
options are equally likely a-priori and cues are conditionally independent.
However, due to the complex transformations of the outcome probabilities
required, naïve Bayes is likely not a psychologically plausible model of
human decision making. Still, proxy models may exist that closely mimic
naïve Bayes (e.g., Jekel, Glöckner, Fiedler & Bröder, 2012; Lee &
Cummins, 2004).
A simpler way to reach a decision is to apply an equal-weight rule (EQW,
Payne et al., 1988), which does not require the weighting of outcomes
because it ignores probabilities. Formally, this can be expressed by
setting weights equal to one. Outcome values are summed for each
option; and the option with highest sum is chosen. Lexicographic
strategies (LEX, Fishburn, 1974; see also the take-the-best strategy,
e.g., Gigerenzer, 2004) ignore portions of the outcome information and
do not require integration (weighting, adding). A LEX user begins by
inspecting the most important attribute dimension. In a probabilistic
environment, the rank order of the dimensions follows their
probability. Accordingly, the most likely outcome values are compared
first. The option with the highest value on that probability dimension
is then chosen. Only in the case of ties does the individual inspect
outcomes on the subordinate probability dimension. In this research, we
focus on WADD but also assess a number of other strategies such as EQW,
LEX, and naïve Bayes (NB). Moreover, we include some lower benchmark
strategies in the classification such as guessing and a saturated model
(Hilbig, 2011) that allows for testing whether none of the other models
in the set can best describe participants’ choices. The saturated model
allows us to detect systematic decision making that is not captured by
one of the other models.
1.2 How the environment affects strategy use
In the 1970s (e.g., Payne, 1976), psychologists began to study how the
environment and features of the decision task influence the way in which
individuals make decisions. To date, a large body of evidence indicates
that (adult) humans are adaptive decision makers, i.e., they tune
information search and processing to context demands. For the purpose of
this research, it is sufficient to briefly discuss two factors – weight
structure and feedback in the environment. Both factors are of paramount
importance in terms of understanding context-contingent decision making
(e.g., Payne et al., 1993).
In probabilistic environments, weights are represented by the probabilities
of outcomes or the validity of cues. Cues, for instance, can be testers
that predict the quality of products (e.g., Glöckner & Betsch, 2008). The
validity represents the probability that the tester makes a correct
prediction (good vs. poor quality) regarding the outcome of an option
(product). In non-probabilistic environments, in which outcomes occur with
certainty, weights are determined by the decision maker’s goals and
preferences. One attribute of an option (e.g., the color of a bike) may be
more important than another (e.g., whether the bike has a bell). (Klayman,
1985, studied such a task in children.)
Decision tasks differ with respect to the dispersion of weights. If
dispersion is high, weights differ relatively strongly. If dispersion
is low, weights tend to converge. Weight dispersion has important
implications for the selection of strategies. If dispersion is low,
outcomes of an option can compensate for each other. In such a
compensatory environment with low weight dispersion, individuals should
use a compensatory strategy such as WADD that considers all relevant
information. We will illustrate this briefly with the following
example. Assume that an individual decides between two options. There
are three cues that predict the outcomes of the options. The three cues
differ with regard to their validity (p = .71; .71; .86), i.e., the
probability that they predict outcomes correctly. Dispersion of these
validities is low; thus, “low”-validity cues (p = .71) can compensate
for the “high”-validity cue (p = .86). Compensation becomes evident if
one reflects the arithmetic underlying the WADD rule. Assume, for
example, that the high-validity cue predicts an outcome value 1 for
option A and an outcome value 0 for option B. Assume also that the two
low-validity cues jointly predict the opposite (0 for A, 1 for B).
Applying WADD, we can calculate the overall expected values (EV) for
the options as follows:
-
- Option A: EV = 0 + 0 + 1 × 0.86 = 0.86
- Option B: EV = 1 × 0.71 + 1 × 0.71 + 0 = 1.42
Due to its higher expected value, a WADD-user should choose Option B in
this example, because the low-validity cues together compensate for the
prediction of the high-validity cue.
It is not generally necessary to use WADD to achieve high decision
accuracy. For instance, in an environment in which the dispersion of
probabilities is so high that the low-validity cues cannot compensate
for the predictions of a high-validity cue, even simple rules such as
focusing on only the high-validity cue (i.e., LEX) can yield ideal
results (Payne et al., 1988; see also Gigerenzer & Gaissmaier, 2011).
Another important factor is the presence and structure of feedback.
Feedback, i.e., the actual outcome experienced after choosing an
option, may reinforce choice options (Betsch & Haberstroh, 2005;
Betsch et al., 2001), information search strategies, and one’s ultimate
choice (Bröder & Schiffer, 2006; Rieskamp & Otto, 2006) or even all
three (Bröder et al., 2013). Results show that adult decision makers
(e.g., Rieskamp & Otto, 2006) and older children (Mata et al., 2011)
are sensitive to feedback and can be trained to routinely apply a
certain strategy contingent upon the reinforcement schedule.
In this research, we used a compensatory environment (fostering use of
WADD) and additionally reinforced WADD application by using feedback.
1.3 WADD application in children
In general, WADD describes a rule for information integration. On the
formal side, the arithmetic equivalents are multiplication and
addition. According to folk wisdom and empirical evidence, mental
arithmetic is exhausting. Its mastery requires years of school education
and practice. Unfortunately, some individuals continue to have difficulties
with arithmetic throughout adulthood. Thus, the backbone position of the
bounded rationality approach appears to be a truism, assuming that the
application of WADD requires working knowledge of arithmetic. Especially
when the amount of relevant information is large, WADD could overtax our
thinking abilities. Due to such limitations, decision makers are assumed to
instead apply simple strategies that reduce or even avoid such effortful
integration of information (Gigerenzer & Gaissmaier, 2011; Shah &
Oppenheimer, 2008). From the viewpoint of bounded rationality, it seems
rather odd to expect young children to apply WADD because they suffer from
cognitive constraints (e.g., age dependent limitations of working memory,
Cowan, 2016) and lack pertinent formal knowledge (Piaget & Inhelder, 1951)
that motivate them to weight values with probabilities.
Acknowledging findings from other fields of cognition, however, we face
a strikingly different notion. Research on, for instance, spatial
perception (e.g., Cheng, Shettleworth, Huttenlocher & Rieser, 2007),
categorization of biological motion (Troje, 2002), understanding irony
(e.g., Gibbs & Colston, 2007), implicit attitude formation (Betsch,
Plessner, Schwieren & Gütig, 2001), and intuitive decision making
(Betsch & Glöckner, 2010) provide evidence that the human mind is
capable of performing integration and weighting operations without
noticeable effort in an astoundingly narrow time frame (see Betsch,
Ritter, Lang & Lindow, 2016, for an overview).
Several developmental studies provide additional support for this
notion. For instance, Streri, Coulon and Guellaï (2012) reviewed
evidence from studies on face-voice integration in infants and
concluded that integration abilities are already developed at birth.
Ebersbach (2009) investigated whether children are able to combine
width, height, and length when estimating the volume of objects and
found that even five- to six-year-olds were able to integrate these
dimensions in a multiplicative-like fashion. Schlottmann (2001) studied
evaluative judgments in four- to six-year-old children and showed that
children integrate probability and value in accordance with WADD.
Finally, in a multidimensional, non-probabilistic decision task,
Lindow, Lang and Betsch (2017) demonstrated that the majority of
children (6–12 years old) applied a WADD rule for information
integration. Notably, the prevalence of WADD use appears to decrease
with age. Younger children (around 9 years) are more likely to apply
complex integrative rules than older children (up to 17 years), who in
turn begin to apply simpler rules and heuristics (Jansen, van
Duijvenvoorde & Huizenga, 2012; Mata, et al., 2011).
Yet, this is only half the story. In a non-probabilistic task,
Bereby-Meyer, Assor and Katz (2004) showed that even 8–9 year olds
preferred simple strategies (such as lexicographic rules) over more
demanding ones. In a series of studies with a probabilistic inference task,
Betsch and colleagues (Betsch et al., 2014, 2016) found that the majority
of children under the age of ten were reluctant to use probabilities as
weights in their decisions as required by the WADD rule. Preschoolers, in
particular, tended to apply maladaptive strategies such as arbitrary
switching between options and change after failure (Lang & Betsch,
2018). As a caveat, the environment employed by Betsch and colleagues did
not encourage the application of WADD. The dispersion of weights was large
and, hence, yielded a non-compensatory environment. Feedback reinforced not
specific strategies but rather the validity of the cues (Betsch et al.,
2014). Moreover, the design of the pay-off structure did not allow the
authors to classify strategies on a level comparable to those regularly
reached in decision studies with adults.
1.4 Research goal and hypothesis
As a crucial test for children’s capability to apply a WADD rule, we
thus studied their decisions in a compensatory probabilistic
environment in which WADD use was reinforced by the feedback
distribution structure. In doing so, we applied strategy classification
methods from adult research to a young age group (preschoolers) in a
probabilistic environment. Our research goal was to obtain insights
into the development of WADD application in children (5–6 y.; 9–10 y.)
as compared to an adult control group.
It is necessary at this point to briefly discuss some aspects of our
method. We applied an open information board in which all pieces of
information can be inspected directly and remain visible until the
participant has reached a decision (a so-called open board, Glöckner &
Betsch, 2008). Accordingly, individuals do not have to store
information in memory. Otherwise, children’s memory capacities would
likely have been overtaxed – a condition that obstructs the use of
complex strategies such as WADD. Moreover, there are no time
constraints. Participants are free to ponder their decisions as long as
they wish. Hence, the decision environment in our study is (i)
compensatory (low dispersion of probabilities), (ii) reinforces WADD,
and (iii) is characterized by the absence of external constraints.
According to models of adaptive decision making and strategy use, these
are conditions that, together, increase the likelihood that (adult)
decision makers will apply compensatory strategies that rely on
multiple information and utilize probabilities as decision weights
(e.g., the model of adaptive decision making, Payne et al., 1993; and
Shah & Oppenheimer, 2008, for a discussion). WADD is not the only
strategy that uses probabilities and aggregates information in a
compensatory fashion. Naïve Bayes, for example, fulfills the same
criteria and was also considered in our strategy classification
approach. For simplicity, however, we predicted that WADD should be the
dominant strategy applied by decision makers. This assumption
represents the theoretically derived hypothesis that we tested in this
research.
Due to mixed prior evidence, we can only speculate regarding the
development of WADD use to date. Referring to the bounded rationality
approach and Piaget’s model of cognitive development (Piaget & Inhelder,
1951), one may expect that the younger children are, the more they lack the
computational abilities and conceptual prerequisites (e.g., a concept of
chance and probability) necessary to perform WADD. Cognitive theories on
information integration (e.g., Betsch et al., 2016, for an overview) and
post-Piagetian developmental research (e.g., Schlottmann & Wilkening,
2012), however, jointly suggest that children, from an early age, have the
ability to intuitively integrate information in a weighted-additive
fashion. To our knowledge, it is not possible to come up with clear,
theoretically derived predictions on the development of WADD use based on
the literature to date. Therefore, we consider our research to be
exploratory regarding the question of the age at which children begin to
systematically use WADD in an environment that fosters its application.
2 Method
2.1 Participants
Children (German native speakers) were recruited at one elementary
school and nine daycare centers, located in middle-class areas, which had
previously signed contracts with the university agreeing to participate
in research. Parents signed informed consent forms prior to our approaching
the children. Adults were students with different majors at the
University of Erfurt who were sampled from our lab subject pool via
ORSEE (Greiner, 2004).2 The study lasted
approximately 45 minutes including the breaks between the different
blocks.
The sample consisted of 44 preschoolers (61.4% female; Mage = 68.5 months,
SD = 2.3), 39 elementary schoolers (53.8% female; Mage = 112.1, SD = 8.0),
and 31 adults (87.1% female, Mage = 271.7 months, SD = 34.3). Five
participants did not pass the manipulation check (i.e., they rated one of
the low validity cues to be smarter than the high validity cue after the
learning session). Following prior procedures (e.g., Betsch et al., 2014),
they were excluded from further analyses. One additional participant was
excluded from further analyses due to not following instructions. The final
sample (n = 108) included 39 preschoolers (66.7% female; Mage = 68.6, SD =
2.2), 38 elementary schoolers (52.6% female; Mage = 112.3, SD = 8.1), and
31 adults (87.1% female; Mage = 271.7, SD = 34.3).
2.2 Information board approach
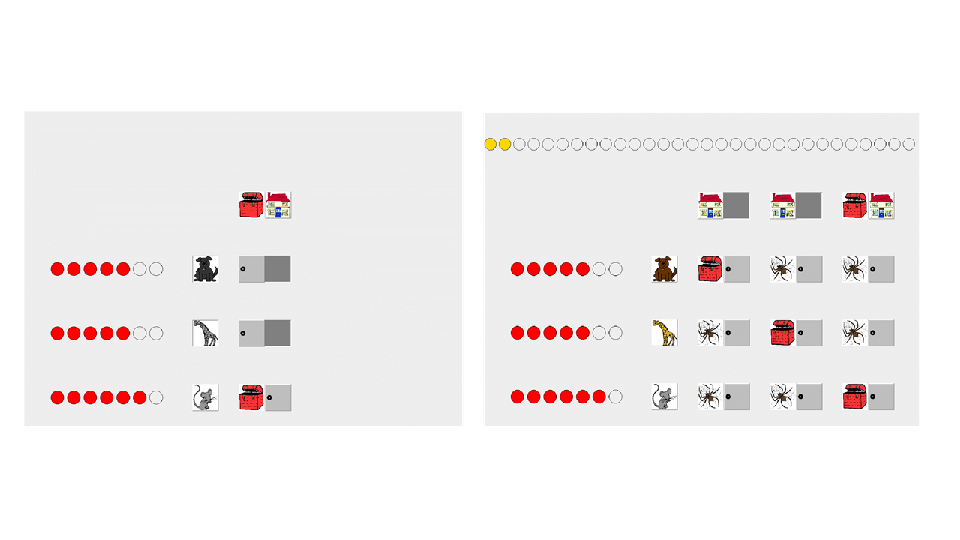
| Figure 1: Mousekids. The screenshot on the left shows the last trial of the
learning session after all smart circles had been assigned to the
animals. An animal received a smart circle if it made a correct
prediction. Numbers of smart circles represent cue validities. In the
example, the last cue’s prediction was correct because the predicted
outcome (treasure) was actually contained in the house above. The
screenshot on the right shows one trial from the test session with
prediction pattern 4 (Figure 2). In this example, the participant has
chosen the third option by opening the door of the house on the right at
the top row, which contained a treasure as predicted by the high validity
cue (horse, p = .86). |
Since the introduction of the “Mouselab” to decision research (Payne et
al., 1988), information boards have become the standard tool in adult
research to study strategies of information search and decision making.
In child decision research, information boards were most frequently
applied in the domain of multi-attribute decisions under certainty
(i.e., non-probabilistic). In such multi-attribute decisions, the
options (e.g., bicycles; Klayman, 1985) are described on different
attributes (e.g., color). Attribute weights vary with regard to their
subjective importance. The majority of these studies assessed general
tendencies in search behavior (e.g., attention, search focus, amount of
information considered) and do not classify specific strategies (Avond,
1997; Ball, Mann & Stamm, 1994; Davidson, 1991a, 1991b, 1996;
Davidson & Hudson, 1988; Gregan-Paxton & Roedder-John, 1995, 1997;
Howse, Best & Stone, 2003; Klayman, 1985; but see Lindow, Lang &
Betsch, 2017, for a strategy classification approach). Note that, in all
these studies, tasks were non-probabilistic, i.e., the outcomes of the
options on the multiple attribute dimensions always occurred with
certainty.
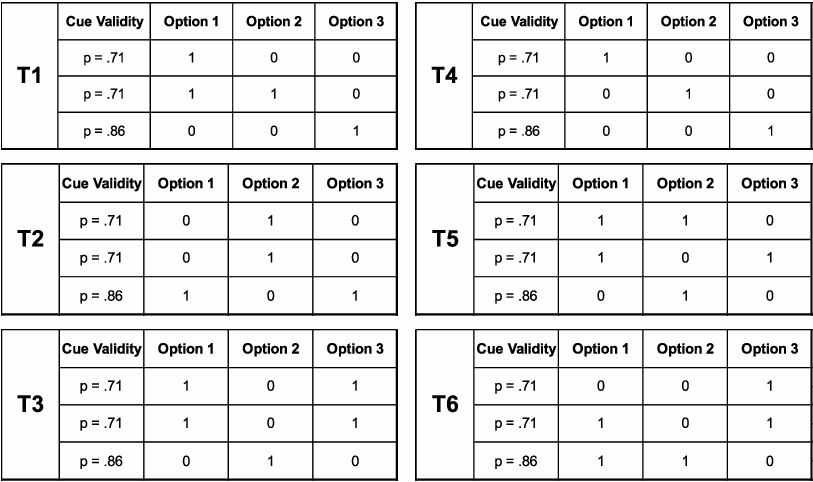
| Figure 2: The six types of prediction patterns used in the decision trials
of the study. Rows contain the predictions of the three cues differing in
cue validity (p = .71; .71; .86). Each cue makes outcome predictions
(1 = treasure; 0 = spider) for the three options depicted at the top of
each column. |
In contrast, we present our participants with a probabilistic
environment. Compared to research with adults, information board
studies with probabilistic environments are rare in child research
(Betsch et al., 2013; 2014; 2016; Lang & Betsch, 2018; Mata et al.,
2011). “Mousekids”, the tool, which we describe next, is structurally
equivalent to information boards from adult research on probabilistic
inference (e.g., Bröder, 2003; Glöckner & Betsch, 2008; Newell &
Shanks, 2003). Specifically, cues make binary predictions of the
outcome of the options. The cues differ with regard to their validity,
i.e., the probability that their predictions are correct. For example,
Glöckner and Betsch (2008) presented participants with a task in which
products (options) were described by testers (cues) which differed with
regard to the probability (validity) that they predicted the quality of
the product correctly.
2.3 Mousekids
Mousekids (Figure 1) is a computerized research tool for studying
multiple-cue decision making in a child-friendly probabilistic
environment (Betsch et al., 2016). There is open access to the software
package online.3
Mousekids is an analog of the Treasure Hunt Game, a non-computerized
information board used to study probabilistic inference decisions in
children (Betsch & Lang, 2013; Betsch et al., 2014). In this study, we
apply an open-board version of the tool. In an open board, all
information contained in the matrix is visible right from the start of
each decision trial. Compared to closed boards, which require the
sequential opening of the cells in the matrix, open boards foster
exhaustive consideration and integration of all given information
(Glöckner & Betsch, 2008). Accordingly, an open board should
facilitate application of WADD, especially in children.
A Mousekid session consisted of two parts – learning and testing. In the
test session (Figure 1), participants repeatedly chose between three houses
(options) containing either a treasure or a spider. For each chosen house
covering a treasure, participants received a treasure point. The goal of
the game was to collect as many treasure points as possible. Participants
based their decisions on the predictions of the animals representing the
cues. The animals gave binary predictions: treasure or spider. The validity
of each cue was depicted by a series of circles next to the picture of the
animal. The relative number of circles equaled the validity of the cue. The
animals in the top two rows scored five of seven circles, so that their cue
validity was p = .71. The score of the animal in the bottom row was six,
i.e., this cue’s validity was p = .86.
Prior to testing, participants were trained on cues’ validities in a
learning session (left part of Figure 1). This session comprised
seven learning trials per cue. In each trial, the animal predicted the
content of the house (treasure vs. spider). Participants
opened the house by touching the screen and then inspected its content. If
the animal had predicted the content correctly, the participant assigned a
“smart circle” (“Schlaupunkt” in the German instructions) to the
animal by touching a blank circle, which then turned red on the computer
screen. The number of colored circles was said to indicate “how smart” an
animal was in terms of making correct predictions.
Prior to the learning session, the participant selected three out of a
pool of eight animals (cat, dog, elephant, giraffe, lion, hippo, horse,
mouse). The animal selected first was then placed in the top row of the
board, the second in the middle, and the third in the bottom row. The
animal in the bottom row always had the highest cue validity. The
location of the animals was determined to prevent the confounding
effects of liking and reading habits (see Betsch et al., 2014, for a
discussion).
In the test session, participants worked on 80 target trials (in addition
to three practice trials at the beginning). Target trials presented
variations of six types (T1–6) of prediction patterns (Figure 2) designed
to apply outcome-based measures of strategy classification. The systematic
application of each strategy under consideration (WADD, EQW, LEX, NB, and
benchmark models) predicts a unique distribution of choices across these
patterns. For example, in T1 an individual would choose O1 if applying WADD
(Expected Value O1 = 1 × 0.71 + 1 × 0.71 + 0 = 1.42; EV
O2 = 0 + 1 × 0.86 + 0 = 0.86; EV O3 = 0 + 0 + 1 × 0.86 =
0.86), and O3 if applying LEX (i.e., following the predictions of the cue
with the highest validity). An equal weight (EQW) rule neglects the
validities of the cues and chooses the option with the highest sum of
positive predictions. In T1, results of WADD and EQW application
converge. A user of EQW would also choose O1 because two cues jointly
suggest this choice, whereas only a single cue suggests choice of one of
the other options. For naïve Bayes, the log-Odds for O3 (i.e., log(.86/.14)
= 1.82) is higher than the sum of log-Odds for O1 (i.e.,
2 × log(.71/.29) = 1.79) and the log-Odds for O2 (i.e.,
log(.71/.29) = 0.90). There is also the possibility that application of a
strategy yields ties. E.g., in T3, WADD and EQW suggest choice of O1 or
O3. In such types of patterns, application of WADD or EQW should result in
an even distribution of choices over O1 and O3. Table 1 shows, as examples,
choices expected for WADD, LEX, EQW, and NB over the six types of
prediction patterns.
| Table 1: Choices over the six types of prediction patterns for
fourexample strategies. |
| | T1 | T2 | T3 | T4 | T5 | T6 |
| WADD | 1 | 2 | 1 or 3 | 3 | 2 | 1 |
| LEX | 3 | 1 or 3 | 2 | 3 | 2 | 1 or 2 |
| EQW | 1 | 2 | 1 or 3 | 1 or 2 or 3 | 1 or 2 | 1 or 3 |
| NB | 3 | 1 or 3 | 2 | 3 | 2 | 1 |
| Note: WADD = weighted additive, LEX = lexicographic, EQW = equal weight,
NB = naïve Bayes. T1 to T6: Types of prediction patterns (Figure
2). Cell entries indicate predicted choices of option 1,2 or 3 in
Figure 2. |
The classification method, described in
Appendix A,
compared expected and observed choices to determine the posterior
probability that the data was produced by an individual using a certain
strategy. Each pattern was shown in three variants, so that each of the
options was favored by the predictions equally often. The type of patterns
and their variants were parallelized over blocks of trials and positions,
so that each occurred four or five times in each block in counterbalanced
positions. Moreover, we ensured that none of the patterns or their
variations occurred in two successive trials. None of the patterns were
used for the three non-target trials at the beginning of the test
session. These free-shot trials used patterns in which cues made joint
predictions – for example, all cues predicted that option 1 hides the
treasure.
Just as in recent research applying the Mousekid tool (e.g., Betsch et
al., 2016; Lang & Betsch, 2018), individuals received feedback after
each choice. Specifically, they opened the chosen house by touching its
symbol on the screen, after which either a treasure or a spider
appeared. Importantly, and in contrast to the prior studies, we
reinforced strategies instead of cues. Specifically, the structure of
the feedback was designed to reinforce the application of WADD in order
to provide ideal conditions for the use of this rule. Strategy
reinforcement through feedback is a technique that is widely used in
adult research on adaptive decision making (e.g. Rieskamp & Otto,
2006; Bröder & Schiffer, 2006) but rarely in research on child
decision making (but see Mata et al., 2011). Due to arithmetic
constraints, it is not possible to reinforce a strategy and, at the
same time, ideally maintain the described validity of the cues in the
feedback distribution. We only briefly illustrate this problem in an
example with prediction pattern Type 1. First assume that feedback
would reinforce the validities of cues. Accordingly, the participant
should actually find a treasure (the outcome referred to by “1” in
Figure 2) in 86% of her O3 choices. This is what happened in prior
studies (e.g., Betsch et al., 2014, 2016). In the present research,
however, we wish to strongly reinforce WADD application. In T1, WADD
application should result in O1 choices. Accordingly, the O1 choices
should yield treasures more often than choices of the other options.
Thus, dominantly reinforcing WADD entails that the
reinforcement rate of the cues will diverge from their absolute initial
validity.
In our case, we structured the feedback to reach a reinforcement rate of
90% for WADD, 73% for LEX, 65% for EQW. This reinforcement of
WADD entails a decrease in the absolute validity of the cues in
experienced feedback. Nevertheless, we made sure that relative
validity, i.e. the rank order of the cues’ validity, was reproduced.
Over the entire set of 80 test trials, the validity of the cues in the
feedback was p = .59 for the first and the second cue and p = .66 for
the third, high validity cue. We ensured that the described validity of
the cues learned by participants in the learning session was visually
present in the form of smart circles next to the cues in each decision
trial (Figure 1).
2.4 Procedure for children
The experimenter met the child at his or her primary school or daycare
center. Both sat down next to each other at a table in front of a touch
screen monitor (19”) connected to an IBM compatible laptop in a
separate, quiet room. The experimenter first explained that the purpose
of the game is to find treasures, and then stated: “But you don’t have
to find the treasures on your own; somebody will be helping you. Look,
do you see the animals on the screen? You are allowed to choose three
of them to help you find the treasures. Now, please choose three
animals that you would like to play the game with. To do so, tap the
chosen animal on the screen and then you tap the grey box.” The
experimenter supervised the child in the operation of the touchscreen
computer throughout the session.
After choosing the animals, the experimenter continued with the learning
session and told the child: “Now I will explain to you how we can find
out how smart the animals are. Do you see the house up there? Maybe
there is a treasure in the house and maybe not. The animals will tell
you whether there is a treasure hidden there or not. But the animals
are not always right. Therefore, we are going to check how often they
are right.”
Following these instructions, the experimenter began the 21 learning
trials with the animal at the top. In each trial, the child opened the
box next to the animal’s picture by sliding the box to the right with
their finger. A picture of either a treasure or a spider was visible
behind the box. The child then opened the door to the house in the same
manner to determine whether the prediction of the cue was correct. If
this was the case (i.e., the animal said “spider”; and the house
actually contained a spider), the child was instructed to bestow a
smart circle to the animal by tapping one of the circles in the row to
the left of the animal. By doing so, the touched circle on the screen
turned red. After seven trials, the experimenter pointed out the number
of smart circles gained by the animal (e.g., 5 out of 7, if p = .71)
and continued to the next animal. After having finished the learning
session with all three animals, the child was asked which of the
animals is the smartest. This question served as the manipulation check
for learning the cue validities.
Then, the experimenter proceeded to the next screen, which depicted the
test session board and explained the goal of the game (find as many
treasures as possible), pay-offs (one house contains a treasure), and
actions (coloring treasure points after success). During three warm-up
trials, which did not count toward a participant’s overall performance,
the experimenter verbalized the prediction of the animals in different
order and checked whether the child understood the board. After the
child had inspected the animals’ predictions, the experimenter asked
the child to make a choice (i.e., by opening one house at the top of
the board). If the chosen house contained a treasure, the experimenter
said: “Oh great, you got a treasure point. Now, you can tap one circle
at the top of the screen to award yourself the treasure point.” If the
house contained a spider, she said: “Ugh, a spider. Well, let’s see
whether you find a treasure next time.”
The test session comprised four blocks of trials consisting of 20 trials
each (80 trials total). Breaks between blocks, in which children were
allowed to have a drink of juice, lasted 4-min each. During the break
following the 40th trial, the experimenter engaged the child in a
motoric game. After the break, the child was reminded of the game’s
goal, i.e., to find as many treasures as possible, and that animals’
predictions should be considered before making a choice. In addition,
the child was again asked to state how many smart circles were assigned
to each animal.
After completing the 80th trial, the experimenter commended the child
for “earning so many treasure points,” irrespective of the actual
yield. The child then received a personalized certificate depicting
their performance on the treasure hunt game as a reward.
2.5 Procedure for adults
As in prior studies (Betsch et al., 2014; 2016), all procedures and
instructions were identical across age groups with two exceptions.
First, we told adult participants that they served as a control group
to children who participated in the same game. Second, the breaks
between the blocks of trails in the test session did not involve
motoric games. Instead, adults were asked to walk through the room to
pick up an object from another table. Adults’ payment was contingent
upon performance (number of treasures found) and resulted in an average
payment of 4 Euros.
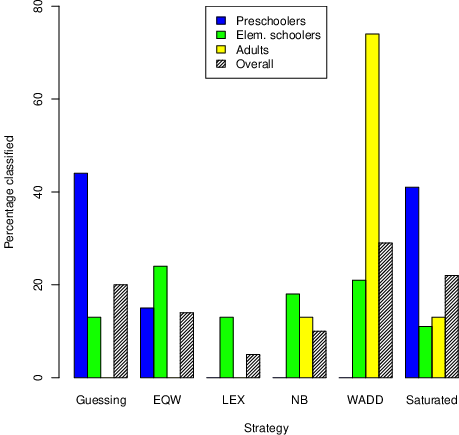
| Figure 3: Percentage of participants classified by strategy for each age
group (i.e., preschoolers, elementary schoolers, and adults) according to
a Bayesian outcome-based strategy classification (Lee, 2016). Guess =
guessing, EQW = equal weight, LEX = lexicographic strategy, NB = naïve
Bayes, WADD = weighted addititive, Saturated = saturated model. For
details on posterior probabilities of classifications, see
Appendix C. |
3 Results
We applied a Bayesian outcome-based strategy classification method (Lee,
2016) to classify the decision strategy of each participant individually (
Appendix
A).4 This outcome-based classification method
compares choice-predictions of strategies (WADD, EQW, LEX, NB, Guessing,
and Saturated) for each pattern type (Figure 2) to individuals’ observed
choices. An individual is classified as a user of a certain strategy if the
posterior probability that his/her choices accord with that particular
strategy exceeds the posteriors for the other strategies – with the
restriction that the total error likelihood of the parameter priors (i.e.,
the likelihood of choosing one of the two options not predicted by the
strategy) is not greater than .33. Note that this restriction requires the
individual to be quite systematic in the application of only one
strategy. The likelihood that an individual will be sorted into the
‘unclassified’ (i.e., saturated model) or ‘guessing’ category increases
with the number of errors in strategy application, switches between
multiple strategies, and choices that follow a strategy that is not
considered in classification.
According to models of adaptive decision making, we hypothesized that a
compensatory strategy such as WADD should be the dominant strategy in our
compensatory environment.5 In support of this
hypothesis, 74% of adults are classified as WADD users. Moreover, 13%
of adults could be classified as NB users, which is also a compensatory
strategy (Figure 3). For preschoolers, the hypothesis is clearly not
supported: Not a single preschooler used WADD or NB systematically. For
elementary schoolers, 39% are classified either as WADD users (21%) or NB
users (18%). Thus, the use of a compensatory strategy that is sensitive to
validities increases with age group. Thirteen percent of elementary
schoolers are classified as users of the non-compensatory LEX
strategy. Although LEX is sensitive to probabilities (because it
prioritizes cues according to their validity), LEX is a maladaptive
strategy in our compensatory environment.
Many preschoolers (44%) guess between options. A high percentage of
preschoolers (41%) can be best described by a saturated model, which
indicates that those children use one or several strategies that were
not included in the model comparison (see Lang & Betsch, 2018, for a
classification of non-adaptive strategies that preschoolers tend to
use). An additional detailed analysis shows that 31% of those
preschoolers can be described by an equal weight model that considers
the position of the information on the screen (see
Appendix B for
details). Altogether, these results show that adults dominantly apply
an appropriate compensatory strategy that is sensitive to validities
(WADD or NB) in a compensatory environment, whereas young children
below the age of seven and 61% of the older children fail to do so. We
provide more detailed descriptive statistics on the posterior
probabilities for strategy-classifications and posterior distributions
of the probability of an application error in strategy use in
Appendix C.
A competent decision maker is capable of using probabilities as decision
weights. Post-Piagetian developmental research suggests that the
utilization of probabilities begins at an early age. In the present
study, however, no preschoolers could be classified as users of a
probability sensitive strategy (WADD, LEX or NB). Notably, 52% of our
9-10 year old elementary schoolers systematically used a probability
sensitive strategy (LEX:13%; WADD: 21%; NB: 18%). This is the
highest portion we ever found in studies with the Mousekids tool (e.g.,
approximately 30% of individuals who followed the high validity cue,
e.g., Betsch et al., 2016).
Another important observation refers to children’s capability of
integrating information from multiple sources. Even when probabilities
are neglected, children may base their decision on the entire set of
predictions available in the information board, for instance, by
applying an EQW rule. Although 35% of all children are classified as
EQW users, only 18% of preschoolers are classified as such. Notably,
EQW is the only systematic strategy detected in preschoolers in this
study. It is still possible that preschoolers used other strategies in
a systematic fashion. Lang & Betsch (2018) and Betsch and colleagues
(2018) identified a number of such strategies – however, they were all
maladaptive from a normative perspective (e.g., switching among
options, change after failure, etc.) and were, therefore, not
considered in this study. In comparison to prior studies with the
Mousekids tool, we extended the number of trials from less than 30
(e.g., Betsch et al., 2016) to 80 in order to increase the reliability
of the classification procedure. Thus, one may argue that decision
accuracy might have decreased over trials in children, and the youngest
age group in particular, due to decreasing motivation over trials.
| Table 2: Accuracy scores (number of treasure points) for each of the
four decision blocks. (Standard deviations are in parentheses.) |
| Block 1 | Block 2 | Block 3 | Block 4 | Overall |
| Preschoolers (n=39) |
| 10.90 | 10.15 | 9.74 | 10.67 | 41.46 |
| (2.26) | (1.86) | (1.76) | (2.16) | (4.13) |
| Elementary schoolers (n=38) |
| 11.92 | 12.58 | 13.00 | 13.61 | 51.11 |
| (2.67) | (3.15) | (3.27) | (2.77) | (9.80) |
| Adults (n=31) |
| 16.39 | 17.06 | 17.35 | 16.77 | 67.58 |
| (2.03) | (2.28) | (1.58) | (2.01) | (6.26) |
| Overall (n=108 |
| 12.83 | 13.0 | 13.07 | 13.45 | 52.35 |
| (3.28) | (3.73) | (3.85) | (3.39) | (12.70) |
As a measure of motivation, we determined accuracy scores (number of
treasure points) for each of the four decision blocks. Inspection of Table
2 reveals that accuracy does not notably decrease over blocks, indicating
that participants did become less motivated across trials.6 Thus, we were justified in using the entire set of choices for
classification.
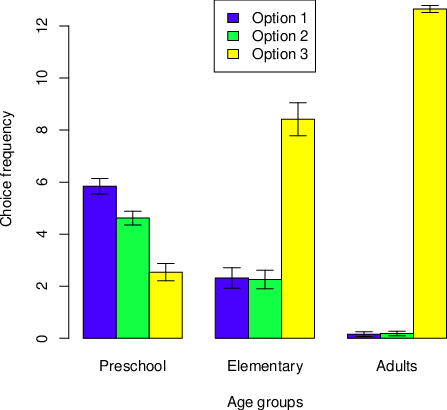
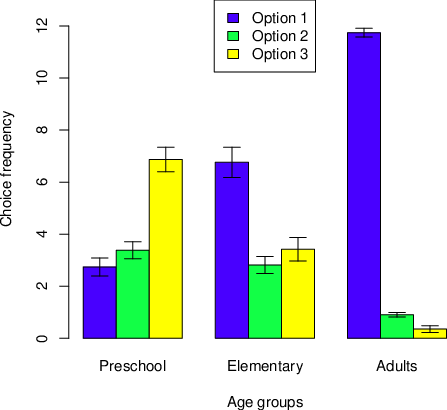
| Figure 4: Choice frequencies in type 4 prediction pattern. Error bars
show 95% CI. |
To further illustrate the striking differences between age groups, we
more closely examined the types of prediction patterns in our task set
separately. In two additional analyses, we focused on patterns T4 and
T6.
T4 is the only pattern in which each cue makes only one positive
prediction and all predictions differ (Figure 2). Thus, this is an
ideal pattern with which to check whether individuals are sensitive to
differences in cue validities. Normatively, a decision maker should
weight predictions or select cues in accordance with the rank order of
cue validities. The high-validity cue predicts a treasure hidden in the
third house (prediction “1” for O3 in Figure 2). Consequently, one
should expect that decision makers choose O3. Figure 4 depicts mean
choice-frequencies separately for each age group. Adults almost always
choose O3. Elementary schoolers less frequently choose O3 compared to
adults; still, O3 is the dominantly preferred choice in this age group.
Preschoolers, however, differ strikingly in their choices. They choose
O3 less frequently than O1 and O2. According to this observation, a GLM
analysis produced a moderately strong age-by-choice interaction effect
(FPillai-Spur (4, 210) = 29.37, p < .01, ηpartial2 = .36).
Moreover, the main effect for the repeated-measurement factor choice
was also strong, reflecting the observation that frequencies of
O1-choices differ markedly between age groups (FPillai-Spur (2, 104) =
98.32, p < .01, ηpartial2 = .65; note that the between
effect for age cannot be computed because the sum of choice frequencies
is constant.)
T6 (Figure 5) is another interesting candidate for assessing
probabilistic decision making. In contrast to patterns discussed above,
this pattern is quite complex. Some cues make multiple positive
predictions, resulting in ties. Nevertheless, the application of WADD,
NB, and LEX7
will jointly result in O1-choices. An EWQ-rule would result in an even
distribution of O1 and O3 choices. None of the strategies, however,
would lead to a dominance of O2 or O3 choices. Figure 4 displays the
mean frequencies of choices by age groups. Evidently, adults show a
strong preference for O1. O1 is also the dominantly chosen option in
elementary schoolers, although they less frequently choose O1 as
compared to adults. This pattern reverses for preschoolers, who
predominantly choose O3 – a behavioral tendency that is not predicted
by any of the three strategies. In a GLM-ANOVA, these observations
manifest themselves in a strong interaction effect between age and
choice (FPillai-Spur (4, 210) = 28.31, p < .01, ηpartial2 =
.35). Again, the main effect for the repeated-measurement factor
“choice” was also strong (FPillai-Spur (2, 104) = 93.48, p <
.01, ηpartial2 = .64).
| Figure 5: Choice frequencies in in type 6 prediction pattern. Error bars
show 95% CI. |
A high proportion of preschoolers’ choices (41%) did not resemble our
tested models, indicating that we did not hit all potential variants of
strategies (Hilbig, 2011) that might be used by children. A closer
post-hoc inspection of the choices of some preschoolers revealed that
they might have applied a strategy that is sensitive to prediction
patterns in the matrix. We re-ran the Bayesian analysis as described in
Appendix A
with a new strategy (EQW*).
Analyses revealed that differential application of EQW* could account
for choices in approximately 36% of all preschoolers (see
Appendix B
for the more detailed post-hoc explanation). It is possible that
children used other strategies that are not usually considered in the
decision-making literature. Lang and Betsch (2018) found that
preschoolers are able to systematically apply a couple of non-adaptive
strategies (e.g., switching between options). It is surely a promising
line of future research to consider the use of non-adaptive strategies.
This research, however, focuses on WADD application, and, hence we do
not consider such variants further.
4 Discussion
Models of adaptive decision making (e.g., Payne et al., 1993) predict
that the application of linear strategies of information integration
such as the weighted additive rule (WADD) should be most prevalent in
compensatory environments. The absence of constraints that hinder
information acquisition (e.g., time pressure, access costs) and
strategy contingent feedback should further promote WADD application.
To investigate the development of WADD use, we exposed children and
adults to a compensatory, probabilistic decision environment in which
the dispersion of cue validities (i.e., the probabilities that
cue-predictions are correct) was low. Decision time was unconstrained.
An open information board format further encouraged individuals to use
WADD, as all cue predictions could be directly inspected and did not
have be stored in memory before making a decision. Moreover, we
reinforced WADD by feedback. Altogether, these environmental
characteristics set up a task that ideally fosters the application of
WADD.
In support of our hypothesis, the majority of adult participants were
classified as WADD users (74%). In striking contrast to this finding, WADD
was not the dominant strategy in children. No preschoolers (6 y.) and only
21% of the elementary schoolers (9–10 y.) could be classified as users of
the WADD rule. More than half of the elementary schoolers (52%) were
systematically sensitive to differences in probabilities in their decisions
as evidenced by the sum of WADD, NB, and LEX users. In preschoolers,
however, we were unable to identify individuals who based their decisions
on probabilistic information. The only systematic decision behaviour in the
six-year olds in our sample was consistent with an equal weight rule (EQW),
which bases decisions on all prediction values without weighting.8
Why did only so few children apply a WADD rule in our study? One might be
tempted to attribute this finding to global deficits in children, such as
insensitivity to probabilistic information, deficits in learning from
probabilistic outcome distributions (feedback), immature general cognitive
abilities (e.g., IQ, executive functioning), specific cognitive deficits in
applying rules of weighted aggregation of information, or simply a lack of
task comprehension. There is evidence, however, that children reveal a
sensitivity to probabilities from an early age on (e.g., Denison & Xu,
2014). Preschoolers as young as 4 year old are sensitive to probabilistic
outcome distributions (e.g., Pasquini, Corriveau, Koenig & Harris,
2007). In a series of studies, Lehmann and Betsch (2018) did not find
support for the notion that performance in the Mousekids tool covaries with
various measures of cognitive ability (e.g., memory span, executive
functioning, selective attention, etc.). Most research from various areas
of cognition suggests that humans from an early age on are capable of
integrating multiple pieces of information in a linear fashion, as required
by the WADD rule (see Betsch, Ritter, Lang & Lindow, 2016, for an
overview; but see, e.g., Jansen & van der Maas, 2002, for conflicting
evidence). In spatial perception and categorization, for example, children
and even animals (e.g., snails, Gallistel, 1980) are capable of performing
weighted integration procedures “in a near optimal fashion” (Cheng,
Shettleworth, Huttenlocher & Rieser 2007, p. 625). In an evaluative
judgment task, preschoolers (5–6 y.) were able to integrate probabilities
and values in line with the predictions of models involving multiplication
(Schlottmann, 2001) similar to the WADD rule. In other studies using a
paradigm similar to our study, preschoolers could also apply weighting
operations – unfortunately, they did not use probabilities as weights but
rather an experimentally induced “lure” that was irrelevant from a
normative perspective (Betsch & Lang, 2013; Betsch et al., 2014,
Exp. 2). Finally, the possibility that children do not understand the
treasure hunt task in our Mousekid tool has been ruled out by applying
measures of task comprehension (Betsch, Lehmann, Lindow & Buttelmann,
2018). Hence, none of these factors alone provides a plausible account for
the observed reluctance in children to apply a WADD rule.
Deficits in the application of WADD thus presumably originate elsewhere.
In the following, we suggest an explanation that presumes an interaction
between task features, mental representation, and the status of conceptual
knowledge in children. Specifically, we suspect that in our task the
formation of a subjectively meaningful mental representation that properly
reflects the informational structure of the given information is impaired
in children due to their lack of developed explicit conceptions of
probability.
Several features of the stimulus environment can either help or hinder
the formation of representations that foster accuracy in task
performance. In an illuminating paper, Wohlwill (1968) described three
important task dimensions: redundancy, selectivity, and contiguity. We
will briefly illustrate these dimensions using the example of the
marble task – which Schlottmann (2001) used to demonstrate that even
preschoolers can integrate probabilities and values in a
multiplicative-like fashion, as predicted by utility theory.
Redundancy can be conceptualized as the degree of inter-correlation of
cues predicting a criterion. In her marble task, Schlottmann (2001)
visualized the probability and value of outcomes in the following
manner (see also Schlottmann & Wilkening, 2012, p. 62). A marble was
shaken in a tube with two clusters of colored segments (e.g., blue,
yellow). Above each cluster, the potential gain was depicted (crayons).
Value was manipulated by varying the number of crayons above each
cluster (e.g., 6 for blue, 1 for yellow). Probability (e.g., 80%
chance of winning if the marble stops in the blue cluster) was
manipulated by varying the number of segments in a cluster (e.g., 4
segments in the blue, 1 segment in the yellow cluster). In this
particular example, probability representation is redundant. Two cues,
cluster size and the number of segments in the cluster, are correlated.
Thus, these two cues jointly reference probability. Selectivity refers
to the amount of irrelevant information that is contained in the task
and should not affect the response. The graphical presentation in the
marble task contains only relevant information – i.e., the number of
crayons representing value and cluster size/segment number representing
probability. Contiguity refers to the spatial and temporal separation
of relevant information. In the marble task, contiguity between
probability and value is high. The crayons are depicted directly above
the right and left cluster in the tube. The blue and the yellow
clusters represent the two potential outcomes of the task. As such, the
outcomes contain all relevant information in a contiguous arrangement –
values (number of crayons) and probability (size/number of segments).
According to Wohlwill (1968), perceptual tasks are characterized by a
high degree of redundancy and contiguity and a low demand for
selectivity. Individuals can respond to such tasks intuitively without
the need of having formal conceptions and processes properly developed.
The less a task contains such facilitative features (absence of
redundancy, low contiguity, high selectivity), the more the individual
must rely on conception to respond in a coherent manner. Although our
paradigm contains many child-friendly features (e.g., an enjoyable
task, animals as advice givers, learning and graphical presentation of
cue validities, etc.) it is not a purely perceptual task. Most
importantly, the matrix format, typical for all information board
studies, spreads out decision criteria and options and hence decreases
contiguity. Unlike Schlottmann’s marble task, in which options,
outcomes, and probabilities are depicted closely together and function
somewhat as a combined cue, our task sorts options and probabilities
into margins of the board and outcomes into the grid. This presentation
format requires some active structuring to link options, outcomes, and
probabilities together and form an accurate mental representation.
Another feature relates to selectivity. Advice givers (animals) do not
simply make predictions regarding the target outcome (e.g., house A
contains a treasure). Instead, they also make non-focal predictions
(e.g., house B and house C contain a spider). Although the non-focal
information is not irrelevant per-se, it is not necessary to make
correct decisions, although it does increase the informational input. A
more selective environment that depicts only the information necessary
and sufficient for making a decision might enhance the likelihood that
children form accurate representations of the stimulus input.
Analysing our task on Wohlwill’s dimensions gives rise to another
interpretation that is, admittedly, a bit farfetched given the current
state of empirical evidence. Mousekids is not purely a perceptual task.
Thus, it cannot be coherently solved without the help of conception. As
such, deficits in performance (i.e., application of WADD) may allow us
to draw conclusions regarding the state of conception in the children
in our sample. Failing to classify any preschoolers as users of a
probability-sensitive strategy (WADD, NB, LEX) may be taken as evidence
that conceptions of probability and their role as weights in decision
making are insufficiently developed in this age group. In our task,
these conceptions might be necessary to properly encode probabilistic
information and form a meaningful representation that associates
outcome values with weights. The still low percentage of WADD, NB, and
LEX users in nine to ten year-olds indicates that it takes a long time
for these conceptions to be consolidated.
From what age are children capable of adapting to probabilistic
environments? With our discussion above, we aimed at showing that
empirical evidence should take into account the interaction of levels
of cognitive processing and task features. Cognitive ability can be
assessed on different levels. Mastering a perceptual task does not
necessarily imply that the individual is capable of solving a
structurally similar task that lacks the facilitative features fitting
into formats of intuitive processing. Comparing evidence across studies
cannot be achieved by statistical means only as, for instance, by
subjecting data to meta-analysis. Rather, we must analyse tasks and
paradigms on the qualitative level to detect potential origins of
improved or impaired performance. Insights from these analyses should
result in research endeavours that systematically compare and vary
features of our paradigms to determine when decision makers in the
course of their cognitive development overcome what Schlottmann and
Wilkening (2012, p. 77) have nicely termed being “at the mercy of
circumstance”.
Taken together, our research indicates that, before school age, children
fail to apply a WADD rule to a task in which multiple probabilities and
values are presented in a dissociated fashion.
References
Avond, S. V. (1997, April). Children’s
collection and use of predecisional information for social and
nonsocial decisions. Paper presented at the Bienneal Meeting of the
Society for Research in Child Development, Washington, DC.
Ball, C., Mann, L., & Stamm, C. (1994). Decision-making abilities of
intellectually gifted and non-gifted children. Australian
Journal of Psychology, 46, 13–20. https://doi.org/10.1080/00049539408259464.
Bereby-Meyer, Y., Assor, A., & Katz, I. (2004).
Children’s choice strategies: The effects of age and
task demands. Cognitive Development, 19, 127–146.
http://dx.doi.org/10.1080/00049539408259464.
Betsch, T., & Glöckner, A. (2010). Intuition in judgment and decision
making: Extensive thinking without effort.
Psychological Inquiry, 21, 1–16. https://doi.org/10.1080/1047840X.2010.517737.
Betsch, T., & Haberstroh, S. (2005) (Eds.). The routines of
decision making. Mahwah, N.J.: Lawrence Erlbaum.
Betsch, T., Haberstroh, S., Glöckner, A., Haar, T., & Fiedler, K.
(2001). The effects of routine strength on information acquisition and
adaptation in recurrent decision making. Organizational
Behavior and Human Decision Processes, 84, 23–53.
https://doi.org/10.1006/obhd.2000.2916.
Betsch, T., & Lang, A. (2013). Utilization of probabilistic cues in the
presence of irrelevant information - A comparison of risky choice in
children and adults. Journal of Experimental Child
Psychology, 115, 108–125. http://dx.doi.org/10.1016/j.jecp.2012.11.003.
Betsch, T., Lang, A., Lehmann, A., & Axmann, J. M. (2014). Utilizing
probabilities as decision weights in closed and open information
boards: A comparison of children and adults. Acta
Psychologica, 153, 74–86. http://dx.doi.org/10.1016/j.actpsy.2014.09.008.
Betsch, T., Lehmann, A., Lindow, S., Lang, A., & Schoemann, M. (2016).
Lost in search: (Mal-) Adaptation to probabilistic decision
environments in children and adults. Developmental Psychology.
52, 311-325. http://dx.doi.org/10.1037/dev0000077.
Betsch, T., Lehmann, A., Lindow, S., & Buttelmann, D. (2018).
The long way from discriminating probabilities to their
utilization in choice. University of Erfurt: Unpublished data.
Betsch, T., Plessner, H., Schwieren, C., & Gütig, R. (2001). I like it
but I don‘t know why: A value-account approach to implicit attitude
formation. Personality and Social Psychology
Bulletin, 27, 242–253. https://doi.org/10.1177/0146167201272009.
Betsch, T., Ritter, J., Lang, A., & Lindow, S. (2016). Thinking beyond
boundaries. In L. Macchi, M. Bagassi, & R. Viale (Eds.),
Cognitive unconscious and human rationality (pp. 241–255). Cambridge, MA:
MIT Press.
Bröder, A. (2003). Decision making with the “adaptive toolbox”: Influence
of environmental structure, intelligence, and working memory
load. Journal of Experimental Psychology: Learning, Memory, &
Cognition, 29,
611–625. http://dx.doi.org/10.1037/0278-7393.29.4.611.
Bröder, A. (2010). Outcome-based strategy classification. In A. Glöckner
& C. Witteman (Eds.), Foundations for tracing intuition.
Challenges and methods (pp. 61–82), Hove: Psychology Press.
Bröder, A., & Schiffer, S. (2003). Bayesian strategy assessment in
multi-attribute decision making. Journal of Behavioral Decision
Making, 16, 193–213. http://dx.doi.org/10.1002/bdm.442.
Bröder, A. & Schiffer, S. (2006). Adaptive flexibility and maladaptive
routines in selecting fast and frugal decision strategies.
Journal of Experimental Psychology: Learning, Memory, &
Cognition, 32(4), 904–918. http://dx.doi.org/10.1037/0278-7393.32.4.904.
Bröder, A., Glöckner, A., Betsch, T., Link, D., & Ettlin, F. (2013). Do
people learn option or strategy routines in multi-attribute decisions?
The answer depends on subtle factors. Acta Psychologica, 143,
200–209. http://dx.doi.org/10.1016/j.actpsy.2013.03.005.
Cheng, K., Shettleworth, S. J., Huttenlocher, J, & Rieser, J. J.
(2007). Bayesian Integration of Spatial Information.
Psychological Bulletin, 133, 625–637. http://dx.doi.org/10.1.1.458.326.
Cowan, N. (2016). Working memory maturation: Can we get at the essence of
cognitive growth? Perspectives on Psychological Science, 11,
239–264. http://dx.doi.org/10.1177/1745691615621279.
Davidson, D. (1991a). Children’s decision-making examined with an
information-board procedure. Cognitive Development,
6, 77–90. http://dx.doi.org/10.1016/0885-2014(91)90007-Z.
Davidson, D. (1991b). Developmental differences in children’s search of
predecisional information. Journal of Experimental Child
Psychology, 52, 239–255. http://dx.doi.org/10.1016/0022-0965(91)90061-V.
Davidson, D. (1996). The effects of decision characteristics on
children’s selective search of predecisional information. Acta
Psychologica, 92, 263–281. http://dx.doi.org/10.1016/0001-6918(95)00014-3.
Davidson, D., & Hudson, J. (1988). The effects of decision
reversibility and decision importance on children’s decision making.
Journal of Experimental Child Psychology, 46, 35–40.
http://dx.doi.org/10.1016/0022-0965(88)90021-5.
Denison, S., & Xu, F. (2014). The origins of probabilistic reasoning in
human infants. Cognition, 130, 335–347. http://dx.doi.org/10.1016/j.cognition.2013.12.001.
Ebersbach, M. (2009). Achieving a new dimension: Children integrate
three stimulus dimensions in volume estimations. Developmental
Psychology, 45, 877–883. http://dx.doi.org/ 10.1037/a0014616.
Edwards, W. (1954). The theory of decision making. Psychological
Bulletin, 51, 380–417. http://dx.doi.org/10.1037/h0053870.
Fishburn, P. C. (1974). Lexicographic orders, utilities and decision
rules: A survey. Management Science, 20, 1442–1471.
http://dx.doi.org/10.1287/mnsc.20.11.1442.
Gallistel, C. R. (1980). The organization of action: A new
synthesis. Hillsdale, NJ: Lawrence Erlbaum Associates.
Gibbs, R., & Colston, H. (Eds.) (2007). Irony in language and thought:
A cognitive science reader. New York: Erlbaum.
Gigerenzer, G. (2004). Fast and frugal heuristics: The tools of bounded
rationality. In: D. Koehler, & N. Harvey (Eds.), Handbook of
judgment and decision making (pp. 62–88). Oxford, UK: Blackwell.
Gigerenzer, G., & Gaissmaier, W. (2011). Heuristic decision making.
Annual Review of Psychology, 62, 451–482.
http://dx.doi.org/10.1146/annurev-psych-120709-145346.
Glöckner, A. (2009). Investigating intuitive and deliberate processes
statistically: The multiple-measure maximum likelihood strategy
classification method. Judgment and Decision Making, 4,
186–199.
Glöckner, A., & Betsch, T. (2008). Multiple-reason decision making
based on automatic processing. Journal of Experimental
Psychology: Learning, Memory and Cognition, 34, 1055–1075.
http://dx.doi.org/10.1037/0278-7393.34.5.1055.
Glöckner, A., & Witteman, C. L. M. (Eds.). (2010).
Foundations for tracing intuition: Challenges and
methods. London: Psychology Press & Routledge.
Gregan-Paxton, J., & Roedder-John, D. (1995). Are young children
adaptive decision makers? A study of age differences in information
search behavior. Journal of Consumer Research, 21,
567–580. http://dx.doi.org/10.1086/209419.
Gregan-Paxton, J., & Roedder-John, D. (1997). The emergence of adaptive
decision making in children. Journal of Consumer
Research, 24, 43–56. http://dx.doi.org/10.1086/209492.
Greiner, B. (2004). An online recruitment system for economic experiments.
In K. Kremer & V. Macho (Eds.), Forschung und wissenschaftliches
Rechnen 2003, GWDG Bericht 63 [Research and scientific computation 2003,
GWDG Report 63] (pp. 79 –93). Göttingen, Germany: Ges. für Wiss. Datenverarbeitung.
Hilbig, B. E. (2011). Methodological notes on model comparisons and
strategy classification: A falsificationist proposition.
Judgment and Decision Making, 6, 814–820
Howse, R. B., Best, D. L., & Stone, E. R. (2003). Children’s decision
making: The effect of training, reinforcement, and memory aids.
Cognitive Development, 18, 247–268.
http://dx.doi.org/10.1016/S0885-2014(03)00023-6.
Jansen, B. R. J., van Duijvenvoorde, A. C. K., & Huizenga, H. M.
(2012). Development of decision making: Sequential versus integrative
rules. Journal of Experimental Child Psychology, 111,
87–100. http://dx.doi.org/10.1016/j.jecp.2011.07.006.
Jansen, B. R .J., and van der Maas, H. L. J. (2002).The development of
children’s rule use on the balance scale task. Journal of Experimental
Child Psychology, 81, 383-416. https://doi.org/10.1006/jecp.2002.2664.
Jekel, M., & Glöckner, A. (2018). How to identify strategy use and
adaptive strategy selection: The crucial role of chance correction in
weighted compensatory strategies. Journal of Behavioral
Decision Making, 31, 265-279. http://dx.doi.org/ 10.1002/bdm.1983.
Jekel, M., Glöckner, A.,Bröder, A., & Maydych, V. (2014).
Approximating rationality under incomplete information: Adaptive inferences for missing cue values based
on cue-discrimination. Judgment and Decision Making 92, 129-147.
Jekel, M., Glöckner, A., Fiedler, S., & Bröder, A. (2012). The
rationality of different kinds of intuitive decision processes.
Synthese, 189, 147–160. http://dx.doi.org/10.1007/s11229-012-0126-7.
Klayman, J. (1985). Children’s decision strategies and their adaptation
to task characteristics. Organizational Behavior and Human
Decision Processes, 35, 179–201.
http://dx.doi.org/10.1016/0749-5978(85)90034-2.
Kruschke, J. (2014). Doing Bayesian data analysis: A tutorial with R,
JAGS, and Stan. London: Academic Press.
Lang, A., & Betsch, T. (2018). Children’s neglect of probabilities in decision
making with and without feedback. Frontiers in Psychology, 9,
191. http://dx.doi.org/10.3389/fpsyg.2018.00191.
Lindow, S., Lang, A., & Betsch, T.(2017). Holistic information
integration in child decision making. Journal of Behavioral
Decision Making, 30, 1131–1146. http://dx.doi.org/10.1002/bdm.2029.
Lee, M. D. (2016). Bayesian outcome-based strategy classification.
Behavior Research Methods, 48, 29–41. http://dx.doi.org/10.3758/s13428-014-0557-9.
Lee, M. D., & Cummins, T. D. (2004). Evidence accumulation in decision
making: Unifying the “take the best” and the “rational” models.
Psychonomic Bulletin & Review, 11, 343–352. http://dx.doi.org/10.3758/BF03196581.
Lehmann, A., & Betsch, T. (2018). The relation of executive
functions and probabilistic decision making in children. University of
Erfurt: Unpublished raw data.
Mata, R., von Helversen, B., & Rieskamp, J. (2011). When easy comes hard:
The development of adaptive strategy selection. Child Development,
82, 687–700. http://dx.doi.org/10.1111/j.1467-8624.2010.01535.x.
Newell, B. R., & Shanks, D. R. (2003). Take the best or look
at the rest? Factors influencing “one-reason” decision making.
Journal of Experimental Psychology: Learning, Memory and
Cognition, 29,
53–65. http://dx.doi.org/10.1037/0278-7393.29.1.53
Pasquini, E. S., Corriveau, K. H., Koenig, M. A. & Harris, P. L.,
(2007). Preschoolers monitor the relative accuracy of informants.
Developmental Psychology, 43, 1216–1226.
http://dx.doi.org/10.1037/0012-1649.43.5.1216.
Payne, J. W. (1976). Task complexity and contingent processing in
decision making: An information search and protocol analysis.
Organizational Behavior and Human Performance, 16, 366–387.
http://dx.doi.org/10.1016/0030-5073(76)90022-2.
Payne, J. W., Bettman, J. R., & Johnson, E. J. (1988). Adaptive
strategy selection in decision making. Journal of Experimental
Psychology: Learning, Memory, and Cognition, 14, 534–552.
http://dx.doi.org/10.1037//0278-7393.14.3.534.
Payne, J. W., Bettman, J. R., & Johnson, E. J. (1993). The
adaptive decision maker. New York: Cambridge University Press.
Piaget, J., & Inhelder, B. (1951). The origin of the idea of
chance in children. London: Routledge & Kegan Paul.
Plummer, M. (2003). JAGS: A program for analysis of Bayesian graphical
models using Gibbs sampling. In K. Hornik, F. Leisch, & A. Zeileis (Eds.),
Proceedings of the 3rd international workshop on distributed
statistical computing (DSC 2003). Vienna Austria.
http://www.ci.tuwien.ac.at/Conferences/DSC-2003/.
Rieskamp, J. (2018). On narrow norms of rationality and questionable
data analyses: A comment on Jekel and Glöckner. Journal of
Behavioral Decision Making, 31, 280–288. http://dx.doi.org/10.1002/bdm.2016.
Rieskamp, J., & Otto, P. E. (2006). SSL: A theory of how people learn
to select strategies. Journal of Experimental Psychology:
General, 135, 207–236. http://dx.doi.org/10.1037/0096-3445.135.2.207.
Scheibehenne, B., Rieskamp, J., & Wagenmakers, E.-J. (2013). Testing
adaptive toolbox models: A Bayesian hierarchical approach.
Psychological Review, 120, 39–64. http://dx.doi.org/ 10.1037/a0030777.
Schlottmann, A. (2001). Children’s probability
intuitions: Understanding the expected value of complex gambles.
Child Development, 72, 103–122.
http://dx.doi.org/10.1111/1467-8624.00268.
Schlottmann, A., & Wilkening, F. (2012). Judgment and decision making
in young children. In M.K. Dhami, A. Schlottmann & M.R. Waldmann
(Eds.), Judgment and decision making as a skill: Learning,
development and evolution (pp. 55–83). Cambridge: Cambridge University
Press.
Shah, A. K., & Oppenheimer, D. M. (2008). Heuristics made easy: An
effort-reduction framework. Psychological Bulletin,
134, 207–222. http://dx.doi.org/10.1037/0033-2909.134.2.207..
Simon, H. A. (1955). A behavioral model of rational choice.
Quarterly Journal of Economics, 69, 99–118.
A Simon, H.. (1983). Reason in human affairs. Stanford, CA:
Stanford University Press.
Streri, A., Coulon, M., & Guellaï, B. (2012). The foundations of social
cognition: Studies on face/voice integration in newborn
infants. International Journal of Behavioral Development, 37,
79–83. https://doi.org/10.1177/0165025412465361.
Troje, N. F. (2002). Decomposing biological motion: A framework for
analysis and synthesis of human gait patterns. Journal of Vision, 2,
371–387. https://doi.org/10.1167/2.5.2.
Von Neumann, J., & Morgenstern, O. (1947). Theory of games and
economic behavior (2nd ed.). Princeton, NJ: Princeton University
Press.
Van Duijvenvoorde, A. C., Jansen, B. R., Visser, I., & Huizenga, H. M.
(2010). Affective and cognitive decision-making in adolescents.
Developmental Neuropsychology, 35, 539–554. https://doi.org/10.1080/87565641.2010.494749.
Wagenmakers, E.-J. (2007). A practical solution to the pervasive
problems of P-values. Psychonomic Bulletin &
Review, 14, 779–804. http://dx.doi.org/ 10.3758/bf03194105.
Wohlwill, J. F. (1968). From perception to inference: A dimension of
cognitive development. In I. E. Sigel & F. H. Hooper (Eds.),
Logical thinking in children: Research based on Piaget’s
theory (pp. 472–494). New York: Holt, Rinehart and Winston.
This document was translated from LATEX by
HEVEA.