Judgment and Decision Making, Vol. 13, No. 5, September 2018, pp. 484-500
Post-decision search in repeated and variable environmentsKinneret Teodorescu*
Ke Sang#
Peter M. Todd#
|
When faced with a decision, people collect information to help them
decide. Though it may seem unnecessary, people often continue to search
for information about alternatives after they have already chosen an
option, even if this choice is irreversible (e.g., checking out other
cars after just purchasing one). While previous post-decision search
studies focused on “one-shot” decisions and highlighted its irrational
aspects, here we explore the possible benefits of post-decision search
in the long run. We use a simple search task in which participants
repeatedly decide whether to select the current alternative or continue
to search for a better alternative. In a preliminary study we find that
participants indeed conduct post-decision search even in unique
environments, where information about forgone options cannot be used in
future choices. In the main studies exposure to post-decision
information was manipulated directly in unique environments, and was
found to lead to better performance. The source of the observed
improvement was further investigated with an explicit strategy
elicitation methodology. We find that following exposure to
post-decision information, people collect more data before generating
thresholds. Thus, although post-decision search in unique environments
might appear redundant, our results suggest it can help decision makers
to modify their strategy and improve their future choices.
Keywords: post-decision information, search, exploration, secretary problem,
optimal stopping problems, threshold strategies
1 Introduction
Harry and Sally are happily married.1
For many years now, Harry has argued that Sally behaves irrationally
when she continues to search for alternatives after a decision has
already been made. For example, after just filling gas in her car,
Sally still continues to search for lower gas prices at other stations,
and after she already bought a product, she continues to check for
better deals. Harry could understand her conducting such post-decision
search if the decision can be reversed so that she can switch to a
better alternative (e.g., buying the better deal and returning the
previous product with minimal cost). He could also understand her
looking at gas prices when her gas tank is full, because if she finds a
cheaper gas station, she can use this information next time she is out
of gas. However, after they just paid for an expensive and
non-refundable vacation in distant Australia, Harry could not find any
rational justification to explain why Sally continued to search for
alternative vacation deals. In this case, reversing the decision is too
costly and they are not likely to visit Australia again so information
about alternative deals will not help in future decisions.
Existing literature from marketing and social psychology provides some
ideas why Sally might conduct such unfounded post-decision search:
post-decision information reduces uncertainty (e.g., Shani &
Zeelenberg, 2007; Shani, Tykocinski & Zeelenberg, 2008) and can
provide supportive evidence for the decision just made (if one finds
that forgone alternatives are worse than the one selected), which in
turn helps to reduce regret (e.g., Cooke, Meyvis & Schwartz, 2001;
Summerville, 2011) and to resolve cognitive dissonance (Ehrlich,
Guttman, Schönbach & Mills, 1957; Adams, 1961, Donnely & Ivancevich,
1970). Thus, one general motivation to conduct post-decision search is
to lessen undesirable emotions. This motivation is of particular
importance since post-decision information was found to influence
satisfaction and regret even more than pre-decision information (Cooke,
Meyvis & Schwartz, 2001). The problem, however, is that post-decision
information search can also produce negative feedback (if one finds out
that forgone alternatives are better than the one selected), which in
this case will cause increased regret and larger dissonance. While one
might want to avoid such negative emotions, as noted by Zeelenberg
(1999), experiencing regret can be functional when it leads to
increased learning from mistakes. Accordingly, a question arises: Can
post-decision information support generalizable learning that improves
further decision making? If so, then such potential improvement of
future choices can serve as a functional motivation to engage in
post-decision search even in non-repeating environments.
1.1 Two types of useful post-decision information
Post-decision search provides information about the value of unchosen
alternatives (e.g., what would have happened if one had searched
longer). These values can be useful in two ways: externally, by
updating one’s knowledge about the distribution of options in a given
environment (are there better alternatives out there?), and internally,
by giving feedback about one’s search strategy (did I stop searching at
an appropriate point?).2 Such information can improve performance when
future decisions are expected in the same unknown environment. For
example, imagine that Sally just bought a birthday present for Harry,
and her post-decision search then showed she could have gotten a nicer
present for the same price. Sally learned about new possible presents
for a given budget constraint (external distributional knowledge) but
she also learned that she terminated her search too early (internal
strategy feedback). While both types of information can help her buy a
better present next year, the latter can also help her to modify her
general search behavior, assuming she uses similar strategies in other
search tasks. The assumption of consistent search strategies across
tasks fits with the idea of a generalized cognitive search mechanism
raised by Hills, Todd & Goldstone (2008), who found similar search
patterns in spatial and mental tasks (see also Todd, Hills & Robbins,
2012, for more on search across tasks). In the present example, if
related search strategies are used in various environments (e.g., Sally
searches only a little in all her purchasing choices), internal
information has the potential to improve future decisions in scenarios
other than buying Harry a birthday present (e.g., by extending Sally’s
search when looking for other products).
Returning to Sally’s search for travel options: Since Sally does not
expect to encounter the same search environment (travel deals to
Australia) in the future, Harry’s argument that her post-decision
search is useless is true with respect to distributional
knowledge. There is no point in collecting information about
alternatives in order to better understand an environment that you do
not expect to visit again. However, even if one is searching in such a
unique environment (which will not be repeated in the future),
post-decision search can still be helpful in acquiring strategy
feedback, which can be used in other environments. Therefore, knowing
that the current environment will not be repeated again should
eliminate the motivation to engage in post-decision search for the
purpose of obtaining (external) distributional knowledge but not for
the purpose of obtaining (internal) strategy feedback.
While the usefulness of external distributional knowledge is commonly
referred to in the experimental literature, the possible usefulness of
internal strategy feedback is frequently overlooked (but see Reb &
Connolly, 2009 for studies of self-blamed regret). For example, the
finding that people tend to consider post-purchase information when
complete distributional knowledge is given in advance and future prices
are not obtainable was suggested to result from an automatic
counter-productive process, and to contradict functional explanations
(Cooke et al., 2001). In the current paper we further explore the
potential of functional post-decision search, focusing on the possible
usefulness of internal strategy feedback.
Another reason that previous post-decision studies have not
systematically explored the possible benefits of post-decision search
is that they are usually done in one-shot settings (only one search
problem), where post-decision information cannot be used in later
choices. That type of experimental setting therefore emphasizes the
irrational aspects of the decision to engage in post-decision search.
In most real life situations, however, people make numerous search
decisions, and what might be seen as irrational choice in a one-shot
decision might actually represent smart generalization in more natural
repeated settings (see also table 4.1 in Gigerenzer, 2004 describing
examples of phenomena that were first interpreted as “cognitive
illusions” but later revalued as reasonable judgments given the
environmental context). Although not common in the post-decision
literature, repeated search tasks are broadly used in economic,
consumer search and learning studies. And a particularly appropriate
type of task (which is easily repeated) for examining possible
benefits for post-decision search, consists of optimal stopping
problems, where the main decision is whether to choose the current
option or to continue searching for a better one.
1.2 Pre-decision search and the Secretary Problem (SP)
Perhaps the most famous optimal stopping problem is the secretary
problem (Ferguson, 1989): An employer is looking to hire the best
secretary in town, and invites a random sequence of candidates for
interviews. The employer can hire a candidate only immediately after
interviewing him/her (previous candidates become unavailable), so the
challenge is when to stop the search and select the current candidate.
The reason this problem became famous is that under a few assumptions
(including that the total number of candidates is known, and the value
of each candidate is described as a relative rank rather than an
objective value) the problem has a very elegant solution: The employer
should reject the first n/e applicants (where n is the total
number of applicants), and then hire the next applicant who is better
than all applicants interviewed so far.
Most papers on the secretary problem focus on calculations of the
optimal stopping rule for different variations of the problem (see
Freeman, 1983, for a review), but a few experimental studies have
examined how people actually behave in such settings. The main
experimental finding is that overall, compared with the optimal
stopping rule, people terminate their search too early (e.g., Rapoport
& Tversky, 1970; Seale & Rapoport, 1997; Seale & Rapoport, 2000;
Schotter & Braunstein 1981; Hey 1987; Bearden, Rapoport & Murphy,
2006). However, other studies show that when the optimal amount of
search is very low, the opposite result of over-searching can occur
(e.g., Baron, Badgio & Ritov, 1991; Zwick, Rapoport, Lo &
Muthukrishnan, 2003). Can post-decision search in these settings lead
people to improve their performance by understanding better when to
search more and when to search less?
The main purpose of the current paper is to investigate the possible
benefits of post-decision information resulting from strategy feedback.
To this end, we examined the possibility of learning in a repeated
modified version of the secretary problem, with exact rather than
relative values of options, and payment corresponding to these values.
Using exact values was done for three main reasons: (1) Ecological
validity: In many real-life situations, both the relative difference in
value between options and the exact values of each option are the
factors that drive the decision (Teodorescu, Moran & Usher, 2015).
Importantly, such information is unavailable in an experiment when only
relative ranks are used. In addition, in natural environments, decision
makers are rewarded with the value of the chosen alternative even if it
is not the best one (Pirrone et al., 2014). (2) Increased chances to
find evidence for improvements: learning to choose better options (not
just the best option) may not be evident in studies with payoff for
only the highest relative rank but can be observed when using varying
rewards reflecting exact option values. (3) Examination of different
value environments: Using exact values of options enables us to examine
whether people employ the same search strategies in environments with
different distributions of values (which relative ranks are
specifically intended to hide). Here for instance we will look at
environments with a low range of values versus environments with a high
range of values, to explore the possible generalizability of learning
across environments with different value distributions.
In a preliminary study, we manipulated two factors that are expected
to influence the proposed motivations for useful post-decision search,
namely repetition of environments and prior information about each
environment. As expected, participants conducted more post-decision
search when no prior information was provided. More importantly, the
results of the preliminary study also show that people conduct
voluntary post-decision search, even in unique environments, where
distributional knowledge is useless. To examine the potential
usefulness of post-decision search in unique environments in the two
main studies here, post-decision search was manipulated
directly. Exposure to post-decision information was found to lead to
improved performance, suggesting a role for post-decision information
in acquiring strategy feedback. Finally, to explore the cognitive
mechanisms used, in the third experiment we apply an explicit strategy
elicitation methodology, to directly observe the type of strategy
modifications which follow post-decision search. We find that
following exposure to post-decision information, people learn to
collect more data before generating their initial decision
thresholds. This result suggests a more general rather than a specific
change to the strategy used to search in different environments.
2 A preliminary study: examining voluntary post-decision search
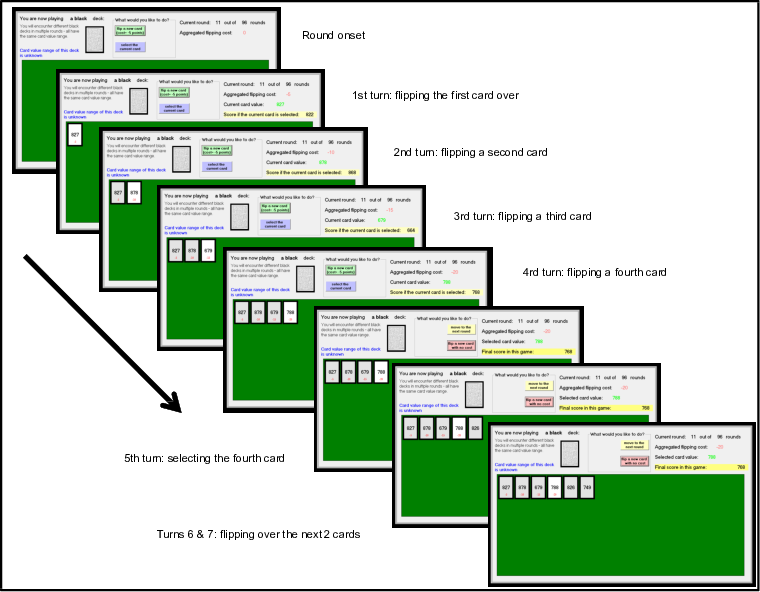
| Figure 1: Experiment round timeline. At the beginning of each round,
participants are presented with a deck of cards and then on each
turn they flip a card over with a cost of 5 points per card, until
they decide to select the current card and receive its point value
(in the example shown the 4th card is
selected). They are then given the option to continue to see more
cards without cost — in the example shown the participant sees two
additional cards after making his choice, and only then moves to the
next round. |
2.1 Method
Participants.
42 students from Indiana University participated
in this study (30 men and 12 women, average age=20.1, std=2.8). The
experiment lasted 30–60 minutes, for which all participants received 1
course experiment credit. In addition, the top five performers (who
accumulated the highest number of points during the experiment)
received a bonus of $20. To increase motivation, participants were
told in advance that they would get this bonus if their performance was
in the top 10%. The experiment was anonymous, but participants were
asked to provide an email address so they could be contacted if they
earned the bonus.
The basic task.
We used a simple search task consisting of
multiple rounds of several turns each. In each round, a deck of cards
is presented on the computer screen, and every turn the value of one
card from this deck is revealed or chosen by the participant (see
Figure 1). In each turn, participants can choose whether to search
further and see (“flip over”) the next card in the deck, or to stop the
search and select the current card. The reward for each round (in
points) is the value of the selected card3. In addition, a
fixed search cost of 5 points is deducted from the round’s payoff
every time a new card is flipped over. Accordingly, the total round’s
payoff P is the value of the reward R minus the
aggregated cost, P=R−5T, where T
is the number of turns until a final decision was made.
After making a final decision, participants are given the option to
continue searching through more cards for free (without losing
points)4 and so see what
further cards were available, had they continued to search. They are
allowed to flip over as many cards as they wish before moving to the
next round.
Manipulations and experimental design.
Two factors were
manipulated across all the rounds that each participant saw – whether
the deck of cards used in the current round would be repeated in later
rounds (yes/no) and whether descriptive information was given about the
distribution of values in the current deck (yes/no), resulting in a 2x2
within-subject experimental design. In addition, the decks varied in
their value ranges (high, medium, and low ranges) to explore the effect
of motivation for participants to learn search strategies that could
generalize across such differing environments.
Repetition.
There were two types of cards decks – black/white
decks and colored decks. The black deck and the white deck were
multiple-occurrence decks and were repeated 24 times in different
rounds during the experiment. In contrast, each colored deck appeared
only once throughout the experiment and consisted of cards from a
unique range of values. There were 24 colored decks in each of the
information conditions below.
Information.
Bright decks (white and light colors) were
presented with a full description of their card value distribution
(for example: “card value range: 1000–1500, all values in this range
are equally likely on every flip”) while for dark decks (black and
dark colors) no information about the distribution of values was given
(“Card value range of this deck is unknown”) and participants could
learn about those decks only by flipping cards over.
Accordingly, the 4 conditions were: black deck – 24 repetitions, no
information; white deck – 24 repetitions, full information; 24 dark
colored decks – no repetition, no information; 24 light colored decks
– no repetition, full information. Overall, the card game included 96
rounds, randomly intermixed. Card values in each deck were drawn from
a uniform distribution [Xi, Xi, +Di].5 The distribution
parameters, Xi ∼ [0, 1300] and Di ∼ [60, 480], were drawn
independently for each deck i without replacement and
separately for each participant at the beginning of the experiment.
That is, every participant played different distributions, randomly
generated from the same space of values and ranges and according to
the same algorithm. The exact algorithm is detailed in Appendix 1. The
way card values were generated across decks was unknown to
participants — they were told only that white and black decks will be
repeated while colored decks will not, and that for some decks they
will be given the range of card values while for other decks they will
not be given any such information. Importantly, every round included a
full description of the type of deck (whether this deck will be
repeated or not, and what its range of card values is or that the
range is unknown). Thus, participants were not required to remember
what color belongs to which condition, and the colors only served as
additional cues.
Individual difference measures.
After playing all 96 rounds of
the card game, participants filled out two personality scales:
Maximization and Need For Cognition (NFC). Maximizers were previously
found to search longer than satisficers (e.g., Dar-Nimrod, Rawn, Lehman
& Schwartz, 2009). People high in NFC have been shown to seek more
information (e.g., Verplanken, Hazenberg & Palenewen, 1992; Curşeu,
2011), to be more successful at adaptive decision making (Levin, Huneke
& Jasper, 2000) and to solve complex problems more effectively (e.g.
Nair & Ramnarayan, 2000). Post-decision studies emphasize the role of
regret in seeking post-decision information (e.g., Shani & Zeelenberg,
2007; Cooke, Meyvis & Schwartz, 2001; Summerville, 2011), so we added
the 5 item regret scale to the 13 item maximization scale, both taken
from Schwartz et al. (2002). For assessing Need For Cognition, the 15
item scale from Roets & Van Hiel (2011) was used.
Questions.
The preliminary study was designed to explore
voluntary post-decision search behaviors under varying conditions. Will
participants engage in post-decision search? Will the amount of
post-decision search vary across the different deck types?
Post-decision distributional knowledge is most relevant when there is
no prior information about the values and such information is important
in future rounds (i.e., in repeated decks, where it can be used later
on). However, if post-decision search is motivated by the desire to
obtain feedback about one’s search strategy, engagement in
post-decision search is expected to occur even when prior
distributional knowledge is provided and/or such distributional
information cannot be used in future decisions.
Individual consistency and differences.
An underlying assumption of the argument that participants can benefit
from feedback about their search is that similar search strategies are
used consistently in different value-range environments. This implies
that people who search relatively little (or relatively more) before
choosing a card in a given environment will also tend to search
relatively little (or more) in other environments with different value
ranges. Similarly, people who tend to engage in relatively little
(more) post-decision search in one environment will also tend to
conduct relatively little (more) post-decision search in other
environments. Notice that consistency of search strategies across
different value-range environments does not predict anything with
respect to the relationship between the amount of pre-decision and
post-decision searches (i.e., a participant can search a lot before
selecting a card and very little after, but stay consistent with such
search patterns across different value-range environments).
2.2 Results
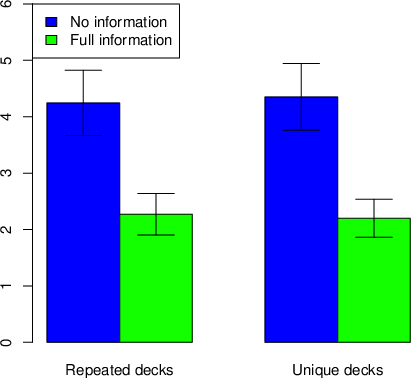
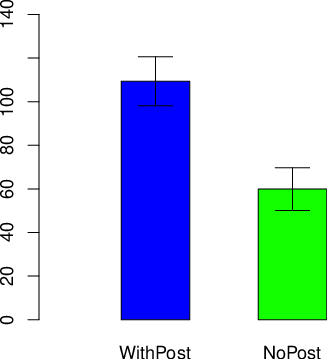
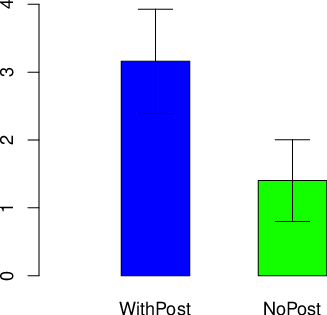
| Figure 2: Mean amount of post-decision search (number of cards
participants chose to see after making their choice) in the four
conditions; error bars show 1 SE. |
2.2.1 Post-decision search: repetition and information
We conducted a 2X2 repeated measures ANOVA with 2 within-subject
factors: repetition (yes/no) and distribution information
(with/without). The results showed significantly less post-decision
search when information was available compared with the no information
condition (main effect for information: F(1,41)=30.75,
p<0.001, ηp2 = 0.43). However, the main effect for
repetition and the interaction were not significant. These results are
clearly evident in Figure 2. Most importantly, even in unique decks,
where participants knew they will not encounter the same deck twice,
the amount of post-decision search is substantially above
zero. Because distributional knowledge motivation to engage in
post-decision search does not hold in unique environments, this result
supports the argument that participants sometimes engage in
post-decision search to obtain some form of feedback about their
search.
2.2.2 Individual consistency and differences
Recall that, to exploit any benefit from feedback about one’s strategy in
unique environments, search strategies across different environments
should be related. To measure search consistency across different
value-range environments, we categorized all unique decks (where
distributions are varied) into 3 types: low-, medium-, and high-value
ranges, separately for each participant.
Each participant played 48 unique
decks (which were different for each participant, randomly generated
according to the algorithm described in Appendix 1): The decks with the
lowest 16 distribution means were categorized as low-value decks, the
highest 16 distribution means were defined as high-value decks, and the
16 decks in between as medium-value decks. Across all participants,
each category included 672 decks (16 decks per participant * 42
participants), and the average means of card values were 305.5 for
low-value decks, 751.3 for medium-value decks, and 1211.1 for
high-value decks.
Next, we calculated the correlations between the amount of pre- and
post-decision search done by each participant in these different
value-range environments. All correlations across environment types for
pre-decision search had r>0.55 and all correlations for
post-decision search had r>0.8 (p-values<0.0001
for all). In contrast, all correlations between pre-decision search and
post-decision search within and across environment types had
|r|<.06 (p-values>0.7 for
all), indicating strong differences between pre- and post-decision
search among individual participants. In other words, the more one is
likely to search before selection in low-value environments, the more
he/she is likely to search before selection in medium- and high-value
environments; similarly for post-decision search. Yet, how long
participants searched before selecting a card seems to have nothing to
do with how long they searched after the decision.
These results suggest that individuals use similar search strategies in
different environments in this task. Further, the absence of
correlations between the amount of pre- and post-decision search
provides evidence for independent strategies when searching before and
after making a final decision.
To examine whether voluntary engagement in post-decision search is
related to personality traits, we examined the correlations between
amount of post-decision search in the current task and scores on the
personality questionnaires (Regret, Maximization and NFC). All
correlations were weak and insignificant (|r| < .15 for all
correlations), suggesting that voluntary engagement in post-decision
search in the current task is not related to traits captured in the
particular personality scales we used.
3 Main studies
To examine the potential role of post-decision information in improving
performance, in the two main studies we manipulated post-decision
information directly (based on the observed amount of voluntary
post-decision search in the preliminary study). Half of the
participants could not engage in post-decision search at all, while the
other half were forced to see post-decision information. To focus on
the effect of the internal post-decision information (feedback about
one’s search) we used unique decks only, where information about the
alternatives themselves cannot be used in future decisions (thus
eliminating the benefits of external post-decision information about
the search environment). Furthermore, the main studies employed only
no-information decks (where, according to the results of the
preliminary study, people are more likely to initiate post-decision
search by themselves) — hence, the unique/no-information condition from
the preliminary study was used throughout this new task. Using only one
condition simplifies the instructions and was intended both to reduce
confusion and enable more improvement (via more rounds).
4 Study 1: Manipulating exposure to post-decision information
4.1 Method
Participants.
50 students from Indiana University participated
in Study 1 (28 men and 22 women, mean age=22.32, std=4.41). They were
recruited through advertisements on campus and were given $9 as a
basic show-up fee (rather than credit). As in the preliminary study, a
$20 bonus was given to the top 10% performers, and the experiment
lasted around 30–60 minutes.
Procedure.
After reading the instructions, participants
played 100 rounds of the card game.6 All decks were unique, and participants knew that
they would not encounter the same deck twice. As noted, during the
whole game in this study, no a-priori information was mentioned or
provided. Half of the participants did not have the option to engage
in post-decision search (No-Post group) and the other half were forced
to see 5 post-decision cards (With-Post group). After completion of
the card game, participants were asked to answer the same personality
questionnaires as in the preliminary study: maximization, regret and
NFC scales.
Hypothesis.
If post-decision information indeed provide useful
feedback about one’s search, participants in the With-Post group who
receive post-decision information should perform better than those in
the No-Post group without such information. This prediction rests on
the assumption that there will be strong correlations between the
amount of pre-decision search across different value environments as
was observed in the preliminary study.
4.2 Results and discussion
An unpaired t-test was performed on the average number of points
participants earned in a round (as the most objective and explicit
measure of performance). The results reveal better performance in the
With-Post group compared with the No-Post group (2869 compared with
2823, t=2.34, p=0.02). Participants who were forced to see 5
post-decision cards earned on average 46 more points in a round
compared with participants who did not have any post-decision
information (that is, about 4600 more points in the whole experiment).
Similarly to the preliminary study, we calculated the correlations of
the amount of pre-decision search across different value environments
(low-, medium- and high-value decks were determined according to three
quantiles, per participant). All correlations were highly significant
(r>0.55 and p<0.0001 for all), implying that
participants who searched relatively little before selecting an option
in low-value environments also searched relatively little in medium-
and high- value environments. In other words, search strategies as
reflected in the amount of pre-decision search were
consistent across different value environments. In addition, there was
a significant positive correlation between the amount of pre-decision
search and number of points earned (r=0.35, p=0.01), suggesting more
under-search than over-search.
With respect to the personality questionnaires, the correlations
between amount of pre-decision search and scores on the Maximization
and Regret scales were close to zero (except for Maximization subscale
“choice difficulty”, r=0.29, p=0.04, uncorrected for multiple
tests). Finally, only weak positive correlation was found between the
amount of pre-decision search and the NFC scale (r=0.19, p=0.09).
Taken together, given that people seem to search in a consistent manner
across different value environments (as shown in the preliminary study
and in the current study), post-decision information in one environment
can help to modify one’s search strategy and improve performance in
other future environments.
5 Study 2: Explicit elicitation of search strategies
The results of Study 1 show that post-decision information can be
beneficial even when future decision are not expected in the same
environment. This result supports the assertion that post-decision
information provides a beneficial internal feedback about one’s search
strategy. But we do not yet know what search strategy people use and
how it is affected by post-decision information. Most optimal solutions
to search tasks similar to the secretary problem involve looking at a
few candidates, after which a threshold is generated and the next
candidate satisficing this threshold is chosen (Gilbert & Mosteller,
2006). In the specific case of exact values (rather than relative
ranking) taken from an unknown distribution, the first stage can
represent a data collection (exploration) period during which one is
gathering external information about the distribution of values in the
environment (Kahan, Rapoport & Jones, 1967; Teodorescu & Erev, 2014).
The second stage involves generation and updating of thresholds, which
in turn determine conditional acceptance of the next candidate
(exploitation). While optimal solutions take into account the position
of alternatives in the sequence (i.e., turn number), it is possible
that people use simple heuristics such as using the same threshold in
both early and late turns without updating according to the position in
the sequence and/or to other variables such as search cost (Lee,
O’Connor & Welsh, 2004). Alternatively, people may reduce their
thresholds over time but do so too much by over-weighting the role of
position in the sequence. In Study 2, we aim to uncover more evidence
for the form of the strategy that people are using, and to understand
whether and how those strategies are changed following exposure to
post-decision information.
We assume that people use search strategies in this task with the
following general structure: some initial amount of exploratory data
collection, then generation of the first threshold and consideration
of the first option, followed by possible updating of the threshold
and consideration of the next option until one is chosen. Employing a
direct approach under which different elements of participants’ search
strategies can be observed explicitly, we asked participants on every
turn to either collect data by looking at a card or to specify a
threshold that would be used to stop search if the current card had a
higher value (see Busemeyer & Myung, 1992 for a similar methodology),
and examined how post-decision information affected the explicit
strategy used. Since we make participants explicitly specify
thresholds, which requires time and effort on all those turns, we
removed the other explicit search cost of 5 points each time a new
card is flipped over. In other words, the cost of search was now the
cost of thinking whether and how to specify thresholds (and the
effort/time it takes to type it in), rather than reduction of the
payoff by a fixed amount of points. Moreover, we gave participants the
option to use their previous threshold without typing it in by
pressing on a button. Thus, the cost of typing in and thinking about
new thresholds was gradually decreasing already during the
pre-decision search.
It is important to note that even though a large variety of specific
search strategies are possible in the current framework, some people
may actually be using other strategies in this problem that do not fit
with the way we are measuring their data collection and threshold
generation behavior (e.g., in the setting of this study, it was
impossible to use the data collection option after thresholds were
specified). In addition, it is possible that eliciting thresholds
explicitly changes the way people search. For example, in a similar
task, Sang, Todd & Goldstone (2011; see also Sang et al., 2018) found
that some participants reported using thresholds that were constant or
increased over turns, while their actual behavior showed decreasing
thresholds overall.7
Therefore, the advantage of obtaining more details about a
participant’s possible search strategy is accompanied by the
disadvantage of potential misrepresentation of the real search
strategy being used when no specification of thresholds was required.
However, as will be described below, the qualitative results of the
current study were similar to the results obtained in the first study
(where search strategies were implicit and unlimited), supporting the
assumption that most participants’ search strategies can be usefully
observed with the current experimental constraints.
An additional change from Study 1 was that here we adopted a
test-training-retest design with post-decision information being
unavailable during test and retest phases, so that the only difference
between the With-Post and No-Post groups occurred in the training
phase. This design was used to increase power by enabling comparison of
the test-retest gap within each participant. Accordingly, in the design
of Study 2, all participants first completed a test phase consisting of
15 rounds without post-decision information. To further eliminate noisy
search in the first few rounds resulting from misunderstanding of the
task, another change was the addition of 3 practice rounds before the
beginning of the initial test phase (see Figure 4, below).
Last, to be more comparable with previous post-decision search studies,
we also added a satisfaction measure: At the end of every round, we
asked participants to rate their degree of satisfaction with the
outcome they received. Following previous studies, we expected to find
lower satisfaction when post-decision information is provided. The
current design also enables us to examine changes in satisfaction over
time and when no post-decision information is available.
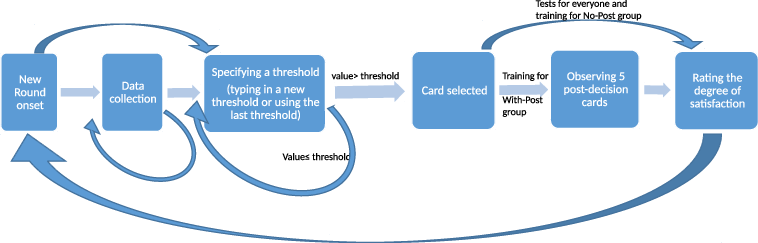
| Figure 3: Structure of each round in Study 2, showing the organization
of turns over time. When starting a new round, participants could see
cards without choosing (data collection). Once they specify a
threshold, the next card is chosen if its value is above their
threshold. If not, they can use the same threshold or type in a new
threshold, until a card is selected. |
5.1 Method
Participants.
100 students from Indiana University participated
in Study 2 at the end of a semester (48 men and 52 women, mean
age=19.15, std=1.4). Recruitment and payment was the same as in Study 1
(one credit point as a basic show-up fee plus a bonus of $20 given to
the top 10% performers), and the experiment lasted around 30–60
minutes.
Procedure.
Participants read the instructions and then played 3
practice rounds during which they were encouraged to ask questions,
before starting the real game. The basic task was the same card game in
Study 1, with unique decks and without a-priori information. Here too,
participants were explicitly told in advance that all decks are unique.
The game included three blocks of rounds: Test1 (15 rounds), Training
(45 rounds) and Test2 (15 rounds). The experimental design is presented
in Figure 4 and detailed below. The algorithm used to select the decks’
values is fully described in Appendix 1.
Figure 3 describes the timeline for each round: On the first turn in the
round, participants could choose between collecting data and specifying
a threshold, after which the next card value was revealed. Data
collection meant seeing the next card without typing any threshold and
without the ability to choose that card. The data collection action was
available only in the initial turns of each round (for as long as data
collection was the only action that had been chosen so far), and was
disabled after the first threshold was specified. Specifying a
threshold was done by typing a number, above which the next revealed
card would be chosen for the participant. If the value of the next card
was below the threshold typed, then in the next turn the participant
could continue to use the same threshold (clicking a button that had
their previous threshold shown on it) or typing in a new threshold. For
example, if a participant typed “800” (threshold=800) and then the card
value revealed was “900” then this card was chosen and determined the
points earned for this round (round payoff=900). Alternatively, if the
next card value was “600”, then that card was not selected and the
participant continued playing with this deck (by using the same “800”
threshold or by typing in a new threshold value) until a card was
selected. If a card was not selected before the 60th
turn, the 60th (last) card was automatically chosen.
This was explained to the participants and a reminder was shown for the
58th and 59th cards if the
participant reached them. Only 2 participants consistently reached the
60th card.8 As will be explained below, those two
participants were excluded from the analysis, because they did not
specify thresholds in the majority of rounds during the first test.
After a card was selected, participants were asked to rate their degree
of satisfaction with the outcome they received in the current round on
a 4 point scale: very dissatisfied, slightly dissatisfied, slightly
satisfied or very satisfied. After this, the next round began.
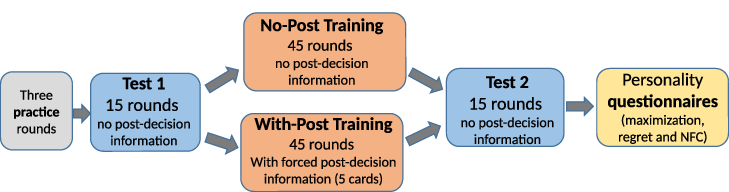
| Figure 4: Experimental design for Study 2; the internal structure of
each round is shown in Figure 3. |
Once the first 15 rounds were completed, participants in the With-Post
group were notified that in the next 45 rounds they would play the game
with an additional 5 post-decision cards in each round right after a
card was selected (as shown in Figure 3). Participants in the No-Post
group were simply told that in the next 45 rounds they would play the
same game as before. Importantly, this means that there was no
difference between the groups up until this point, and the only
difference after was the availability of post-decision information
during the 45 “training” rounds. Finally, all participants played
another 15 rounds without post-decision information. After completion
of the game (75 rounds total), participants completed the maximization,
regret, and NFC scales. See Figure 4 for the complete experiment
structure across rounds.
Analysis.
The design used in this study (test-training-retest)
enables a close look at individual differences. Descriptive statistics
of absolute measures are presented, but the main analysis was done
using test-retest differences.
Analysis notes.
Two participants who did not specify any
thresholds in more than 45% of the rounds during Test1 were excluded
from the analysis.9 Accordingly,
the analysis included 98 participants (47 men and 51 women). In
addition, sometimes participants chose to type extreme and unrealistic
thresholds instead of using the data collection option (e.g., typing in
a threshold of 50,000 where the highest value participants could see
was below 4,000), and then updated these extreme thresholds later on
until a card was selected. Under the assumption that such extreme/
unrealistic thresholds at the beginning of a round represent data
collection behaviors, we coded thresholds above 5,00010 at the
beginning of the round as representing data collection and analyzed it
accordingly (graphs of the data without coding extreme thresholds as
data collection behaviors are shown in Appendix 2, along with further
discussion on participants’ use of such extreme thresholds).
5.2 Results and discussion
The total amount of pre-decision search and points earned were measured
as before, however, the current study also includes three additional
measurements, which represent different components of the search
strategy: data collection (average number of cards seen before typing
in the real first threshold), first thresholds (average initial
threshold) and mean threshold updating (the average amount of changes
in thresholds over a round11). All
measurements were averaged at the individual level for every round,
then for every block (test/training), and last for each group.
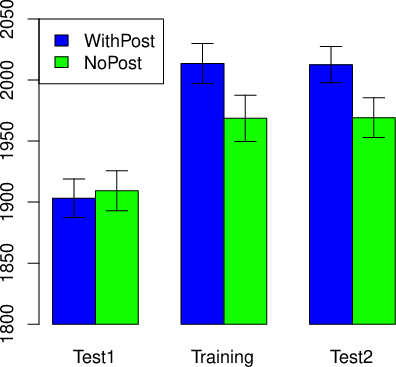
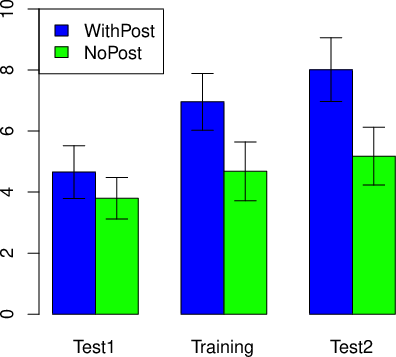
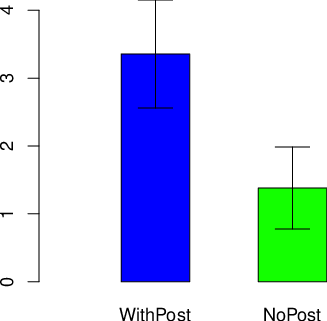
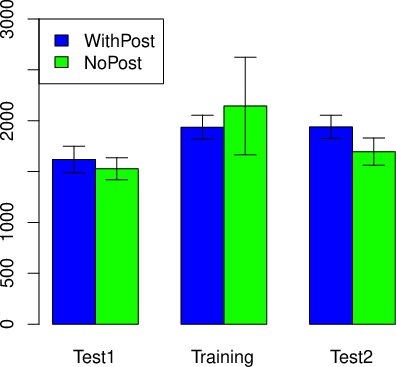
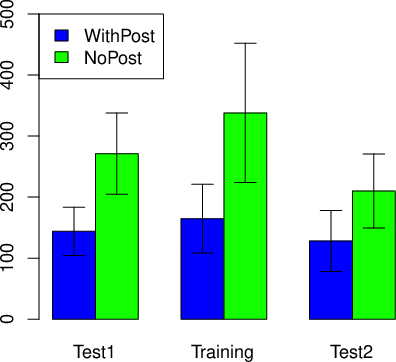
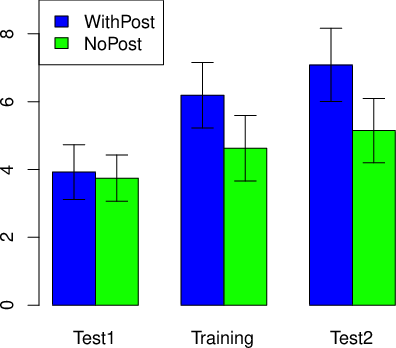
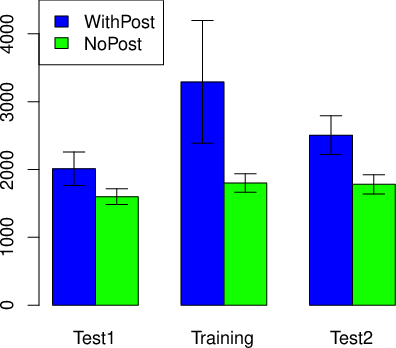
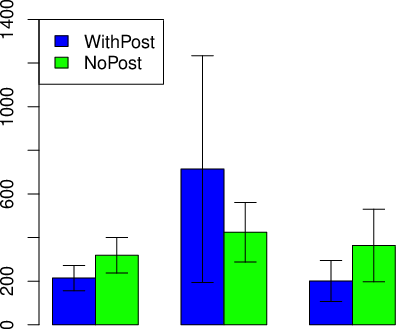
The left side of Figure 5 provides absolute measurements of
participants’ search and performance for each group. A first look
reveals that With-Post participants earned more points, collected more
data, and updated their thresholds less compared with No-Post
participants. The former two changes (performance, data collection)
occurred during training, and remained also after post-decision
information was removed. In contrast, the difference between the groups
in threshold updating occurred already in Test 1, although Test 1 was
identical to both groups. That is, despite random allocation to groups,
participants in the With-Post group updated their thresholds much less
to begin with (and collected slightly more data), compared with No-Post
participants. Since the aim of the current study was to characterize
changes in search due to post-decision information, we analyze the
test-retest changes, which controls for these differences.
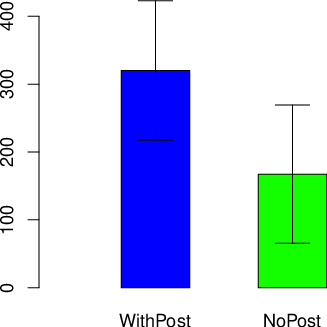
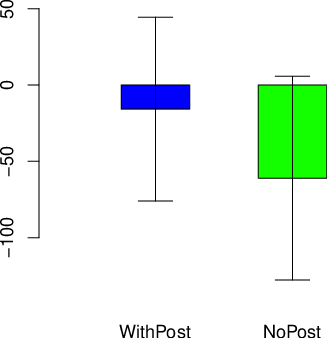
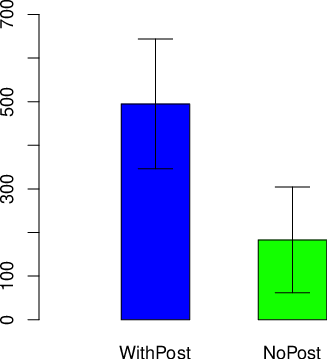
To statistically examine how post-decision information, provided during
training, influenced participants’ search strategy and performance, we
calculated for each participant individual changes between the first
and the second tests (Test2 − Test1). The average test-retest gaps
are presented in the right side of Figure 5. To statistically examine
differences between the groups, we conducted one-way MANOVA of all four
gap measurements (performance gap, data collection gap, first threshold
gap and threshold updating gap). The results suggest that With-Post
participants on average improved their performance more (F(1,97)=11.05,
p<0.01) and increased their data collection more
(F(1,97)=3.92, P=0.05),compared with No-Post participants. There were
no significant differences in first thresholds and threshold updating
gaps.
5.2.1 Satisfaction
The average satisfaction ratings in Test1, training and Test2 were just
above three (“slightly satisfied”) in all groups. However, the ratings
seem to be a bit lower during post-decision manipulation (the average
rating of theWith-Post group during training was 3.05, while all other
average ratings were in the range 3.1–3.21). Indeed, when a simple
t-test is performed on the training blocks comparing the two groups, a
marginal effect can be found (3.05 for the WithPost group compared with
3.21 for the NoPost group; T(96)=1.75, p=0.08). Thus, even if
satisfaction is slightly reduced during exposure to post-decision
information (a very weak result in the current data), it goes up again
after removal of the post-decision information. In contrast, the
performance measurement (as well as the data collection component)
maintained the improvements of post-decision training even after
training was over, and post-decision information was removed.
5.2.2 Correlations and individual differences
To examine consistency of search strategies across different value
environments, correlations between low-, medium-, and high-value
environments were calculated for the following variables: the total
amount of pre-decision search, data collection, first thresholds and
mean updating. All correlations were above 0.4 with p-values
<0.001, suggesting once again that search strategies in the
current task are quite consistent across different environments. In
addition, there was again a strong positive correlation between the
amount of pre-decision search and number of points earned (r=0.87,
p<0.001), suggesting under- rather than over-search.
With respect to the personality scales examined, in this study Need For
Cognition was positively correlated with average pre-decision search
(r=0.26, p=0.01). Maximization and regret scores (including the 4
maximization subscales) had no such correlation.
6 General discussion
Search behavior is an integral part of our everyday life. We search for
where to shop, which website to surf, the lowest price for a specific
car, a new cell phone or laptop. In many cases, we sample few
alternatives before selecting our preferred option. Sometimes people
also sample forgone options after they have already terminated their
initial search and made a choice, even in cases where further
distributional knowledge (about the environment) is useless for further
choice. While such post-decision search might appear redundant, here we
have explored conditions under which it could still be beneficial.
Specifically, if similar search strategies are used in a range of
environments, then post-decision information in a particular
environment can provide feedback about one’s search strategy that could
help to improve one’s search in other environments in the future.
In the preliminary study we explored how environment information and
repetition influence voluntary post-decision search. People searched
less when descriptive information about the environment was given in
advance, in line with previous studies showing reduced search with more
information (e.g., Palley & Kremer, 2009). However, they searched about
the same in repeated and unique environments, possibly because the
external distributional knowledge provided by post-decision search,
which can be used only in repeated environments, did not strongly
motivate post-decision search in the current task.
In the two main studies, we examined causality by directly manipulating
post-decision information in unique environment settings. Although
external, distributional, knowledge about the environment is
useless in such settings, post-decision information nonetheless
improved participants’ performance. This points to a beneficial role of
post-decision search that is driven by the internal
information about the effectiveness of one’s search strategy.
In the second main study, search strategies were elicited explicitly,
enabling us to examine the effect of post-decision information on
different components of the search strategy. The results suggest that,
within a variety of search strategies one can use, post-decision
information leads to increased pre-choice data collection behaviors,
which might underlie the observed performance improvements. But why did
the main change occur in data collection behaviors and not in other
components of a search strategy such as generating and adjusting choice
thresholds? One functional explanation for this result can be that data
collection modifications are more easily implemented, because one can
simply learn to look for more options before generating any threshold
without any consideration of the exact values observed in a specific
environment. In contrast, generation of initial thresholds and later
threshold updating both require some consideration of the values
observed, which in turn, might demand more cognitive resources.
The unique experimental design of the last study (Study 2) demonstrates
that explicit elicitation of threshold strategies can shed light on the
process underlying search behaviors. This methodology is different from
the common computational modeling approach, in which search strategies
or heuristics are inferred indirectly (e.g., Zwick et al., 2003). The
main potential disadvantage of using explicit threshold reports is that
it might change the way people search. While this remains an important
consideration, we did find similar improvements and correlations
between the amount of search in different value environments, with and
without the addition of a requirement to specify thresholds explicitly.
Thus, it seems that the way participants were required to specify
thresholds was flexible enough to capture a large range of possible
search strategies and heuristics.
An additional potential methodological advantage of the current studies
is the employment of exact values (rather than relative ranks) for
options and corresponding rewards based on chosen values rather than
only rewarding the selection of the best option. These methodological
modifications increase the ecological validity and most importantly,
enable higher-resolution examination of learning and improved
performance. Moreover, using exact values, we were able to examine
generalization across different value-range environments (which is
impossible when only relative ranks are used). In all three studies,
participants exhibit consistency in the way they search across
different environments: The amount of pre-decision search was highly
correlated across low-, medium-, and high-value environments in all
experiments. Moreover, in the third study, strong correlations across
environments were observed in all of the three strategy components
examined (data collection, initial thresholds, and threshold updating),
suggesting that participants were using the same or similar search
strategies when they encountered different value environments. In the
first study, where post-decision search was voluntary, the amount of
post-decision search was also highly correlated across environments.
However, it is important to note that we did not find correlations
between the amount of pre- and post-decision search (examined in the
preliminary study), which may mean there are independent search
strategies before and after selection of options, even if both are
consistent across environments. Consistent search strategies are in
line with the idea of a generalized cognitive search mechanisms (Hills,
Todd & Goldstone, 2008). The consistency observed in the current
studies suggests transfer of learning from one environment to another,
which is appropriate only if the same or very similar strategies are
used in the different environments. In other words, one can learn that
she did not search enough in one environment, but this information will
not be very important if the current search strategy is only used in
rare environments.
Our main argument is that post-decision information can be useful in
repeated search tasks, because people can learn to modify their search
strategy to make better choices in future search tasks. This internal
information provided by post-decision search can be helpful even when
external feedback about the environment is useless. For example, when
finding out about performances one just missed in a unique music
festival, information about the performances themselves is not likely
to be of any use, but finding out that you missed a great band gives
negative feedback for the search strategy used, which can lead to
strategy modification and longer search the next time you are
searching. Using similar search strategies in different environments
means that this negative feedback is likely to help you improve your
search not only next time you go to a music festival, but also in your
future searches of a car, a cell phone or a vacation deal.
The view of post-decision search as reflecting irrational over-search is
closely related to early research about counterfactuals in psychology
(e.g., Kahneman & Tversky, 1982; Sherman & McConnell, 1995, but see
also later papers such as Petrocelli, Seta & Seta, 2013), which
focused on dysfunctional thoughts about alternative scenarios to
reality (what could have been if…). The current view of post-decision
search as beneficial in the long term is analogous to ideas in other
papers about counterfactuals (e.g., Epstude & Roese, 2008), in which a
beneficial role of counterfactual thinking includes adjusting future
behavior to improve performance. In line with this functional
perspective, Zeelenberg (1999) suggested that regret can increase
learning (though in our current work we did not measure the causal
relationship between feeling of regret and improved performance).
Similarly to the transition in the literature on counterfactuals, the
current paper points to the dangers lying in interpretation of
“one-shot” behavioral phenomena as representing behavioral biases,
deviation from rationality and/or evidence for maladaptive behavior.
Our findings show that, when the experimental setting enables learning,
post-decision information can help people to learn from their mistakes
and improve their search. Our findings thus may provide functional
justifications for post-decision search behaviors, even in cases where
one is not expected to encounter the same environment in future
decisions.
References
Adams, J. S. (1961). Reduction of cognitive dissonance by seeking
consonant information. The Journal of Abnormal and Social
Psychology, 62(1), 74–78.
Baron, J., Badgio, P. C., & Ritov, Y. (1991). Departures from optimal
stopping in an anagram task. Journal of Mathematical
Psychology, 35(1), 41–63.
Browne, G. J., & Pitts, M. G. (2004). Stopping rule use during
information search in design problems. Organizational Behavior
and Human Decision Processes, 95(2), 208–224.
Bearden, J. N., Rapoport, A., & Murphy, R. O. (2006). Sequential
observation and selection with rank-dependent payoffs: An experimental
study. Management Science, 52(9), 1437–1449.
Busemeyer, J. R., & Myung, I. J. (1992). An adaptive approach to human
decision making: Learning theory, decision theory, and human
performance. Journal of Experimental Psychology:
General, 121(2), 177–194.
Cacioppo, J. T., & Petty, R. E. (1982). The need for
cognition. Journal of Personality and Social
Psychology, 42(1), 116–131.
Cooke, A. D., Meyvis, T., & Schwartz, A. (2001). Avoiding future regret
in purchase-timing decisions. Journal of Consumer
Research, 27(4), 447–459.
Dickson, P. R., & Sawyer, A. G. (1990). The price knowledge and search
of supermarket shoppers. The Journal of Marketing, 54(July),
42–53.
Donnelly, J. H., & Ivancevich, J. M. (1970). Post-purchase
reinforcement and back-out behavior. Journal of Marketing
Research, 7(3), 399–400.
Ehrlich, D., Guttman, I., Schönbach, P., & Mills, J. (1957).
Postdecision exposure to relevant information. The Journal of
Abnormal and Social Psychology, 54(1), 98–102.
Epstude, K., & Roese, N. J. (2008). The functional theory of
counterfactual thinking. Personality and Social Psychology
Review, 12(2), 168–192.
Hey, J. D. (1987). Still searching. Journal of Economic Behavior
& Organization, 8(1), 137–144.
Ferguson, T. S. (1989). Who solved the secretary
problem?. Statistical Science, 4(3), 282–289.
Freeman, P. R. (1983). The secretary problem and its extensions: A
review. International Statistical Review/Revue Internationale
de Statistique, 51(2), 189–206.
Gigerenzer, G. (2004). Fast and frugal heuristics: The tools of bounded
rationality. In D.J. Koehler & N.Harvey (Eds.), Blackwell
handbook of judgment and decision making (pp. 62–88). Oxford, United
Kingdom: Blackwell.
Gilbert, J. P., & Mosteller, F. (2006). Recognizing the maximum of a
sequence. In Selected Papers of Frederick Mosteller (pp.
355–398). Springer New York.
Hills, T.T., Todd, P.M., and Goldstone, R.L. (2008). Search in external
and internal spaces: Evidence for generalized cognitive search
processes. Psychological Science, 19(8), 802–808.
Kahan, J. P., Rapoport, A., & Jones, L. V. (1967). Decision making in a
sequential search task. Perception &
Psychophysics, 2(8), 374–376.
Kahneman, D., & Tversky, A. (1982). The psychology of
preferences. Scientific American, 246(1), 160–173.
Lee, D. L., O’Connor, T. A., & Welsh, M. B. (2004). Decision-making on
the full-information secretary problem. In K. Forbus, D. Gentner, &
T. Regier (Eds.), Proceedings of the 26th Annual Conference of
the Cognitive Science Society. Mahwah, NJ: Erlbaum.
Moraga-González, J. L., Sándor, Z., & Wildenbeest, M. R. (2015).
Consumer search and prices in the automobile market. IESE
Research Papers D/1123.
Palley, A. B., & Kremer, M. (2014). Sequential search and learning from
rank feedback: Theory and experimental evidence. Management
Science, 60(10), 2525–2542.
Petrocelli, J. V., Seta, C. E., & Seta, J. J. (2013). Dysfunctional
counterfactual thinking: When simulating alternatives to reality
impedes experiential learning. Thinking & Reasoning, 19(2),
205–230.
Pirrone, A., Stafford, T., & Marshall, J.A.R. (2014). When natural
selection should optimize speed-accuracy trade-offs. Frontiers
in Neuroscience, 8(April), 73. http://dx.doi.org/10.3389/fnins.2014.00073.
Rapoport, A., & Tversky, A. (1970). Choice behavior in an optional
stopping task. Organizational Behavior and Human
Performance, 5(2), 105–120.
Reb, J., & Connolly, T. (2009). Myopic regret avoidance: Feedback
avoidance and learning in repeated decision
making. Organizational Behavior and Human Decision
Processes, 109(2), 182–189.
Roets, A., & Van Hiel, A. (2011). Item selection and validation of a
brief, 15-item version of the Need for Closure
Scale. Personality and Individual Differences, 50(1),
90–94.
Sang, K., Todd, P.M., & Goldstone, R.L. (2011). Learning near-optimal
search in a minimal explore/exploit task. In Proceedings of the
Thirty-third Annual Conference of the Cognitive Science Society (pp.
2800–2805). Boston, MA: Cognitive Science Society.
Sang, K., Todd, P. M., Goldstone, R. L., & Hills,
T. T. (2018). Explore/exploit tradeoff strategies in a resource
accumulation search task. https://doi.org/10.31234/osf.io/zw3s8.
Schotter, A., & Braunstein, Y. M. (1981). Economic search: an
experimental study. Economic Inquiry, 19(1), 1–25.
Schwartz, B., Ward, A., Monterosso, J., Lyubomirsky, S., White, K., &
Lehman, D. R. (2002). Maximizing versus satisficing: Happiness is a
matter of choice. Journal of Personality and Social
Psychology, 83(5), 1178–1197.
Seale, D. A., & Rapoport, A. (1997). Sequential decision making with
relative ranks: An experimental investigation of the"
secretary problem". Organizational Behavior and
Human Decision Processes, 69(3), 221–236.
Seale, D. A., & Rapoport, A. (2000). Optimal stopping behavior with
relative ranks: The secretary problem with unknown population
size. Journal of Behavioral Decision Making, 13(4), 391–411.
Seiler, S. (2013). The impact of search costs on consumer behavior: A
dynamic approach. Quantitative Marketing and
Economics, 11(2), 155–203.
Shani, Y., Tykocinski, O. E., & Zeelenberg, M. (2008). When ignorance
is not bliss: How feelings of discomfort promote the search for
negative information. Journal of Economic
Psychology, 29(5), 643–653.
Shani, Y., & Zeelenberg, M. (2007). When and why do we want to know?
How experienced regret promotes post-decision information
search. Journal of Behavioral Decision Making, 20(3),
207–222.
Sherman, S. J., & McConnell, A. R. (1995). Dysfunctional implications
of counterfactual thinking: When alternatives to reality fail us. In
N.J. Roese & J.M. Olson (Eds.), What might have been: The
social psychology of counterfactual thinking (pp. 199–231). Mahwah,
NJ: Erlbaum.
Summerville, A. (2011). Counterfactual seeking the scenic overlook of
the Road not taken. Personality and Social Psychology
Bulletin, 37(11), 1522–1533.
Teodorescu, K., & Erev, I. (2014). On the decision to explore new
alternatives: The coexistence of under-and
over-exploration. Journal of Behavioral Decision
Making, 27(2), 109–123.
Teodorescu, A. R., Moran, R., and Usher, M. (2016). Absolutely relative
or relatively absolute: violations of value invariance in human
decision making. Psychonomic Bulletin and Review, 23(1),
22–38..
Todd, P. M., Hills, T. T., Robbins, T. W., & Lupp, J. (Eds.) (2012).
Cognitive search: Evolution, algorithms, and the brain (Vol.
9). MIT Press.
Verplanken, B., Hazenberg, P. T., & Palenewen, G. R. (1992). Need for
cognition and external information search effort. Journal of
Research in Personality, 26(2), 128–136.
Zeelenberg, M. (1999). The use of crying over spilled milk: A note on
the rationality and functionality of regret. Philosophical
Psychology, 12(3), 325–340.
Zeelenberg, M., & Pieters, R. (2007). A theory of regret regulation
1.0. Journal of Consumer Psychology, 17(1), 3–18.
Zwick, R., Rapoport, A., Lo, A. K. C., & Muthukrishnan, A. V. (2003).
Consumer sequential search: Not enough or too much? Marketing
Science, 22(4), 503–519.
Appendix 1- generation of card values:
Preliminary study
Stimuli (deck cards’ values)
: During the task, for each deck,
card values were sampled with replacement from a uniform distribution
[X, X+D]. The distribution’s parameters were determined for each
participant at the beginning of the experiment: X was drawn from
[0,50,100, 150, …. , 1300], and D was drawn from [60, 480]. The
distribution’s parameters, X and D were drawn independently for each
deck (except of dark colored decks, see below) and without replacement.
However, black and white decks were set at the middle of possible range
both for X and D. This was done to make sure that differences between
the repeat and no-repeat conditions, if any, will not be a result of
extreme parameters values for the repeated decks. For dark colored
decks, the values of X and D were independently matched to the ones
selected for the light color decks, again, to rule out differences
between the two information conditions driven by the distribution
parameters. Accordingly, there were 2 distributions at the middle range
of possible values (the black and white decks), 24 other unique
distributions for colored decks with information (light colored decks)
and another 24 distributions for colored decks without information
(dark colored decks) which overall included the same X and D values as
for colored decks with information but were not exactly the same
distributions (X and D were matched independently).
Study 1
Stimuli (deck cards’ values).
During the task, for each deck,
card values were sampled with replacement from a uniform distribution
[X, X+D]. The distribution’s parameters were determined for each
participant at the beginning of the experiment: Every round was given a
random number between 1 to Nrounds without replacement (Nrounds=96 for
15 participants and Nrounds=100 for all other participants). This
number was multiplied by 50 to determine X (the starting point of the
distribution). Accordingly, X was drawn from [50,100, 150, ….
Nrounds*50]. D was drawn from [60, Nrounds*10]. The distribution’s
parameters, X and D were drawn independently for each deck without
replacement.
Study 2
Stimuli (deck cards’ values).
the distributions’ parameters
were determined before the beginning of the experiment, and were the
same for all participants in this study (randomly ordered, within each
block). There were 60 unique decks (DeckID 1–60) with minimal values
50, 100, 150…, 3000 (DeckID*50). Each block (Test 1 / Training) was
designed to include one third low decks (DeckID 1–20), one third medium
decks (DeckID 21–40) and one third high decks (DeckID 41–60). The range
(maximal value-minimal value) was randomly and independently (with
replacement) selected from U[60,1200]. Test 2 decks were given the same
DeckIDs as Test 1, but to make Test 2’s decks unique (in the sense that
they are not exactly the same decks as in Test1), we added to or
subtracted from the decks minimal values 2–6 points (randomly allocated
to the 15 decks with the constrain that all additions/subtractions will
sum up to zero). Ranges were kept the same.
The results of the above algorithm are presented in the table below
(with the training on the next page). Notice that all participants
experienced the same 75 decks, but the order within each block (Test1
/ Training / Test 2) was randomly determined at the beginning of the
task for each participant separately.
| | Value environment | DeckID | DeckMin | DeckRange | | DeckMax |
| Test 1 |
| 1 | med | 26 | 1300 | 227 | | 1527 |
| 2 | med | 35 | 1750 | 629 | | 2379 |
| 3 | low | 10 | 500 | 93 | | 593 |
| 4 | med | 29 | 1450 | 1102 | | 2552 |
| 5 | high | 45 | 2250 | 85 | | 2335 |
| 6 | low | 13 | 650 | 1173 | | 1823 |
| 7 | low | 5 | 250 | 694 | | 944 |
| 8 | high | 51 | 2550 | 273 | | 2823 |
| 9 | med | 32 | 1600 | 149 | | 1749 |
| 10 | high | 58 | 2900 | 712 | | 3612 |
| 11 | low | 7 | 350 | 287 | | 637 |
| 12 | med | 25 | 1250 | 976 | | 2226 |
| 13 | high | 48 | 2400 | 904 | | 3304 |
| 14 | low | 11 | 550 | 831 | | 1381 |
| 15 | high | 56 | 2800 | 1115 | | 3915 |
| Test 2 |
| 61 | med | 26 | 1303 | 227 | | 1530 |
| 62 | med | 35 | 1747 | 629 | | 2376 |
| 63 | low | 10 | 503 | 93 | | 596 |
| 64 | med | 29 | 1456 | 1102 | | 2558 |
| 65 | high | 45 | 2253 | 85 | | 2338 |
| 66 | low | 13 | 647 | 1173 | | 1820 |
| 67 | low | 5 | 256 | 694 | | 950 |
| 68 | high | 51 | 2547 | 273 | | 2820 |
| 69 | med | 32 | 1596 | 149 | | 1745 |
| 70 | high | 58 | 2906 | 712 | | 3618 |
| 71 | low | 7 | 346 | 287 | | 633 |
| 72 | med | 25 | 1248 | 976 | | 2224 |
| 73 | high | 48 | 2396 | 904 | | 3300 |
| 74 | low | 11 | 548 | 831 | | 1379 |
| 75 | high | 56 | 2798 | 1115 | | 3913 |
| | Value environment | DeckID | DeckMin | DeckRange | | DeckMax |
| Training |
| 16 | med | 22 | 1100 | 193 | | 1293 |
| 17 | low | 3 | 150 | 124 | | 274 |
| 18 | low | 17 | 850 | 1125 | | 1975 |
| 19 | high | 54 | 2700 | 318 | | 3018 |
| 20 | med | 33 | 1650 | 392 | | 2042 |
| 21 | med | 21 | 1050 | 184 | | 1234 |
| 22 | high | 42 | 2100 | 553 | | 2653 |
| 23 | low | 8 | 400 | 383 | | 783 |
| 24 | high | 47 | 2350 | 934 | | 3284 |
| 25 | med | 24 | 1200 | 192 | | 1392 |
| 26 | high | 60 | 3000 | 824 | | 3824 |
| 27 | low | 19 | 950 | 795 | | 1745 |
| 28 | med | 23 | 1150 | 498 | | 1648 |
| 29 | low | 15 | 750 | 89 | | 839 |
| 30 | med | 31 | 1550 | 746 | | 2296 |
| 31 | med | 40 | 2000 | 667 | | 2667 |
| 32 | high | 49 | 2450 | 1081 | | 3531 |
| 33 | high | 41 | 2050 | 428 | | 2478 |
| 34 | low | 1 | 50 | 187 | | 237 |
| 35 | med | 27 | 1350 | 1077 | | 2427 |
| 36 | high | 55 | 2750 | 913 | | 3663 |
| 37 | high | 59 | 2950 | 98 | | 3048 |
| 38 | low | 4 | 200 | 1112 | | 1312 |
| 39 | med | 39 | 1950 | 914 | | 2864 |
| 40 | low | 14 | 700 | 564 | | 1264 |
| 41 | med | 37 | 1850 | 612 | | 2462 |
| 42 | low | 6 | 300 | 112 | | 412 |
| 43 | high | 50 | 2500 | 1040 | | 3540 |
| 44 | low | 20 | 1000 | 403 | | 1403 |
| 45 | high | 57 | 2850 | 307 | | 3157 |
| 46 | med | 28 | 1400 | 813 | | 2213 |
| 47 | high | 43 | 2150 | 715 | | 2865 |
| 48 | low | 9 | 450 | 987 | | 1437 |
| 49 | med | 36 | 1800 | 586 | | 2386 |
| 50 | high | 53 | 2650 | 281 | | 2931 |
| 51 | med | 34 | 1700 | 956 | | 2656 |
| 52 | med | 38 | 1900 | 266 | | 2166 |
| 53 | low | 12 | 600 | 961 | | 1561 |
| 54 | low | 2 | 100 | 374 | | 474 |
| 55 | high | 46 | 2300 | 147 | | 2447 |
| 56 | med | 30 | 1500 | 1097 | | 2597 |
| 57 | low | 16 | 800 | 1082 | | 1882 |
| 58 | high | 44 | 2200 | 1025 | | 3225 |
| 59 | low | 18 | 900 | 887 | | 1787 |
| 60 | high | 52 | 2600 | 542 | | 3142 |
Appendix 2 – the distribution of thresholds and original results in
Study 2 (before modification of extreme thresholds)
The table below provides descriptive statistics of the distribution of
thresholds:
| N | 86,114 |
| Mean | 2,391.8 |
| Std. Dev. | 5,462.9 |
| Variance | 29,843,283.8 |
| Skewness | 98.9 |
| Kurtosis | 12,878.3 |
| Min | 0 |
| P1% | 0 |
| P5% | 300 |
| P10% | 510 |
| P25% (Q1) | 1,285 |
| P50% (Median) | 2,200 |
| P75% (Q3) | 3,000 |
| P90% | 3,650 |
| P95% | 5,000 |
| P99% | 10,000 |
| Max | 788,780 |
The graphs below present the means and SEs before coding extreme
thresholds at the beginning of the round as data collection. Using
extreme thresholds instead of the data collection option distort three
main variables: data collection, first threshold and thresholds
updating. As can be seen here (compared with Figure 5 in text),
participants in the With-Post group apparently used this strategy more:
while the green bars (No-Post group) remain relatively the same,
inclusion of extreme thresholds in the With-Post group (blue bars)
reveal less data collection (1 card less on average), higher first
thresholds (more 500–1500 on average) and quicker updating rate of
thresholds (evident especially during the training).
The main reason for the last result (extremely quicker updating during
the training of the With-Post group) seems to be one participant, who
typed during training extremely extreme thresholds (above 700,000)
instead of using the data collection option. Figure 5 in text, presents
the means after recoding extreme thresholds as data collection.
Notably, the strategy of typing in extreme threshold instead of using
the data collection option was not a strategy only used by a very few
participants. In fact, 34 participants (about 35%) used this strategy
at least once, out of which 6 participants (about 5%) used this
strategy quite frequently (more than 200 extreme thresholds). Looking
at those extreme thresholds as representing data collection behaviors
solved the problems above and the data makes more sense after this
change. However, it is important to note that using extreme thresholds
is not necessarily a bad strategy. Although typing in a large number
demands more effort than pressing the “data collection” key, it enables
the (unlikely) event of a huge gain, that will otherwise be missed.
Such an event was not possible in the current task, but it is not very
difficult to find examples in real life: for example, a huge discount
for the first buyers of a product, as a way to promote sales is
relatively common.
This document was translated from LATEX by
HEVEA.