Judgment and Decision Making, Vol. 15, No. 2, March 2020, pp. 230-245
Gaze patterns disclose the link between cognitive reflection and sophistication in strategic interaction
Joshua Zonca*
Giorgio Coricelli#
Luca Polonio$
|
In social contexts, we refer to strategic sophistication as the ability to
adapt our own behavior based on the possible actions of others. In the
current study, we explore the role of other-oriented attention and
cognitive reflection in explaining heterogeneity in strategic
sophistication. In two eye-tracking experiments, we registered eye
movements of participants while playing matrix games of increasing
relational complexity (2x2 and 3x3 matrices), and we analyzed individual
gaze patterns to reveal the ongoing mechanisms of integration of own and
others’ incentives in the current game representation. Moreover,
participants completed the Cognitive Reflection Test (CRT), in addition to
alternative measures of cognitive ability.
In both classes of games, higher cognitive reflection
levels specifically predict the ability to incorporate the counterpart’s
incentives in the current model of the game, as well as higher levels of
strategic sophistication. Conversely, players exhibiting low cognitive
reflection tend to pay less attention to relevant transitions between the
counterpart’s payoffs, and such incomplete visual analysis leads to
out-of-equilibrium choices. Gaze patterns appear to completely mediate the
relationship between cognitive reflection and strategic choices. Our
results shed new light on the cognitive factors driving heterogeneity in
strategic thinking and on theories of bounded rationality.
Keywords: strategic sophistication, cognitive reflection, gaze patterns, game representation, bounded rationality
1 Introduction
In our everyday experience, we often face situations in which the outcome
of our decisions is influenced by the decisions of other agents. In this
context, it is important to understand others’ goals and intentions to
predict their actions, an ability that is referred to as “mentalizing” or
“Theory of Mind” (ToM, Premack & Woodruff, 1978). Nonetheless,
accumulating experimental evidence has shown that agents are often
non-strategic. They also deviate from the Nash equilibrium strategies
(Grosskopf & Nagel, 2008), which postulate perfect self-interested
rationality of players that have consistent beliefs about others’ behavior
and select the best action given their expectations (Mailath, 1998).
In order to account for the heterogeneity observed in interactive games,
behavioral models of strategic thinking such as Level-K (Crawford, 2003;
Crawford et al., 2013; Nagel, 1995; Stahl & Wilson, 1995) and Cognitive
Hierarchy (CH, Camerer et al, 2004; Chong et al., 2016; Ho et al., 1998)
allowed more flexibility in players’ beliefs, modelling behavior in terms
of hierarchical levels of strategic thinking (Nagel, 1995). These models
describe the strategy space of players building a hierarchical structure
that predicts, at the bottom, players who play randomly (level-0). The
second step in the hierarchy corresponds to level-1 players, who best
respond to the belief that the counterparts are level-0; the following step
predicts level-2 players, who best respond to the belief that the opponents
are level-1 (in Level-k theory) or a mixture between level-0 and level-1
(in Cognitive Hierarchy theory), and so on, increasing the number of steps
of strategic thinking. Behavioral models of strategic thinking therefore
assume that each player has to estimate the level of rationality of the
other agents involved in the interaction (Pantelis & Kennedy, 2017).
These models offer an elegant description of the heterogeneity observed in
interactive decisions, but do not provide a cognitive explanation of the
factors modulating this variability. For instance, it is not clear if
agents applying few steps of strategic thinking believe that the other
players are boundedly rational and therefore best-respond to this belief,
or whether they are boundedly rational themselves (Goodie et al., 2012;
Grosskopf and Nagel, 2008). In this regard, one of the crucial components
of mentalizing concerns the constructions of an exhaustive and correct
mental model of the decision space of the counterpart, in order to predict
her next action and therefore best-respond to it (Hedden & Zhang,
2002). However, some experimental evidence suggests that deviations from
normative responses in strategic interaction depend on poor game
representations. These misrepresentations may arise from the generation of
a miserly model of the opponent’s incentives and potential moves (Verbrugge
et al., 2018), the relational structure of the game payoffs (Devetag &
Warglien, 2008), or the relationships between own and other’s potential
actions and outcomes (Rydval et al., 2009). In other words, if agents do
not incorporate specific chunks of information (e.g., the incentives of the
opponent) in their model of the strategic environment, or if they integrate
them inaccurately with other available information, they would be unlikely
to achieve optimal game solutions (Kreps, 1990).
1.1 Gaze patterns and game representation
Given the importance of mechanisms of information encoding and
representation in strategic interaction, process-tracing research has
recently explored processes of game (mis)representation by observing the
patterns of information acquisition characterizing game
playing. Costa-Gomes et al. (2001) used mouse-tracking to disclose the
processes of information search in normal form games, identifying nine
strategic types of player. A relevant proportion of these participants
exhibited choices and information acquisition patterns consistent with
predictions of level-k models. Hristova & Grinberg (2005) showed that
cooperative behavior in a Prisoner Dilemma (PD) game was linked to the
distribution of attention between payoffs matrix and opponent’s moves. In
two mouse-tracking experiments, Brocas et al. (2014, 2018) showed that
failure to look at required pieces of information predicts
out-of-equilibrium play in private information games (Brocas et al., 2014)
and sequential and simultaneous dominance solvable games of complete
information (Brocas et al., 2018).
Polonio et al. (2015) used eye-tracking to cluster participants in types
of player depending on their frequency distribution of classes of
transitions connecting matrix payoffs. The cluster analysis returned three
categories of player: 1) players focusing on their own payoffs, 2) players
mostly performing intra-cell comparisons, and 3) players with distributed
attention. The two former types did not perform the payoff comparisons
necessary for individuating the equilibrium strategy. In particular,
players focusing on own payoffs did not incorporate the possible actions of
the opponent in their decision model and chose in accordance to the
expected strategy of a Level-1 (L1) player, who responds to the belief that
the opponent does not have a preferred action. Players that focused on
intra-cell comparisons did considered opponents’ payoffs, but framed the
problem as a pure coordination game, disregarding dominant choices of the
opponent. In contrast, both visual analysis and choices of the latter type
of player were consistent with the expected behavior of a Level-2 (L2)
player, who assumes that the counterpart is a L1 player and, given such
belief, best responds to the expected counterpart’s
action.1 Altogether, these results suggest that some players
systematically misrepresent and simplify interactive problems by
disregarding those payoff comparisons that are necessary for mentalizing
and strategic thinking. Importantly, game misrepresentation leads to
deviation from game-theoretical equilibrium choices, supporting the idea
that the internal representation of the game structure is a crucial
component of the interactive decision process.
1.2 Cognitive abilities, game representation and strategic
sophistication
Recent experimental research has asked whether specific cognitive factors
could explain individual differences in strategic sophistication. Several
studies have indeed shown correlations between behavior in games and
different measures of cognitive ability and executive functions (Burks et
al., 2009; Burnham et al., 2009; Gill & Prowse, 2016). The Cognitive
Reflection Test (CRT, Frederick, 2005) has been particularly successful in
explaining choices in several interactive games, including the Beauty
Contest Game (Carpenter et al., 2013; Fehr & Huck 2016; Brañas-Garza et
al., 2012), the Hit 15 game (Carpenter et al., 2013), bank-run games (Kiss
et al., 2016) and matrix games (Georganas et al., 2015; Hanaki et al.
2016). The CRT assesses individual differences in cognitive style:
particularly the tendency to rely more on either reflective or intuitive
cognitive processes (Alós-Ferrer et al., 2016; Baron et al., 2014; Mata et
al., 2013; Szaszi et al., 2017). High cognitive reflection levels have also
been linked to the tendency to use more thorough search processes (Cokely
& Kelley, 2009; Cokely et al., 2009) and to the ability to accurately
process and represent task-relevant information (Mata et al., 2014; Sirota
et al., 2014). Moreover, the CRT is related to analytical thinking (Hoppe
& Kusterer, 2011), behavioral biases (Oechssler et al., 2009),
probabilistic reasoning (Koehler & James, 2010; Liberali et al., 2012) and
rule abstraction (Don et al., 2016). Conversely, a low cognitive reflection
level is associated with miserly information processing (Toplak et al.,
2014). Taken together, these findings indicate involvement of cognitive
reflection in the processes of information encoding, integration and
representation underlying judgment and decision making tasks. In the
context of strategic interaction, we therefore hypothesize that cognitive
reflection may specifically modulate mechanisms of information processing
underlying game representation, which in turn predict the level of
sophistication in strategic interaction.
To test this hypothesis, we conducted two eye-tracking experiments
involving matrix games between two players. Matrix games consist in a set
of incentives (i.e., payoffs) and an action set for each player: the
combination of players’ decisions therefore determines their respective
outcomes. Games were one-shot, meaning that participants did not receive
any feedback about the action of the opponent and the game outcome after
their choice in each game. In Experiment 1 participants played 2x2 matrix games, while
in Experiment 2 we increased game complexity introducing 3x3 matrices.
Experiment 2 was designed to explore the generalizability of the effect of
cognitive reflection on game play, and investigate whether game complexity
could affect the hypothesized relationship between cognitive
reflection and game representation. We analyzed participants’ gaze
patterns to reveal the type of game representation that they were
building, and administered the Cognitive Reflection Test (CRT) to obtain
individual measures of cognitive reflection. Additional measures of fluid
intelligence and working memory abilities were collected to investigate
the cognitive specificity of the role of cognitive reflection in
modulating game representation processes and strategic sophistication.
Both experiments are based on the same analysis structure. First, we
tested whether cognitive reflection predicts strategic choices and
hierarchical levels of strategic thinking in games. Second, we explored
the relationship between game representation and strategic behavior by
looking for gaze patterns of information acquisition that could predict the
level of sophistication in strategic choices. Third, we explored the
relationship between patterns of information acquisition and cognitive
reflection. Finally, we tested whether gaze patterns mediate the
relationship between cognitive reflection and choices.
2 Experiment 1
2.1 Methods
2.1.1 Participants and procedure
Participants were 48 students from the University of Trento, Italy (34
females, mean age 23.02, SD 2.84). The study was approved by the local
ethics committee and all participants gave informed consent. Participants
performed thirty-two 2x2 one-shot matrix games. Before playing the games,
they were instructed on the procedure and were provided with examples and
training trials (4 games). Moreover, we administered control questions to
participants to verify that they have fully understood task and procedure
of payment. If participants failed to answer control questions,
instructions were repeated (detailed instructions and control
questionnaires are reported in section C.1 of the Appendices). All
participants played in the role of row player2 and were instructed
to choose between row I and row II by key-press. The order of games was
randomized for each participant. Each game was played only once and no
feedback was provided at the end of games. Trials were preceded by a
fixation-point positioned in one of four possible locations outside the
matrix. At the end of the experimental session, three games were randomly
selected and the player’s choice in each game was paired with the choice
of another player in that very same game. Participants received the sum of
the outcomes of the three games in euros (from 3 to 27 euros).
In addition to 2x2 games, all participants took the Cognitive Reflection
Test (CRT, Frederick, 2005) and additional cognitive tests of fluid
intelligence and working memory in order to test the specificity of the
effect of cognitive reflection. Fluid intelligence was assessed using a
time-limited version (Schmittmann, 2006) of the Raven Advanced Progressive
Matrices Test (APM; Raven et al., 1998). Working memory measures included
digit span forward and backward (Wechsler, 2008) and the n-back task
(Kirchner et al., 1958). Forward digit span measures abilities in simple
short-term maintenance and recall of digits, while the backward span
requires an additional component of mental manipulation of elements
(Baddeley, 1996; Monaco et al., 2013). The n-back task assesses the ability
to actively maintain and update information in working memory, and targets
mechanisms linked to executive control such as inhibition and interference
resolution (Kane et al., 2007). We report the exact procedure of these
control cognitive tests in section A.1 of the Appendices.
2.1.2 2x2 Matrix games
In the current work, we used games characterized by a unique game
theoretical optimal solution, which is commonly described using the
concept of Nash equilibrium (Nash, 1950). Nash equilibrium is a game
solution in which none of the players has a self-interested incentive to deviate from its
own strategy after considering the counterpart’s choice. In Experiment 1,
we used a particular class of game called dominance-solvable.
These games contain an option which is better than another one for a
player, independently of the action the counterpart will take. We refer to
this option as a dominant strategy.3
In Experiment 1, we used two classes of dominance-solvable games
characterized by different equilibrium structures, creating sixteen 2x2
games for each class (for a full list of game matrices, see Figure A1 in
section A.1, Appendices). The two classes of games (Figure 1) were: (1)
dominance solvable “self” games (DSS), in which only the participant had a
strictly dominant strategy; (2) dominance solvable “other” games (DSO), in
which only the opponent had a strictly dominant strategy.
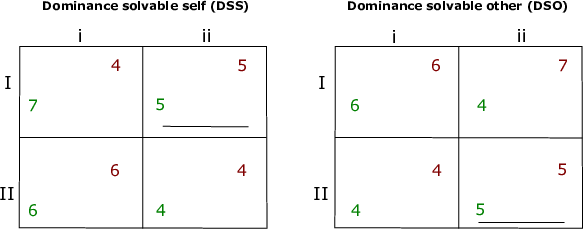
| Figure 1: Examples of dominance solvable self (DSS) and dominance solvable
other (DSO) games. All participants played in the role of row players. In
this example, we report two isomorphic games in which row and column
payoffs are identical but switched. The line in one of the cells of each
matrix signals the equilibrium solution of the game. Taking the perspective
of a row player, the DSS game shown in the current figure contains a
strictly dominant strategy (option I): in fact, it returns a higher payoff
than option II independently of the column player’s choice. Given this
dominant strategy, the column player optimizes its payoff by choosing
option ii. In the DSO game, the column player has a strictly dominant
strategy (option ii) and the row player would best respond by choosing
option II. The black lines represent Nash equilibria. |
Both types of dominance-solvable game had a unique pure strategy Nash
equilibrium that always coincide with level-2 play in hierarchical models
of strategic thinking. DSO games differ from DSS games because the
equilibrium solution requires two steps of iterated elimination of dominant
strategies that include the evaluation of the counterpart’s incentives
(first, individuating the strict dominance of the counterpart; second,
choosing the best response given the opponent’s dominant choice). In
contrast, the equilibrium solution in DSS games needs only one step of
iterated elimination of dominant strategies between participant’s own
possible choices and therefore does not even require the evaluation of the
counterpart’s incentives. For this reason, only DSO games require strategic
sophistication for the equilibrium strategy. Games within a class could
vary in terms of magnitude of payoffs and location of the payoffs in the
matrix, but maintained the described relations of dominance between
choices.
2.1.3 Eye-tracking procedure
While playing matrix games, participants were seated in a chair with a soft
head restraint to ensure a viewing distance of 55 cm. from a monitor with
1920 x 1080 resolution. Presentation of the stimuli was performed using a
custom-made program implemented using Matlab Psychtoolbox. Eye movements
were monitored and recorded using a tower mounted Eyelink 2000 system (SR.
Research Ontario Canada) with a sampling rate of 2000 Hz. In matrix games,
we used a calibration with 13 points: points were placed in the exact
locations of payoffs, at the center of the matrix and in the four possible
locations of the fixation cross. After the calibration phase, a validation
phase was performed to make sure that the calibration was accurate. The
position of points in the validation phase was identical to the one in the
calibration phase. Re-calibrations and re-validation were performed if
these had been unsuccessful. Before the beginning of each trial, a drift
correction was performed in order to control that participants look at the
current fixation location; stimuli were presented after the fixation point
was fixated for 300 milliseconds. Stimuli were placed at an optimal
distance between each other in order to precisely distinguish
goal-directed saccades and fixations.
2.1.4 Gaze data analysis
Following the eye-tracking analysis performed by Polonio and colleagues
(2015), we defined eight regions of interest (ROIs), centered on the
matrix payoffs. All the ROIs had a circular shape with a size of 36000
pixels. The ROIs covered only 23% of the game matrix area and did not
overlap. All the fixations that did not fall within any ROIs were
discarded. However, although a consistent portion of the matrix was not
included in any of the ROIs, the large majority of fixations (87.4%) were
located inside the ROIs.
We focused on two main types of gaze data analysis: fixation and transition
analysis.4
On the one hand, fixation analysis can reveal with extremely high accuracy
which piece of information is being processed in a specific time unit (De
Neys & Osman, 2013). In the current experiment, fixation analysis was
useful to explore, for each player, the distribution of attention between
own and other’s payoffs, revealing in what measure players incorporate
others’ incentives in their model of the interactive problem.
On the other hand, transitions express eye movements (i.e., saccades) from
one payoff (AOI) to the next. Saccades are generally thought to reflect a
direct an obligatory consequence of overt attentional shifts (e.g., Deubel
& Schneider, 1996; He & Kowler, 1992; Hoffman & Subramaniam, 1995).
These top-down attentional shifts occur when the processing of the
attended item reaches some critical level, triggering the visual system to
prepare a motor program enabling a saccade towards the next target (De
Neys & Osman, 2013). In the context of matrix games, transitions
specifically provide information about the pieces of information that
participants were comparing and therefore incorporating in their model of
the interactive problem. In particular, we considered those transitions
that were useful to extract information about the structure of the payoff
matrix and build a representation of the current game.5 In
order to explore the type of visual analysis performed by participants,
transitions were divided in five major types (Figure 2), following the
classification of Devetag and colleagues (2016):
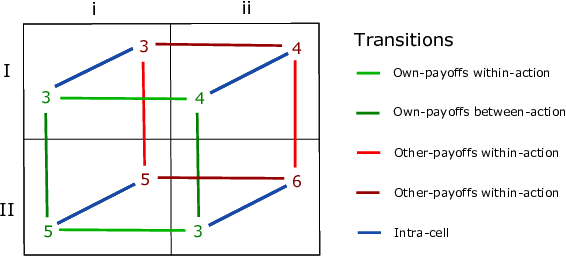
| Figure 2: Relevant types of transitions between payoffs. The direction of
the transition from one payoff to the other is irrelevant for
classification. |
1) own-payoffs within-action transitions: transitions between player’s own
payoffs within a single row (necessary to identify the action with the
highest average payoff).
2) own-payoffs between-action transitions: transitions between player’s own
payoffs within a single column (necessary to identify the presence of own
dominant choices).
3) other-payoffs within-action transitions: transitions between the
counterpart’s payoffs within a single column (necessary to identify the
counterpart’s choice with the highest average payoff).
4) other-payoffs between-action transitions: transitions between the
counterpart’s payoffs within a single row (necessary to identify the
presence of counterpart’s dominant choices).
5) intra-cell transitions: transitions between the payoffs of the two
players, within the same cell (necessary to compare the two players’
payoffs given a specific combination of choices).
2.2 Hypotheses
In Experiment 1, we asked whether cognitive reflection modulates attentional
mechanisms underlying representation building, as expressed by gaze
patterns, and individual levels of strategic sophistication in 2x2 games.
Behaviorally, we expect high CRT players to show higher levels of
strategic thinking (i.e., level-2) in the framework of the Cognitive
Hierarchy model. High CRT players should therefore play more often the
equilibrium strategy, which is optimal (in our 2x2 games) in response to a
typical population whose strategic level ranges between level-1 and
level-2 (Camerer et al., 2004). This behavioral effect should emerge in
DSO games, which require strategic sophistication and can reveal choice
differences between players characterized by different levels of strategic
thinking (e.g. level-1 and level-2).
At the same time, we expect the CRT score to predict sophistication in the
visual analysis of the game matrix. We do not predict differences between
DSS and DSO games, since previous results (Polonio et al., 2015) have
shown that the visual analysis of game matrices is consistent across
classes of games: this hypothesis is in line with the idea that the visual
analysis of the game matrix is controlled by a top-down modulation of
attention. We hypothesize high CRT players to exhibit the typical gaze
patterns of more sophisticated types of players (Costa-Gomes et al., 2001;
Devetag et al., 2016; Polonio et al., 2015; Polonio & Coricelli, 2019).
In particular, high CRT players should make a higher proportion of
other-payoff within-action transitions, suggesting the attempt to form
precise (non-diffuse) beliefs about the expected action of the
counterpart, and to identify the counterpart’s action with the highest
average payoff. This is consistent with the expected behavior of a level-2
player that aims to best respond to the predicted action of a level-1
player (Bhatt & Camerer, 2005; Costa-Gomes et al., 2001). On the
contrary, we expect low CRT players to rely on a less exhaustive game
representation that does not incorporate the evaluation of other’s
incentives to predict her move and therefore implement recursive strategic
thinking. Finally, we hypothesize that the relationship between CRT score
and strategic choices is mediated by the level of sophistication of the
visual analysis of the payoff matrix.
2.3 Results
2.3.1 Behavioral results
As expected, the proportion of equilibrium responses in DSO games is
significantly lower than in DSS games (DSS: M = 0.85, SD = 0.17; DSO: M =
0.56, SD = 0.22, Wilcoxon matched-pairs signed-rank test, z = 5.21, effect
size (r) = 0.75, p < .001). These results confirm that
heterogeneity in strategic sophistication emerges in those games in which
taking into account the possible incentives of others is fundamental.
2.3.2 Cognitive
reflection and strategic sophistication
First, we investigated the relationship between cognitive reflection and
the proportion of Nash equilibrium choices in DSO games, where strategic
sophistication is required to find the optimal solution. In order to
evaluate the specificity of the effect of cognitive reflection on
strategic choices, we ran a stepwise backward regression (Draper & Smith,
1998; Efroymson, 1960; Hocking, 1976) on the average proportion of
equilibrium responses in DSO games including the CRT score, the Raven
score and the three measures of working memory as independent
variables.6
Results indicate that the model that best predicts the proportion of
equilibrium choices included only the CRT score (R2 =
.11, F (1, 46) = 5.59, B = 0.33, p = .022), while we did not find any
effect of fluid intelligence or working memory on strategic behavior
(Variables excluded from the model: Raven score, digit span forward, digit
span backward, n-back score: p > .05).7 As expected, cognitive reflection does not affect
the proportion of equilibrium responses in DSS games (B = 0.06,
p = .709), where strategic sophistication is not needed.8 These results highlight the crucial role of
cognitive reflection in strategic thinking.
| Table 1: For each CRT group, we report the parameter τ (CH), which
expresses the average group level of strategic thinking in the Cognitive
Hierarchy (CH) model, and the average proportion of equilibrium responses
in DSS and DSO games (standard deviations in brackets). |
| | | | Proportion of equilibrium responses |
CRT score | N | τ (CH) | DSS | DSO |
0 | 14 | 1 | 0.78 (0.19) | 0.48 (0.18) |
1 | 10 | 1.6 | 0.88 (0.13) | 0.58 (0.18) |
2 | 14 | 1.32 | 0.88 (0.14) | 0.50 (0.23) |
3 | 10 | 2.26 | 0.86 (0.18) | 0.74 (0.21) |
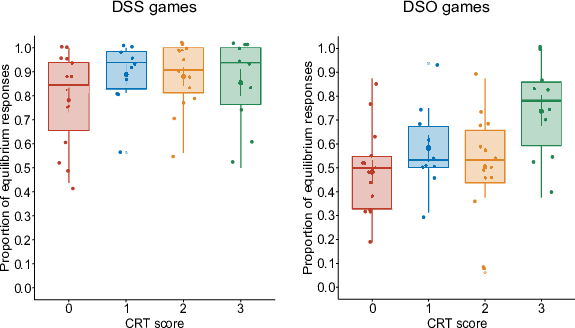
| Figure 3: Boxplots of proportion of equilibrium choices in DSS and DSO
games by CRT score. |
Then we tested whether the CRT score was associated with the level of
strategic thinking predicted by the Cognitive Hierarchy (CH) model, which
describes interactive behavior by a hierarchy of decision rules differing
in the number (k) of steps of thinking used. In CH, the frequency
distribution f (k) of steps of players is assumed to be Poisson, and its
mean and variance is described by a single parameter τ . The higher
the τ of a population, the higher its level of strategic
sophistication. Therefore, we estimated τ for each of our CRT
groups, expecting the value of τ to increase along with the CRT
level. As expected, the higher the CRT level, the higher the free
parameter τ (CRT = 0, τ = 1; CRT = 1, τ = 1.6; CRT = 2,
τ = 1.32; CRT = 3, τ = 2.26). Interestingly, players with CRT
= 0 exhibit a τ parameter which expresses the expected behavior of a
L1 player, while players with CRT = 3 have a τ parameter reflecting
the strategy of a L2 player. Players with CRT = 1 and CRT = 2 lie in
between these two levels of strategic behavior. Results of the CH model
estimation show that cognitive reflection is indeed associated with level
of strategic thinking in our 2x2 games. In Table 1, for each CRT level, we
report the group level of strategic thinking (τ ) and the average
proportion of equilibrium responses. Figure 3 shows boxplots of
average proportion of equilibrium responses for each CRT level in DSS and
DSO games.
Moreover, we tested whether higher CRT levels are associated with higher
earnings. Specifically, we calculated the ‘Strategic IQ’, defined as the
magnitude of the expected payoffs of players given the frequency
distribution of actual choices of potential opponents (Bhatt & Camerer,
2005). In other words, the Strategic IQ expresses the optimality of a
strategy given the actual distribution of strategies among potential
opponents in the population. Results of a regression with Strategic IQ as
dependent variable and CRT as independent variable reveal that CRT score
is associated with the Strategic IQ (R2 = .17, F (1, 46)
= 9.42, B = 0.41, p = .004), suggesting that players with high cognitive
reflection use a strategy that is more efficient given the actual
distribution of level of strategic thinking in the pool (Figure
4). Taken together, these results highlight a robust link between
cognitive reflection and strategic sophistication.
| Table 2: Mixed-effects logistic model of equilibrium response, with subject
as random effect and the proportions of the five types of transitions as
independent variables |
Equilibrium response | B | SE | z | p | 95 % CI |
Own-payoffs within-action | -0.07 | 0.09 | -0.77 | .439 | -0.25 | 0.11 |
Own-payoffs between-action | 0.07 | 0.08 | 0.90 | .366 | -0.08 | 0.22 |
Other-payoffs within-action | 0.42 | 0.08 | 4.98 | <.001 | 0.25 | 0.58 |
Other-payoffs between-action | 0.10 | 0.07 | 1.43 | .153 | -0.04 | 0.24 |
Intra-cell | -0.21 | 0.10 | -2.23 | .025 | -0.40 | -0.03 |
N. obs. | 1536 | | | | | |
N. independent obs. | 48 | | | | | |
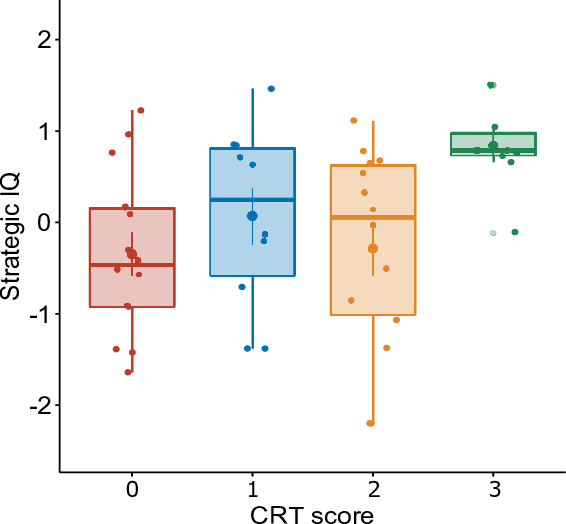
| Figure 4: Boxplots of strategic IQ by CRT score. |
2.3.3 Gaze patterns and choices
First, we tested whether the visual analysis of the game matrix is
dependent on the type of game (DSS or DSO). We ran a mixed-effects linear
model (subject as random effect) to identify potential interaction effects
between the game type and the five types of relevant payoff transitions.
Results do not show any effect of game type in any of the five types of
relevant transitions (Table A2 and A3 in section A.3, Appendices). These
results are in line with previous findings (Polonio et al., 2015),
suggesting that the visual analysis of the game matrix is modulated by
top-down attentional mechanisms that are independent of the current payoff
structure. For this reason, henceforth gaze patterns will be analyzed
independently of the type of game.
In order to identify the attentional indices able to predict strategic
sophistication, we ran a mixed-effects logistic regression with
equilibrium response as dependent variable, the proportions of the five
types of transition as independent variables and subject as random effect.
Results of the model (Table 2) show that strategic behavior is accompanied
by a higher proportion of other-payoffs within-action transitions (B =
0.42, p < .001) and a lower proportion of intra-cell transitions
(B = −0.21, p =.025). The implementation of other-payoffs within-action
transitions reflects the attempt at forming precise beliefs about the
opponent’s move by computing the expected value of each of her two
potential actions. This is consistent with the expected behavior of a
level-2 player that best responds to the belief that the counterpart is
level-1. Intra-cell transitions are consistent with the visual analysis of
players who aim to coordinate with the counterpart on a cooperative
solution and disregard dominant choices of the two players (Polonio et
al., 2015).
| Table 3: Multivariate regression with the average proportion of five types
of relevant transitions as dependent variable and CRT score as independent
variable. |
Proportion of transitions | B | SE | z | p | 95 % CI |
Own within-action | -0.09 | | 0.15 | | -0.60 | .549 | -0.38 | 0.21 |
Own between-action | 0.05 | | 0.15 | | 0.31 | .758 | -0.25 | 0.34 |
Other within-action | 0.46 | | 0.13 | | 3.54 | .001 | 0.20 | 0.73 |
Other between-action | 0.00 | | 0.15 | | 0.02 | .981 | -0.29 | 0.30 |
Intra-cell | -0.03 | | 0.15 | | -0.18 | .854 | -0.32 | 0.27 |
N. obs. | 48 | | | | | | |
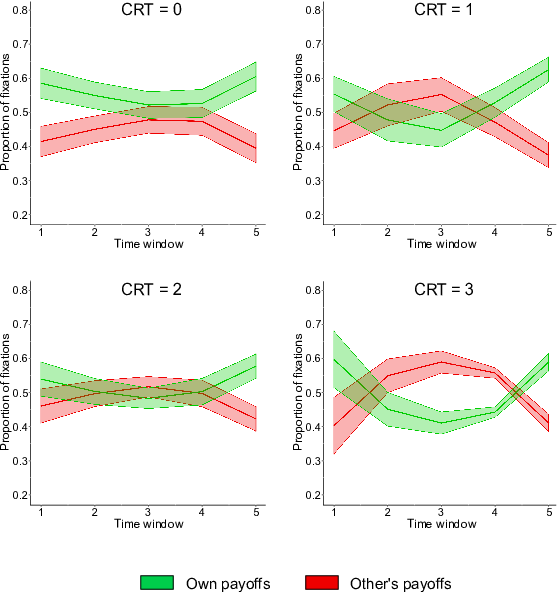
| Figure 5: Temporal evolution of proportion of own and other’s payoffs
fixations for each CRT level. In each trial, we assigned fixations to five
time intervals containing the same number of fixations Trial-by-trial
proportions of fixations were averaged for each participant and then
individual time courses were averaged across participants. Filled areas
around lines represent between-subject standard error of the mean (see
section A.2 of the Appendices for an exhaustive description of the temporal
analysis of fixations). |
2.3.4 CRT and gaze patterns
One of the main goals of the present work is to understand whether
cognitive reflection modulates the implementation of gaze patterns
underlying the construction of sophisticated game representations. We ran
a multivariate regression with our five types of transitions as dependent
variables and CRT as independent variable. Results show that CRT score
predicted the mean proportion of other-payoffs within-action transitions
(R2 = .21, F = 12.50, B = 0.46, p = .001, significant at
Bonferroni-corrected threshold. See Table 3), which we have previously
shown to predict the rate of equilibrium choices.9
In order to explore the cognitive specificity of this effect, we also ran
stepwise backward regressions including our fluid intelligence measures and
working memory measures as independent variables. Results indicate that
measures of fluid intelligence and working memory do not have any impact on
the average proportion of the five types of relevant transitions (APM,
digit span forward and digit span backward: p > .05). Results
are identical when running the same analyses separately for DSS (effect on
other-payoffs within-action transition — CRT: B = 0.44, p = .002; APM, digit
span forward and digit span backward: p > .05; no other
effects on transition types) and DSO (effect on other-payoffs within-action
transition — CRT: B = 0.45, p = .001; APM, digit span forward and digit span
backward: p > .05; no other effects on transition types),
suggesting that cognitive reflection regulates top-down attentional
mechanisms that in turn modulates the visual exploration of game matrices.
Figure 5 shows the time course of the distribution of attention
between own and other’s payoffs separately for each cognitive reflection
level. Low CRT players (CRT = 0) remained primarily focused on their own
payoffs during the entire time course of the game. Conversely, high CRT
players (CRT = 3) started focusing on own payoffs, then moved to evaluating
incentives of their counterpart, and finally they observed again their own
payoffs in order to best respond to the opponent’s predicted action. This
pattern is consistent with the temporal analysis exhibited by strategic
players reported in Polonio et al. (2015).
Results of a mixed-effects linear regression confirmed that the CRT level
modulates the selective increase of other’s player fixations in the middle
section of the trial (B = 0.40, p = .031) and not at the start and at the
end of the trial, when attention is mainly focused on players’ own
incentives for every CRT level (Start: B = 0.01, p = .942; End: B = 0.13, p
= .492). Crucially, the increase in the magnitude of attention towards the
counterpart’s incentives between the initial and the middle part of the
trial predicts the proportion of equilibrium responses in DSO games (B =
0.38, p = .008. See Section A.2 of the
Appendices for a
full description of the temporal analysis). Results of the temporal
analysis show that cognitive reflection modulates the players’ tendency to
switch attention towards the counterpart’s incentives after an initial
exploration of their own incentives.
2.3.5 CRT, gaze patterns and strategic choices: mediation
analysis
In the previous paragraphs, we have shown three main results:
-
Visual patterns of information acquisition predicts strategic
sophistication in 2x2 games.
- Cognitive reflection predicts strategic sophistication in 2x2 games.
- Cognitive reflection predicts visual patterns of information
acquisition in 2x2 games.
| Table 4: Results of Causal Mediation Analysis with proportion of
other-payoffs within-action transitions as a mediator, CRT score as
independent variable and proportion of equilibrium responses as dependent
variable. Only DSO games were considered for this analysis. |
| Effect | Estimated coefficient | 95% CI lower bound | 95% CI upper bound | p |
| Average causal mediation effect (ACME) | 0.19 | 0.07 | 0.39 | .002 |
| Average direct effect (ADE) | 0.14 | -0.13 | 0.37 | .295 |
| Total effect | 0.33 | 0.04 | 0.57 | .021 |
| Proportion mediated | 0.58 | 0.27 | 5.56 | .023 |
Afterwards, we asked whether the relationship between cognitive reflection
and strategic sophistication was mediated by visual analysis. We
considered only DSO games since we have previously shown that in these
matrices the CRT level affects both visual analysis and choices, while in
DSS games the CRT score does not modulate equilibrium choices, leaving no
room for a mediation effect. To test for the presence of a mediation
effect, we ran an additional linear regression with proportion of
equilibrium responses as dependent variable and CRT score and proportion of
other-payoffs within-action transitions as independent variables (Table A4
in section A.3,
Appendices). Interestingly,
the effect of CRT on equilibrium responses (observed in Table 1) disappears
after including the proportion of other-payoffs within-action transitions
as independent variable, indicating full mediation of visual analysis on
the relationship between cognitive reflection and strategic
sophistication. The mediated effect was tested for significance using the
“Mediation” R package (Imai et al., 2010). Confidence intervals were
calculated using the bias-corrected and accelerated bootstrap method (BCa)
(Di Ciccio & Efron, 1996), a procedure specifically recommended in
mediation analysis (Preacher & Hayes, 2008). As expected, the average
causal mediation effect of proportion of other-payoffs within-action
transitions on the relation between CRT score and proportion of equilibrium
responses is statistically significant (p = .002, based on 10000 bootstrap
samples), accounting for an estimated 58 % of the total effect between CRT
score and proportion of equilibrium responses (Table 4).
2.4 Summary
In Experiment 1, we have shown that cognitive reflection is closely
associated with strategic behavior in one-shot 2x2 matrix games. First,
the CRT score predicts the free parameter τ , expressing the
hierarchical level of sophistication in the Cognitive Hierarchy model, as
well as the proportion of equilibrium choices in dominance-solvable games
requiring strategic sophistication and the Strategic IQ. Crucially, the
CRT score predicts also the type of visual analysis employed in the same
games. High CRT players performed a higher proportion of other-payoffs
within-action transitions, reflecting the attempt at forming precise
(non-diffuse) beliefs about the choice of the counterpart. The emergence
of this pattern of information acquisition completely mediates the
relationship between cognitive reflection and the level of sophistication
of choices.
In order to understand the generalizability of these effects, in Experiment
2 we explored the relationships between cognitive reflection, gaze
patterns and strategic choices in matrix games characterized by a more
complex payoff structure.
3 Experiment 2
3.1 Methods
3.1.1 Participants and procedure
Participants were other 48 students from the University of Trento, Italy
(27 females, mean age 23, SD 3.16). Participants performed fourteen 3x3
one-shot matrix games. We used the 14 games reported in Costa-Gomes and
Weizsäcker (2008).10 All
games have a unique Nash equilibrium and do not have salient payoffs. Ten
of these games are solvable in two, three, or four steps of iterated
dominance,11
while four games have unique Nash equilibrium without dominant strategies.
Before playing the games, participants were instructed on the procedure and
were provided with examples and training trials (4 games). Moreover,
control questions were administered to verify that task and procedure of
payment had been fully understood by participants. If participants failed
to answer control questions, instructions were repeated until
participant’s full comprehension (we report detailed instructions and
control questionnaires in section C.1 of the Appendices). The order of
games was randomized across participants. Each trial was preceded by a
fixation-point positioned in one of four possible locations outside the
symbol space.
All participants played in the role of row player and were instructed to
choose between row I, row II and row III by key-press.12 Each
game was played only once and no feedback was provided at the end of
games. At the end of the fourteen games, three games were randomly
selected and the player’s choice in each game was paired with the choice
of another player in that game. Participants received the sum of the
outcomes of the three games in euros (from 3.1 to 29 euros).
Moreover, participants completed the Cognitive Reflection Test (CRT) with
the same items used in Experiment 1. We did not collect other control
measures of fluid intelligence and working memory, since we have already
shown that the effect of reflection, as measured by the CRT, on strategic
choices or gaze patterns in one-shot matrix games does not seem to be
driven by fluid intelligence or working memory.
3.1.2 Eye-tracking procedure and gaze data analysis
The eye-tracking procedure was identical to the one used in Experiment 1.
Concerning gaze data analysis, we defined 18 regions of interest (ROIs)
centered on the matrix payoffs. All the ROIs had a circular shape with a
size of 36000 pixels, did not overlap and covered 38.8 % of the game
matrix area. However, the large majority of fixations (86 %) fell inside
the ROIs. All the fixations falling outside the ROIs were discarded. The
same gaze variables of Experiment 1 (own and other’s payoffs fixations;
five types of between-payoffs transitions) were used for eye-tracking
analysis in Experiment 2.13
3.2 Hypotheses
| Table 5: Average proportion of choices in accordance with each of the three
common models of choice (Level-1 (L1), Level-2 (L2) and Nash Equilibrium
(Nash). |
| | | Behavioral model of choice |
| | Game ID | L1 | | L2 | Nash |
21in2 steps of iterated dominance | 1 | 0.40 | | 0.29 | 0.29 |
| | 3 | 0.69 | | 0.21 | 0.21 |
| | 5 | 0.56 | | 0.35 | 0.35 |
| | 7 | 0.38 | | 0.33 | 0.33 |
| | | 0.51 | | 0.29 | 0.29 |
31in3/4 steps of iterated dominance | 2 | 0.50 | | 0.25 | 0.50 |
| | 4 | 0.75 | | 0.75 | 0.25 |
| | 6 | 0.90 | | 0.90 | 0.10 |
| | 8 | 0.58 | | 0.58 | 0.58 |
| | 9 | 0.71 | | 0.25 | 0.71 |
| | 10 | 0.40 | | 0.35 | 0.35 |
| | | 0.64 | | 0.51 | 0.42 |
21inUnique Nash (no dominance) | 11 | 0.58 | | 0.35 | 0.35 |
| | 12 | 0.71 | | 0.71 | 0.21 |
| | 13 | 0.73 | | 0.23 | 0.73 |
| | 14 | 0.50 | | 0.38 | 0.13 |
| | | 0.63 | | 0.42 | 0.35 |
| | All | 0.60 | | 0.42 | 0.36 |
In Experiment 2, we asked whether the effects observed in Experiment 1
could generalize to more complex payoff structures (3x3). In this regard,
recent evidence (Costa-Gomes and Weizsäcker, 2008) has shown that players
rarely reach equilibrium in these complex games; rather, they usually
implement a maximum of two steps of strategic thinking (level-2) (Polonio
& Coricelli, 2019). We do not expect players to regularly play the
equilibrium strategy, and the most sophisticated model of choice employed
by players should be level-2, which assumes the counterpart to be a level-1
player. We therefore expect the CRT score to be associated with higher
levels of strategic thinking (i.e., level-2), and with a higher proportion
of level-2 choices.
As in Experiment 1, we hypothesize that the behavior of high CRT players
translates in visual patterns of information acquisition meant to predict
the opponent’s move: in particular, sophisticated players should exhibit a
higher proportion of other-payoff within-action transitions, reflecting
the attempt at predicting the action with the highest average payoff for
the opponent (Bhatt & Camerer, 2005; Costa-Gomes et al., 2001; Devetag et
al., 2016; Polonio & Coricelli, 2019). Finally, we expect sophistication
in the visual analysis of the game matrix to mediate the relationship
between cognitive reflection and strategic choices.
3.3 Results
3.3.1 Behavioral results
In Table 5, we report the proportion of choices in accordance with three
common models of choice: level-1 (L1), level-2 (L2) and Nash equilibrium.
Consistently with previous results (Costa-Gomes and Weizsäcker, 2008;
Polonio & Coricelli, 2019), the model that best explains the average
behavior of players, in every class of game, is L1, while players play the
Nash equilibrium barely above chance level. In the next paragraph, we will
explore whether and how cognitive reflection can account for heterogeneity
in strategic sophistication.
| Table 6: For each of the four CRT levels, we report the parameter τ
(CH), which reflects the average number of steps of strategic thinking in
the Cognitive Hierarchy (CH) model, and the average proportion of L2
responses. Values in brackets represent between-subject standard
deviations. |
| CRT score | N | τ (CH) | | Avg. proportion of L2 responses |
| CRT = 0 | 14 | 0.59 | | 0.32 (0.11) |
| CRT = 1 | 9 | 1.40 | | 0.42 (0.15) |
| CRT = 2 | 8 | 1.12 | | 0.41 (0.23) |
| CRT = 3 | 17 | 1.54 | | 0.52 (0.19) |
3.3.2 CRT and strategic sophistication
As in Experiment 1, we estimated the parameter τ of each of the four
CRT groups to investigate whether the CRT score is associated with the
level of strategic thinking predicted by the Cognitive Hierarchy model. As
in the previous experiment, higher CRT levels are associated with higher
τ parameters (CRT = 0, τ = 0.59; CRT = 1, τ = 1.40; CRT =
2, τ = 1.12; CRT = 3, τ = 1.54), suggesting a close association
between cognitive reflection and level of strategic sophistication (Table
6). We can see that τ levels are lower than the ones observed in
Experiment 1, as expected by the higher complexity of the
games. Specifically, the CRT group with the highest average τ (CRT =
3) exhibited a level of strategic thinking between L1 and L2, confirming
that in these games players generally implement a maximum of two steps of
strategic thinking. For this reason, we will use the proportion of L2
responses as a behavioral measure of level of sophistication in the next
analyses. The proportion of L2 choices in 3x3 games was indeed modulated by
CRT score (Linear regression, R2 = 0.17, F (1, 46) =
9.48, B = 0.41, p = 0.003).14
Results do not change when excluding from the model influential
observations (= 3) with values of Cook’s D > 4/n.
(R2 = 0.22, F (1, 43) = 12.05, B = 0.38, p = 0.001).
Average proportions of L2 responses for each CRT level are reported in
Table 6 and visualized in Figure B2 (left panel) in section B.2 of the
Appendices.
In Experiment 1, we found that high CRT score (CRT = 3) was associated
with a higher level of Strategic IQ. In Experiment 2, we do not observe any
association between CRT score and Strategic IQ (R2 =
0.04, F (1, 46) = 1.71, B = 0.19, p = .197, see Figure B2, right panel, in
section B.2 of the
Appendices). The
absence of a significant effect in Experiment 2 could be explained by the
increase of the strategy space in 3x3 games. In fact, in 2x2 games, the L2
strategy constitutes a best response to both L1 and L2 strategies; since
the minimum number of steps of strategic thinking observed in 2x2 games is
one (L1), the L2 strategy expresses a best response to the large majority
of potential opponents in the population. Therefore, players closer to
level-2 (CRT = 3) exhibit a higher Strategic IQ. Conversely, in our 3x3
games, the L2 model of choice does not constitute a best response to a L2
or a L0 counterpart and the L2 strategy is not always efficient given the
actual distribution of types of players in the population. In other words,
in 3x3 games, the heterogeneity of the population’s strategy space might
have prevented high CRT players from best responding to a high ratio of
potential opponents, and from increasing their Strategic IQ significantly.
3.3.3 Gaze patterns and choices
First, we asked whether the visual analysis is influenced by the type of
game (2-steps, 3–4 steps, no dominance). We ran a repeated-measures ANOVA
with proportion of transitions as dependent variable and type of transition
and type of game as independent repeated factors in order to test for the
presence of an interaction effect. Results reveal an effect of type of
transition (F (4, 376) = 14.79, p < .001) and no effects of type
or game (F (2, 376) = 0.92, p = 0.403) or game-transition interaction (F
(8, 376) = 0.96, p = 0.466).15 These
results corroborate results of Experiment 1 showing no effect of the game
structure on the scan path implemented by participants to analyze
matrices. For this reason, gaze patterns will be analyzed independently of
the type of game henceforth.
Replicating results of Experiment 1, higher levels of strategic
sophistication were accompanied by a higher proportion of other-payoffs
within-action transitions (Mixed-model logistic regression of L2 response B
= 0.67, p < .001, Table B4 in section B.2,
Appendices). Additionally,
we observe an effect of own-payoffs between-action transitions (B = 0.22, p
= .019).16
The higher proportion of own-payoffs between-action transitions is
consistent with the expected and observed visual pattern of information
acquisition of strategic players (Polonio & Coricelli, 2019) who, after
having formed beliefs about the expected action of the opponent, best
respond to this prediction by looking at their own payoffs within the
expected counterpart’s action.17 These results confirm
that exploring the incentives of the counterpart and integrating them in a
comprehensive representation of the game is crucial to exhibit more
sophisticated models of choice, as L2.
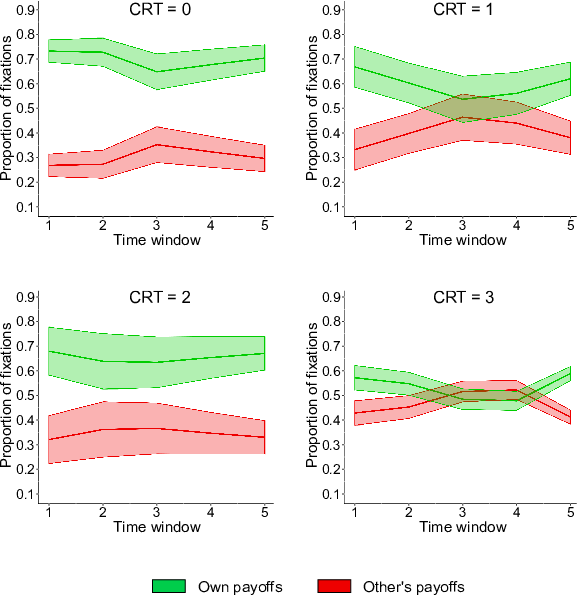
| Figure 6: Temporal evolution of the distribution of attention between own
and other’s payoffs fixation by CRT level. Temporal windows were defined
using the same method of Experiment 1 (see section A.2 in the Appendices)
Filled areas represent between-subject standard errors of the mean. |
3.3.4 CRT and gaze patterns
We tested whether the CRT score predicted visual patterns of information
acquisition also in 3x3 games. Consistently with results of Experiment 1,
CRT score specifically predicts the mean proportion of other-payoffs
within-action transitions among the five relevant transitions (Multivariate
regression, B = 0.37, p = .009, F (1, 46) = 7.48, R2 =
0.14, significant at Bonferroni-corrected threshold. See Table B5 in
section B.2,
Appendices). Results
hold even if excluding influential observations (n = 3) with values of
Cook’s D > 4/n (B = 0.41, p = .001). Moreover, we report an
almost significant trend of the CRT score on the proportion of
other-payoffs between-action transitions (B = 0.27, p = .059), which
reaches significance when excluding from the model influential observations
(Cook’s D > 4/n, B = 0.36, p = .009).18 Other-payoffs
between-action transitions are relevant in the visual analysis of the
payoff matrix since are necessary to spot relationships of dominance
between the actions of the counterpart and apply recursive steps of
strategic thinking in complex 3 x 3 payoff structures (Polonio &
Coricelli, 2019).
We also analyzed the time course of the distribution of attention between
own and other’s payoffs across CRT levels. As shown in Figure 6, low CRT
players were primarily focused on their own payoffs during the entire time
course of the game. Conversely, high CRT players started focusing on own
payoffs, then increased their level of attention towards the payoff of the
counterpart and eventually they focused again their own payoffs in order
to best respond to the opponent’s predicted action.
The temporal pattern of high CRT players is less neat than the one observed
in Experiment 1, probably due to the increased complexity of the payoff
structures that pushes players to focus more on own payoffs and play less
sophisticated strategies in 3x3 games. In fact, low CRT players largely
ignored the counterpart’s incentives along the entire time course of the
trial. Coherently, results of a mixed-effect linear model indeed show the
CRT score modulates the rate of attention towards other’s payoffs not only
in the middle part of the trial (B = 0.46, p = .007), but also at the
beginning (B = 0.50, p = .003) and almost significantly in the final part
of the trial (B = 0.33, p = .052).19
3.3.5 CRT, gaze patterns and strategic choices: mediation
analysis
Finally, we aimed to replicate findings from Experiment 1, showing an
effect of full mediation of game visual analysis on the relationship
between cognitive reflection and sophistication of choices.
We ran a linear regression with mean proportion of L2 response as dependent
variable and CRT score and proportion of other-payoffs within-action
transitions as independent variables (Table B6 in section B.2,
Appendices). As in
Experiment 1, the effect of CRT on the proportion of strategic (L2)
responses disappears after including in the model the proportion of
other-payoffs within-action transitions, indicating full mediation of game
visual analysis on the relationship between cognitive reflection and
strategic choices. The average causal mediation effect of proportion of
other-payoffs within-action transitions on the relation between CRT score
and proportion of L2 responses is statistically significant (p = .003,
based on 10000 bootstrap samples, bias-corrected and accelerated bootstrap
method), accounting for an estimated 68% of the total effect between CRT
score and L2 responses (Table B7 in section B.2,
Appendices).
3.4 Summary
Experiment 2 replicated results of Experiment 1 using games
characterized by increased relational complexity of the payoff structure.
As in the previous experiment, a high CRT score is associated with the
tendency to take into consideration other’s incentives to form beliefs
about her expected action, and predicts the implementation of more
sophisticated models of choice (closer to level-2 of the Cognitive
Hierarchy model). Moreover, the relationship between cognitive abilities
and strategic choices is entirely driven by the mediating effect of the
type of visual analysis implemented.
4 Discussion
In two eye-tracking experiments, we found that cognitive reflection
can predict the ability to take into account others’ incentives in the
visual exploration of the payoff matrix. This
visual analysis is fundamental since it reflects the attempt to
predict other’s actions and respond to such predictions, which
we can consider as the hallmark of strategic behavior. High levels of
cognitive reflection also explain the implementation of a higher number of
steps of strategic thinking in the decision process, in the framework of
Level-k and Cognitive Hierarchy theories. Interestingly, the relationship
between cognitive reflection and strategic choices is completely mediated
by gaze patterns, suggesting a precise role for cognitive reflection and
game representation mechanisms in explaining strategic behavior.
The association between cognitive reflection and lookup patterns suggests
that one cause of unsophisticated strategic behavior is the failure to
process and represent relevant information accurately. Specifically,
individuals characterized by an unreflective cognitive style tend to
disregard those payoff comparisons that are necessary to form beliefs about
the action of the counterpart and therefore engage in strategic recursive
reasoning. Individual cognitive style therefore modulates attentional
mechanisms sub-serving one of the core components of mentalizing, namely
the understanding of others’ preferences (Bilancini et al., 2018). However,
this does not imply that low CRT players are unable to attribute
mental states to others; rather, it suggests that cognitive reflection
modulates top-down attentional process of information search and
representation necessary to correctly integrate others’ incentives in the
model of the opponent’s decision space. When the complexity of this
cognitive operation is high, low CRT agents may implement behavioral rules
that simplify the relational structure of the problem (Devetag & Warglien,
2008; Pantelis & Kennedy, 2017). For instance, they may focus primarily on
own payoffs (Evans & Krueger, 2014), as suggested by the increased bias
towards own payoff in in Experiment 2.
Our results can be easily interpreted in the framework of dual-process
theories (Chaiken & Trope, 1999; Epstein et al., 1996; Gawronski &
Creighton, 2013; Kahneman, 2003; Sloman,1996; Smith & DeCoster, 2000;
Strack and Deutsch, 2004; Evans, 2008), which explain heterogeneity in
decision making in terms of reliance on deliberative and intuitive
cognitive systems (Alós-Ferrer et al., 2016). In these terms, cognitive
reflection expresses the individual tendency to rely more or less on one or
the other system (Osman, 2004). Nonetheless, the implementation of
unsophisticated strategies in one-shot games may depend on the
tendency to initially rely on intuitive processing until errors or
inefficiency are detected by the deliberative system (Evans, 1984,
2006; Kahneman, 2003; Travers et al., 2016). This hypothesis is
supported by results of Experiment 1 showing that the cognitive
reflection level modulates the players’ tendency to switch attention
towards the counterpart’s incentives after an initial exploration of their
own payoffs.
Nevertheless, this interpretation does not entail that low CRT players are
unable to build more exhaustive representation of the interactive
decision and to use more sophisticated models of choice. In fact, recent
findings (Zonca et al., 2019a) have shown that players using
unsophisticated visual analyses and models of choice (i.e., L1 players) can
switch gaze patterns and choice towards more sophisticated behavior after
exposure to alternative models of choice. In the same way, unreflective
players may abandon their initial unsophisticated strategy and increase
their level of sophistication after feedback that reveals the inefficiency of
their current behavior or the existence of more sophisticated strategies
(Verbrugge et al. 2018).
Moreover, our findings highlight a crucial component of the concept of
“strategic awareness” advanced by Fehr & Huck (2016). Specifically, the
authors suggested that out-of-equilibrium behavior is driven by the lack
of understanding of the interactive nature of the game: we indeed propose
that a potential cause of this awareness lies in the failure
to process task-relevant information exhaustively.
We also found that the visual analysis sustaining the construction of game
representations appears to completely mediate the relationship between
cognitive reflection and strategic choices. This finding is important since
it discloses the nature of this effect, widely reported in recent studies
exploring the link between game playing and cognitive abilities (Akiyama et
al., 2017; Brañas-Garza et al., 2012; Carpenter et al., 2013; Fehr & Huck,
2016; Kiss et al., 2016; Georganas et al., 2015). Cognitive reflection does
not directly affect choices, but rather influences mechanisms of encoding
and representation of relevant information in the payoff matrix, which in
turn predict sophistication in choices. Moreover, this finding offers new
insight about the role of cognitive reflection and representation-building
in higher cognition, given that the CRT has been found to predict behavior
in several decision-making (Brañas-Garza et al., 2012; Campitelli &
Labollita, 2010; Graffeo et al., 2015; Toplak et al., 2011), learning (Don
et al., 2016) and reasoning (Hoppe & Kusterer, 2011; Oechssler et al.,
2009) tasks. In particular, these results support the idea that the effect
of cognitive reflection on complex tasks may reside in its effect of
processes of search, encoding and representation of task-relevant
information, as suggested in previous studies (Cokely & Kelley, 2009;
Sirota et al., 2014; Zonca et al., 2019b).
Taken together, our results stress the importance of processes of
representation generation for understanding strategic behavior (Devetag &
Warglien, 2008), and ground the sophistication of such processes in the use
of rich or miserly information processing, as assessed by individual levels
of cognitive reflection. Nonetheless, other cognitive processes may
intervene in determining sophistication in interactive decisions. For
example, use of recursive thinking might influence performance in
games like the Beauty Contest game (Mazzocco et al, 2013), and forward or
backward induction may be necessary in multi-step games. Working memory
abilities might influence strategic behavior in repeated games, where
information about previous trials must be recalled and integrated with
novel information. Furthermore, social motives might intervene in the
decision process and influence the expected utility of players with
other-regarding preferences, who aim to maximize joint, rather than
individuals, outcomes (Devetag et al., 2016; Polonio & Coricelli,
2019). We hope that our results could fuel further research into the role
of cognitive processes and social motives in explaining strategic behavior
in interactive settings.
References
Akiyama, E., Hanaki, N., & Ishikawa, R. (2017). It is not just confusion!
Strategic uncertainty in an experimental asset market. The
Economic Journal, 127(605), F563–F580.
Alós-Ferrer, C., Garagnani, M., & Hügelschäfer, S. (2016). Cognitive
reflection, decision biases, and response times. Frontiers in
Psychology, 7, 1402.
Baddeley, A. D. (1996). Exploring the central executive. Quarterly
Journal of Experimental Psychology, 49A, 5–28.
Baron, J., Scott, S., Fincher, K., & Metz, S. E. (2014). Why does the
cognitive reflection test (sometimes) predict utilitarian moral judgment
(and other things)? Journal of Applied Research in Memory and
Cognition, 4, 265–284
Bhatt, M., & Camerer, C. F. (2005). Self-referential thinking and
equilibrium as states of mind in games: fMRI evidence. Games and
Economic Behavior, 52(2), 424–459.
Bilancini, E., Boncinelli, L., & Mattiassi, A. (2018). Assessing Actual
Strategic Behavior to Construct a Measure of Strategic Ability.
Frontiers in Psychology, 9, 2750.
Brañas-Garza, P., Garcia-Muñoz, T., & González, R. H. (2012). Cognitive
effort in the beauty contest game. Journal of Economic Behavior &
Organization, 83(2), 254–260.
Brocas, I., Carrillo, J. D., Wang, S. W., & Camerer, C. F. (2014).
Imperfect choice or imperfect attention? Understanding strategic thinking
in private information games. Review of Economic Studies,
81(3), 944–970.
Brocas, I., Carrillo, J. D., & Sachdeva, A. (2018). The path to
equilibrium in sequential and simultaneous games: A mousetracking study.
Journal of Economic Theory, 178, 246–274.
Burks, S. V., Carpenter, J. P., Goette, L., & Rustichini, A. (2009).
Cognitive skills affect economic preferences, strategic behavior, and job
attachment. Proceedings of the National Academy of
Sciences, 106(19), 7745–7750.
Burnham, T. C., Cesarini, D., Johannesson, M., Lichtenstein, P., &
Wallace, B. (2009). Higher cognitive ability is associated with lower
entries in a p-beauty contest. Journal of Economic Behavior &
Organization, 72(1), 171–175.
Camerer, C. F., Ho, T. H., & Chong, J. K. (2004). A cognitive hierarchy
model of games. The Quarterly Journal of
Economics, 119(3), 861–898.
Campitelli, G., & Labollita, M. (2010). Correlations of cognitive
reflection with judgments and choices. Judgment and Decision
Making, 5, 182–191.
Carpenter, J., Graham, M., & Wolf, J. (2013). Cognitive ability and
strategic sophistication. Games and Economic
Behavior, 80, 115–130.
Chaiken, S., & Trope, Y. (Eds.). (1999). Dual-process theories in
social psychology. Guilford Press.
Chong, J. K., Ho, T. H., & Camerer, C. (2016). A generalized cognitive
hierarchy model of games. Games and Economic
Behavior, 99, 257–274.
Cokely, E. T., & Kelley, C. M. (2009). Cognitive abilities and superior
decision making under risk: A protocol analysis and process model
evaluation. Judgment and Decision Making, 4(1), 20.
Cokely, E., Parpart, P., & Schooler, L. (2009). On the link between
cognitive control and heuristic processes. In Proceedings of the
Annual Meeting of the Cognitive Science Society (Vol. 31, No.
31).
Costa-Gomes, M., Crawford, V. P., & Broseta, B. (2001). Cognition and
Behavior in Normal-Form Games: An Experimental Study.
Econometrica, 69(5), 1193–1235.
Costa-Gomes, M. A., & Weizsäcker, G. (2008). Stated beliefs and play in
normal-form games. The Review of Economic
Studies, 75(3), 729–762.
Crawford, V. P. (2003). Lying for strategic advantage: Rational and
boundedly rational misrepresentation of intentions. American
Economic Review, 133–149.
Crawford, V. P., Costa-Gomes, M. A., & Iriberri, N. (2013). Structural
models of nonequilibrium strategic thinking: Theory, evidence, and
applications. Journal of Economic Literature, 51(1),
5–62.
De Neys, W., & Osman, M. (2013). Eye-tracking and reasoning: what your
eyes tell about your inferences. In New Approaches in Reasoning
Research (pp. 59–77). Psychology Press.
Deubel, H., & Schneider, W. X. (1996). Saccade target selection and object
recognition: Evidence for a common attentional mechanism. Vision
Research, 36(12), 1827–1837.
Devetag, G., Di Guida, S., & Polonio, L. (2016). An eye-tracking study of
feature-based choice in one-shot games. Experimental Economics,
19(1), 177–201.
Devetag, G., & Warglien, M. (2008). Playing the wrong game: An
experimental analysis of relational complexity and strategic
misrepresentation. Games and Economic Behavior, 62(2),
364–382.
Di Ciccio, T. J., Efron B. (1996). Bootstrap confidence intervals.
Statistical Science, 11, 189–228.
Don, H. J., Goldwater, M. B., Otto, A. R., & Livesey, E. J. (2016). Rule
abstraction, sophisticated choice, and cognitive reflection.
Psychonomic Bulletin and Review, 23, 1615–1623.
Draper, N. R., & Smith, H. (1998). Applied regression
analysis (Vol. 326). John Wiley & Sons.
Efroymson, M. A. (1960). Multiple regression analysis. Mathematical
Methods for Digital Computers, 191–203.
Epstein, S., Pacini, R., Denes-Raj, V., & Heier, H. (1996). Individual
differences in intuitive–experiential and analytical–rational thinking
styles. Journal of Personality and Social Psychology,
71(2), 390.
Evans, J. S. B. (1984). Heuristic and analytic processes in reasoning.
British Journal of Psychology, 75(4), 451–468. Evans,
J. S. B. (2006). The heuristic-analytic theory of reasoning: Extension and
evaluation. Psychonomic Bulletin & Review, 13(3), 378–395.
Evans, J. S. B. (2008). Dual-processing accounts of reasoning, judgment,
and social cognition. Annual Review of Psychology, 59,
255–278.
Evans, A. M., & Krueger, J. I. (2014). Outcomes and expectations in
dilemmas of trust. Judgment & Decision Making, 9(2).
Fehr, D., & Huck, S. (2016). Who knows it is a game? On strategic
awareness and cognitive ability. Experimental
Economics, 19(4), 713–726.
Frederick, S. (2005). Cognitive reflection and decision
making. Journal of Economic Perspectives, 19(4), 25–42.
Gawronski, B., & Creighton, L. A. (2013). Dual-process theories.
The Oxford handbook of social cognition, 282–312.
Georganas, S., Healy, P. J., & Weber, R. A. (2015). On the persistence of
strategic sophistication. Journal of Economic
Theory, 159, 369–400.
Gill, D., & Prowse, V. (2016). Cognitive ability, character skills, and
learning to play equilibrium: A level-k analysis. Journal of
Political Economy, 124(6), 1619–1676.
Goodie, A. S., Doshi, P., & Young, D. L. (2012). Levels of
theory-of-mind reasoning in competitive games. Journal of
Behavioral Decision Making, 25(1), 95–108.
Graffeo, M., Polonio, L., & Bonini, N. (2015). Individual differences in
competent consumer choice: the role of cognitive reflection and numeracy
skills. Frontiers in Psychology, 6, 844.
Grosskopf, B., & Nagel, R. (2008). The two-person beauty contest.
Games and Economic Behavior, 62(1), 93–99.
Hamel, R., Schmittmann, V.D. (2006). The 20-minute version as a predictor
of the Raven Advanced Progressive Matrices Test. Educational and
Psychological Measurement, 66(6), 1039–1046.
Hanaki, N., Jacquemet, N., Luchini, S., & Zylbersztejn, A. (2016). Fluid
intelligence and cognitive reflection in a strategic environment: evidence
from dominance-solvable games. Frontiers in
Psychology, 7, 1188.
He, P., & Kowler, E. (1992). The role of saccades in the perception of
texture patterns. Vision Research, 32, 2151–2163.
Hedden, T., & Zhang, J. (2002). What do you think I think you think?
Strategic reasoning in matrix games. Cognition, 85,
1–36.
Ho, T. H., Camerer, C., & Weigelt, K. (1998). Iterated dominance and
iterated best response in experimental “p-beauty contests".
American Economic Review, 88(4), 947–969.
Hocking, R. R. 1976. The analysis and selection of variables in linear
regression. Biometrics, 32, 1–49.
Hoffman, J. E., & Subramaniam, B. (1995). The role of visual attention in
saccadic eye movements. Perception and Psychophysics, 57,
787–795.
Hoppe, E. I., & Kusterer, D. J. (2011). Behavioral biases and cognitive
reflection. Economics Letters, 110(2), 97–100.
Hristova, E., & Grinberg, M. (2005). Information acquisition in the
iterated prisoner’s dilemma game: An eye-tracking study.
In Proceedings of the 27th annual conference of the cognitive
science society (pp. 983–988). Hillsdale, NJ: Lawrence Erlbaum.
Imai, K., Keele, L., Tingley, D. (2010). A General Approach to Causal
Mediation Analysis. Psychological Methods, 15(4),
309–334.
Kahneman, D. (2003). Maps of bounded rationality: Psychology for behavioral
economics. American Economic Review, 93(5), 1449–1475.
Kane, M. J., Conway, A. R. A., Miura, T. K., & Colflesh, G. J. (2007).
Working memory, attention control, and the N-back task: A question of
construct validity. Journal of Experimental Psychology: Learning,
Memory, and Cognition, 33(3), 615–622.
Kirchner, W. K. (1958). Age differences in short-term retention of rapidly
changing information. Journal of Experimental Psychology,
55, 352–358.
Kiss, H. J., Rodriguez-Lara, I., & Rosa-García, A. (2016). Think twice
before running! Bank runs and cognitive abilities. Journal of
Behavioral and Experimental Economics, 64, 12–19.
Koehler, D. J., & James, G. (2010). Probability matching and strategy
availability. Memory & Cognition, 38(6), 667–676.
Kreps, D., (1990). Game theory and economic modeling. Oxford
University Press.
Liberali, J. M., Reyna, V. F., Furlan, S., Stein, L. M., & Pardo, S. T.
(2012). Individual differences in numeracy and cognitive reflection, with
implications for biases and fallacies in probability judgment.
Journal of Behavioral Decision Making, 25(4), 361–381.
Mailath, G. J. (1998). Do people play Nash equilibrium? Lessons from
evolutionary game theory. Journal of Economic
Literature, 36(3), 1347–1374.
Manor, B. R., & Gordon, E. (2003). Defining the temporal threshold for
ocular fixation in freeviewing visuocognitive tasks. Journal of
Neuroscience Methods, 128(1), 85–93.
Mata, A., Ferreira, M. B., & Sherman, S. J. (2013). The metacognitive
advantage of deliberative thinkers: A dual-process perspective on
overconfidence. Journal of Personality and Social Psychology,
105(3), 353–355.
Mata, A., Schubert, A. L., & Ferreira, M. B. (2014). The role of language
comprehension in reasoning: How “good-enough” representations induce
biases. Cognition, 133(2), 457–463.
Mazzocco, K., Cherubini, A. M., & Cherubini, P. (2013). On the short
horizon of spontaneous iterative reasoning in logical puzzles and
games. Organizational Behavior and Human Decision
Processes, 121(1), 24–40.
Monaco, M., Costa, A., Caltagirone, C., Carlesimo, G. A. (2013). Forward
and backward span for verbal and visuo-spatial data: standardization and
normative data from an Italian adult population. Neurological
Sciences, 34, 749–754.
Nagel, R. (1995). Unraveling in guessing games: An experimental
study. The American Economic Review, 85(5), 1313–1326.
Nash, J. F. (1950). Equilibrium points in n-person games.
Proceedings of the National Academy of Sciences, 36(1),
48–49.
Oechssler, J., Roider, A., & Schmitz, P. W. (2009). Cognitive abilities
and behavioral biases. Journal of Economic Behavior &
Organization, 72, 147–152.
Osman, M. (2004). An evaluation of dual-process theories of reasoning.
Psychonomic Bulletin & Review, 11(6), 998–1010.
Pantelis, P. C., & Kennedy, D. P. (2017). Autism does not limit strategic
thinking in the “beauty contest” game. Cognition, 160,
91–97.
Polonio, L., & Coricelli, G. (2019). Testing the level of consistency
between choices and beliefs in games using eye-tracking. Games and
Economic Behavior, 113, 566–586.
Polonio, L., Di Guida, S., & Coricelli, G. (2015). Strategic
sophistication and attention in games: An eye-tracking
study. Games and Economic Behavior, 94, 80–96.
Preacher, K. J., Hayes, A. F. (2008). Asymptotic and Resampling Strategies
for Assessing and Comparing Indirect Effects in Multiple Mediator Models.
Behavior Research Methods, 40(3), 879–891.
Premack, D., & Woodruff, G. (1978). Does the chimpanzee have a theory of
mind? Behavioral and Brain Sciences, 4, 515–526.
Raven, J., Raven, J. C., & Court, J. H. (1998). Raven manual
section 4: Advanced Progressive Matrices. Oxford Psychologists Press.
Rydval, O., Ortmann, A., & Ostatnicky, M. (2009). Three very simple games
and what it takes to solve them. Journal of Economic Behavior &
Organization, 72(1), 589–601.
Schmittmann, V. D. (2006). The 20-minute version as a predictor of the
Raven Advanced Progressive Matrices Test. Educational and
Psychological Measurement, 66(6), 1039–1046.
Sirota, M., Juanchich, M., & Hagmayer, Y. (2014). Ecological rationality
or nested sets? Individual differences in cognitive processing predict
Bayesian reasoning. Psychonomic Bulletin &
Review, 21(1), 198–204.
Sloman, S. A. (1996). The empirical case for two systems of reasoning.
Psychological Bulletin, 119(1), 3.
Smith, E. R., & DeCoster, J. (2000). Dual-process models in social and
cognitive psychology: Conceptual integration and links to underlying
memory systems. Personality and Social Psychology Review,
4, 108–131.
Stahl, D. O., & Wilson, P. W. (1995). On players[2032?] models of other
players: Theory and experimental evidence. Games and Economic
Behavior, 10(1), 218–254.
Stewart, N., Gächter, S., Noguchi, T., & Mullett, T. L. (2016). Eye
movements in strategic choice. Journal of Behavioral Decision
Making, 29(2–3), 137–156.
Strack, F., & Deutsch, R. (2004). Reflective and impulsive determinants of
social behavior. Personality and Social Psychology Review,
8(3), 220–247.
Szaszi, B., Szollosi, A., Palfi, B., & Aczel, B. (2017). The cognitive
reflection test revisited: exploring the ways individuals solve the test.
Thinking & Reasoning, 23(3), 207–234.
Toplak, M. E., West, R. F., Stanovich, K. E. (2011). The cognitive
reflection test as a predictor of performance on heuristics-and-biases
tasks. Memory & Cognition, 39, 1275–1289.
Toplak, M. E., West, R. F., & Stanovich, K. E. (2014). Assessing miserly
information processing: An expansion of the Cognitive Reflection
Test. Thinking & Reasoning, 20(2), 147–168.
Travers, E., Rolison, J. J., & Feeney, A. (2016). The time course of
conflict on the Cognitive Reflection
Test. Cognition, 150, 109–118.
Verbrugge, R., Meijering, B., Wierda, S., Van Rijn, H., & Taatgen, N.
(2018). Stepwise training supports strategic second-order theory of mind
in turn-taking games. Judgment and Decision Making,
13(1), 79–98.
Zonca, J., Coricelli, G., & Polonio, L. (2019a). Does exposure to
alternative decision rules change gaze patterns and behavioral strategies
in games? Journal of the Economic Science Association, 1–12.
Zonca, J., Coricelli, G., & Polonio, L. (2019b). Gaze data reveal
individual differences in relational representation
processes. Journal of Experimental Psychology: Learning, Memory,
and Cognition, 46(2), 257–279.
Wechsler, D. (2008). Wechsler Adult Intelligence Scale, 4th Ed.
This document was translated from LATEX by
HEVEA.