Judgment and Decision Making, Vol. 14, No. 4, July, 2019, pp. 488-512
Information search in everyday decisions: The generalizability of the attraction search effect
Sophie E. Scharf* # Monika Wiegelmann$
Arndt Bröder$ |
The recently proposed integrated coherence-based decisions and
search model (iCodes) makes predictions for search behavior in
multi-attribute decision tasks beyond those of classic decision-making
heuristics. More precisely, it predicts the Attraction Search
Effect that describes a tendency to search for information for the
option that is already attractive given the available evidence. To date,
the Attraction Search Effect has been successfully tested using a
hypothetical stock-market game that was highly stylized and specifically
designed to be highly diagnostic. In three experiments, we tested whether
the Attraction Search Effect generalizes to different semantic contexts,
different cue-value patterns, and a different presentation format than
the classic matrix format. Across all experiments, we find evidence for
information-search behavior that matches iCodes’s information-search
prediction. Therefore, our results corroborate not only the
generalizability of the Attraction Search Effect in various contexts but
also the inherent process assumptions of iCodes.
Keywords: attraction search effect, information search, generalizability
1 Introduction
When faced with a decision, we often have to search for information that
enables us to weigh the advantages and disadvantages of each option against
each other. Information search is especially important, if the decision at
hand has non-trivial consequences, such as when buying a car, deciding on a
job offer, or taking out insurance. Despite the importance of information
search for decision making, psychological decision-making models have
usually focused more on the processes of integrating information rather
than the processes behind searching for information
(Gigerenzer et al., 2014).
Aware of this lack of specified information-search process models,
(Jekel et al., 2018) recently extended the parallel constraint
satisfaction model for decision making
(PCS-DM; Glöckner et al., 2014) to include information search in
multi-attribute decision tasks. The new integrated coherence-based decision
and search model (iCodes) makes detailed predictions for the
information-search process in multi-attribute decisions
(Jekel et al., 2018). One core prediction of iCodes is the
Attraction Search Effect, which states that people tend to search
for information about the option that is currently supported by the already
available evidence. The Attraction Search Effect and iCodes itself have
received initial support from three experiments and the reanalyses of five
already published experiments (Jekel et al., 2018).
The original experiments by (Jekel et al., 2018) used a
probabilistic-inference task presented as a hypothetical stock-market game
with cue-value patterns that were specifically designed to be highly
diagnostic for the Attraction Search Effect. In our view, it is essential
to demonstrate that the support for the Attraction Search Effect found by
(Jekel et al., 2018) was not due to arbitrary design choices in their
studies. The goal of the present work is to test the generalizability of
the Attraction Search Effect to different settings. With data from three
online experiments, we test whether the Attraction Search Effect replicates
in different, more diverse semantic context settings. As a next step, we investigate whether the
Attraction Search Effect can be found with randomized cue-value patterns as
well. Finally, we evaluate whether the Attraction Search Effect also
emerges when information is not presented in a classic mouselab-type
setting (first introduced by Johnson et al., 1989, referred to as mouselab in the
following) but in a more realistic, simulated online
shop. Since iCodes is a new model, demonstrating that its core prediction
generalizes to different settings strengthens the relevance and reach of
the model.
In the following paragraphs, we will first take a closer look at iCodes’s prediction of information search in general and the Attraction Search Effect specifically. After presenting already existing evidence for iCodes’s core prediction, we will argue why generalizability is an important issue and present data from three experiments that test exactly this generalizability of the Attraction Search Effect. In these three studies, we gradually move away from the original study setup by (a) demonstrating the Attraction Search Effect in other semantic domains, (b) extending the range of domains and relaxing the cue-value patterns, and (c) moving away from the matrix format in a simulated online-shop setting.
2 The integrated, coherence-based decision and search model
The original PCS-DM is a network model that successfully predicts choices,
decision times, and decision confidence for multi-attribute decisions in
different contexts
(Glöckner et al., 2012,Glöckner et al., 2014,GlöcknerBetsch, 2012,GlöcknerHodges, 2010,Glöckner et al., 2010).
However, one shortcoming of PCS-DM is that it models information
integration only and is thus applicable only to decision situations that do
not require information search (Marewski, 2010).
Therefore, (Jekel et al., 2018) have recently extended PCS-DM to include
information-search processes. This new model shares in principle the same
basic network structure and the same assumptions regarding the underlying
decision process with its predecessor PCS-DM. The crucial extension is an
additional layer of nodes that is included in the network structure. This
layer represents the cue values present in the decision situation. In the
following paragraphs, we will introduce how iCodes specifies the
information-search process and how it predicts the Attraction Search
Effect. For the exact model specification and formalization, please refer
to (Jekel et al., 2018).
2.1 The prediction of information search in iCodes
In a multi-attribute decision task, the decision maker is presented with at
least two options for which information is provided in the form of
attributes or cues (HarteKoele, 2001). Depending on the specific
task, the goal of the decision maker is to either choose the option that
maximizes an objective criterion value (Glöckner et al., 2010),
such as buying the most successful stock, or to choose the option that
maximizes a subjective criterion value (Payne et al., 1993), such as
buying the preferred sweater. The cues provide information about the
options in form of cue values that can be positive evaluations of the
respective option, often represented by a "+", or negative evaluations,
often represented by a "−". In probabilistic-inference tasks, the cues
usually differ in their validity, that is, they differ in how often they
correctly evaluate an option as better than the other option(s) on the
objective criterion (GigerenzerGoldstein, 1996). Besides positive and
negative evaluations, cue values can also be hidden and have to be searched
for, which is represented by a "?". An example trial of such a
multi-attribute decision task with two options and two cues is shown in
Figure 1.
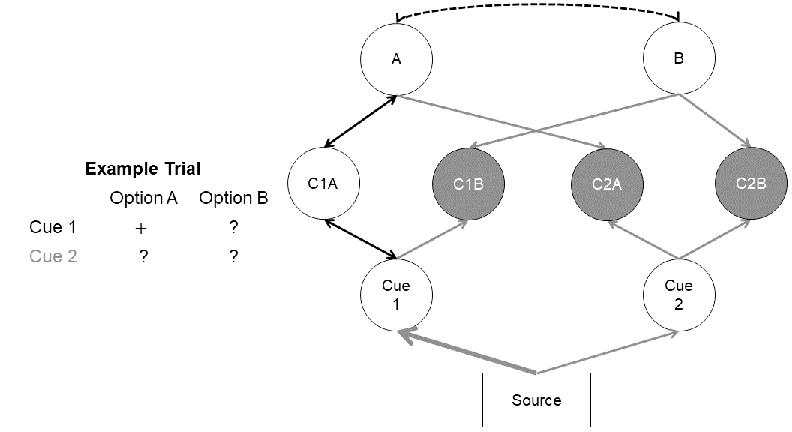
| Figure 1: The translation of a probabilistic-inference
task into the network structure of iCodes. In this example task, the
first cue, which is more valid than the second cue, makes a positive
statement regarding Option A and all other information is still
hidden. The options are represented by the option nodes in the top layer
of the network and are connected by an inhibitory, bidirectional link
(dashed line). The cue values are included in the next layer of nodes
where the white node represents the already available information and
the gray nodes represent still concealed information. Below the layer of
cue-value nodes is the layer of cue nodes. The source node on the bottom
of the network initializes the spread of activation. The activation the
cue nodes receive is proportional to their respective validities, as
indicated here by the thickness of the link. The black arrows in the
network represent bidirectional links, whereas gray arrows represent
unidirectional links. Adapted from "A new and unique prediction for
cue-search in a parallel-constraint satisfaction network model: The
attraction search effect," by M. Jekel, A. Glöckner, and A. Bröder,
2018, Psychological Review, 125, p. 746. Copyright 2018 by the
American Psychological Association. |
The information in such a multi-attribute decision task is represented in
iCodes as a network (Jekel et al., 2018). There are nodes for the
options, cues, and cue values that are connected via links as depicted in
Figure 1. The information-search process of iCodes is
modeled as a spread of activation through this network that is initiated by
the source node at the bottom of the network. Activation is spread between
nodes via the connecting links. The spread of activation continues until
the activation of each node has stabilized and, therefore, does not change
substantially anymore. At this point, the network as a whole is stable and
the model predicts that the concealed cue value whose node received the
most activation during this process is opened next.
The activation, that concealed cue-value nodes receive, stems from two
sources in the network (Jekel et al., 2018). These sources are the option and cue nodes that
are connected to searchable cue values via unidirectional links. Thus,
nodes of concealed cue values receive activation only but do not continue
the spread of activation further. These links are unidirectional to
represent that concealed cue values do not carry any information with
regard to the options or cues. Note that once a concealed cue value is
opened the unidirectional links become bidirectional indicating that the
information of this cue value is now available. The amount of activation
that nodes of searchable cue values receive from cue nodes is proportional
to their respective validities. Thus, the higher the validity of a cue, the
more activation the corresponding cue-value nodes receive. The activation
received from the option nodes depends on the current evidence for the
options. Thus, the more the current evidence favors one option over
another, the more activation the corresponding cue-value nodes receive -
via the links between cue-value nodes and options. Both sources of
activation are assumed to influence search in an additive
manner. Therefore, both the respective cue’s validity and the respective
option’s evidence determine iCodes’s search prediction for a concealed cue
value.
2.1.1 The Attraction Search Effect
Formal models that predict
information search in multi-attribute decision tasks often assume that
information is searched for cue-wise or option-wise and most often
following the order of cues’ validities
(Payne et al., 1988,LeeCummins, 2004,GigerenzerGoldstein, 1996). These
search directions are assumed to be independent of the already available
evidence. In the example trial in Figure 1, in which one
cue value is already available, these models would therefore predict that
the valence of this cue value would not matter for whether information is
searched cue-wise or option-wise. ICodes, however, predicts that the
already available evidence influences information search
(Jekel et al., 2018). This is due to the fact that iCodes assumes a joint
influence of the cues’ validities and the options’ current attractiveness
on information search. The influence of the cues’ validities leads to
iCodes’s prediction that, all things being equal, cue values from highly
valid cues are more likely to be searched for than cue values from less
valid cues. The influence of the current evidence on information search in
the formalized iCodes model also leads to an additional qualitative search
prediction: Cue values with information on the currently preferred option
are more likely to be searched for than cue values with information on the
less attractive option. This prediction has been coined as the Attraction
Search Effect by (Jekel et al., 2018).
Searching information on the currently attractive option has also been
shown in information-search paradigms outside the realm of
probabilistic-inference tasks. One common observation is information-search
behavior consistent with selective exposure
(Frey, 1986,Hart et al., 2009,FischerGreitemeyer, 2010). Selective
exposure is the tendency to search for information that supports the
currently preferred option. In the literature, this pattern of information
search is often considered to mainly stem from the motivation to defend
one’s prior beliefs or prior position
(Hart et al., 2009,FischerGreitemeyer, 2010).1 In the standard paradigm of selective exposure
subjects, therefore, know the valence of the searchable information a
priori (Fischer et al., 2011). This a priori knowledge constitutes
the key difference of selective exposure and the Attraction Search
Effect. The Attraction Search Effect cannot be driven merely by the
motivation to defend one’s preferred option since this would require
knowing beforehand whether the concealed information supports or
contradicts the currently attractive option. Rather, the mechanism of
information search in iCodes is to find information that potentially
increases the coherence of the decision situation.2
Two other phenomena that have been described in the literature predict
search behavior similar to the Attraction Search Effect: pseudodiagnostic
search in hypothesis testing
(Doherty et al., 1979,Mynatt et al., 1993) and
leader-focused search (CarlsonGuha, 2011). Pseudodiagnostic
search describes that individuals tend to search for information about
their current hypothesis only and fail to test the alternative
hypothesis. This behavior is particularly observed when the first piece of
found information supports the currently tested hypothesis
(Mynatt et al., 1993). The aforementioned failure to test
alternative hypotheses is problematic as a cue is only diagnostic for a
hypothesis test when its values are known for both hypotheses.
In the case of leader-focused search, information-search behavior is also
characterized as searching for information on the currently preferred
option (the leader) independently of the expected valence of this
information
(CarlsonGuha, 2011). (CarlsonGuha, 2011)
could show that this preference for information on the leader is so strong
that subjects preferred negative information on the leader compared to
negative information on the trailer (the currently less preferred option).
Similar cognitive explanations have been proposed for both pseudodiagnostic
and leader-focused search. (Evans et al., 2002) proposed that
pseudodiagnostic search results from a habitual focus on one hypothesis
only and individuals tend to ignore other, alternative
hypotheses. Similarly, (CarlsonGuha, 2011) refer to
focalism (Wilson et al., 2000) as a possible underlying
mechanism for leader-focused search in that individuals focus on the
current leader and subsequently ignore other options. Thus, besides
different theoretical underpinnings, the only difference between
leader-focused search and the Attraction Search Effect is that for the
former effect subjects are asked which option is more attractive whereas
for the latter effect the attractiveness of the options is manipulated via
cue-value patterns. Both phenomena, pseudo-diagnostic and leader-focused search, are similar to the
search pattern predicted by iCodes but lack an explicit theoretical model
formalizing the underlying processes of this type of search behavior. With
iCodes, there is now a computational, formal model that allows precise
predictions of when and how strong the information search direction should
be biased towards the currently more attractive option. Hence, our
explanation does not contradict the theories mentioned above, but the
observed focalism may be the result of an underlying coherence-maximizing
mechanism.
When focusing on probabilistic-inference tasks, different models have been
proposed that predict information search, such as heuristics as part of the
adaptive toolbox (e.g., GigerenzerTodd, 1999,Payne et al., 1988)
and models of the class of evidence accumulation models
(e.g., HausmannLäge, 2008,LeeCummins, 2004). However, the
prediction of the Attraction Search Effect is unique compared to these
formalized models as they base only their prediction of the stopping of
information search on the available information. The predicted direction of
information search, however, in these types of models relies solely on
external criteria such as the cues’ validities. Yet, in iCodes, the
information-search prediction depends on the additive effects of
validity-driven cue-node activations and attractiveness-driven option-node
activations on the activations of concealed cue-value nodes
(Jekel et al., 2018). Thus, the Attraction Search Effect follows from the
joint effects of validity and the current attractiveness of the options.
2.1.2 Evidence for the Attraction Search Effect
The Attraction Search Effect was tested by (Jekel et al., 2018) in two
experiments. In both experiments, they used an artificial stock-market game
in which subjects had to choose the more successful of two stocks based on
expert judgments that differed in their respective validities. For this
stock-market game, the authors specifically designed half-open cue-value
patterns that were highly diagnostic for the Attraction Search Effect. The
diagnosticity of the patterns was achieved by creating two versions of each
cue-value pattern such that in the first version (Version a) the Option A
is more attractive than Option B and that in the second version (Version b)
the Option B is more attractive than Option A. The change of attractiveness
between the two versions was achieved by changing one or two cue
values. With these two pattern versions, it was possible to calculate a
qualitative Attraction Search Score that represents the difference of
probabilities of behavior consistent with the Attraction Search Effect and
behavior inconsistent with the Attraction Search Effect. Behavior was
consistent with the Attraction Search Effect when subjects searched for the
attractive Option A in Version a and behavior was inconsistent when
subjects searched for the unattractive Option A in Version b of the
cue-value patterns;
Attraction Search Score = p(Searching for Option A | Version
a)−p(Searching for Option A | Version b). Thus, the Attraction
Search Score is positive if subjects followed iCodes’s predictions for
information search and zero if subjects did not change their direction of
search depending on the attractiveness of the options.
In the first experiment, (Jekel et al., 2018) presented the half-open
cue-value patterns to subjects and restricted information search to one
piece of information. In the second experiment, (Jekel et al., 2018) did
not restrict information search but manipulated whether information search
was costly or free. Both experiments show strong support for the Attraction
Search Effect; though, the effect was less pronounced when information
search was free. These initial results received further support in a
reanalyses of five published experiments that also used a hypothetical
stock-market game but were not specifically designed to test for the
Attraction Search Effect. In addition, iCodes fit the observed
information-search behavior quantitatively well and this fit depended on
the influence of options’ attractiveness in the model. Thus, there is
initial support for iCodes’s information-search predictions in
probabilistic-inference tasks in the semantic context of an abstract and
stylized hypothetical stock-market game.
3 The importance of model generalizability
With the recent extension of PCS-DM to iCodes and the presented empirical
support for one of iCodes’s core predictions, iCodes can be considered as a
general theory for the decision process that incorporates information
search, information integration, and decisions. As a general theory of
decision making and information search, iCodes’s predictions should be
applicable to a broad range of different (multi-attribute) decision
situations. A strict test of the applicability of a theory can be achieved
by conducting a conceptual replication that varies experimental variables
of the original studies (Makel et al., 2012). Conceptual
replications ensure that the original results are not due to task or
situational characteristics of the previous operationalizations but can be
attributed with greater confidence to the processes specified by the theory
(Bredenkamp, 1980). In our conceptual replications, we want to
test whether iCodes’s prediction for information-search behavior
generalizes to different contexts.
In the previous studies testing iCodes, several aspects of the decision
task have been kept constant that should be varied in a conceptual
replication. One of these aspects is the semantic setting of the decision
task. All experiments conducted and reanalyzed by (Jekel et al., 2018)
have used a probabilistic-inference task semantically set in a hypothetical
stock-market scenario. The hypothetical stock-market game is a commonly
used multi-attribute decision task
(Bröder, 2003,Bröder, 2000,Newell et al., 2003)
that allows explicit control over different decision parameters, such as
validities, and allows observation of information-search and decision
behavior relatively unbiased by previous knowledge. Yet, at the same time
and somewhat due to the high level of control, the hypothetical
stock-market game is a highly artificial setting that lacks ties to the
actual daily experiences of subjects. Further, a decision between stocks is
only one instance of all possible decisions and such a neglect of stimulus
sampling in an experiment is not only problematic with regard to the
generalizability of results but also might dilute the validity of the
causal inference (WellsWindschitl, 1999). ICodes’s predictions should, therefore,
apply to a range of different and possibly more realistic semantic
contexts. Testing different semantic contexts is especially relevant as
prior work on leader-focused and pseudodiagnostic search has used a wide
range of different decision contexts
(Evans et al., 2002,Mynatt et al., 1993,CarlsonGuha, 2011). Thus,
it is important to show that the Attraction Search Effect generalizes to
different content domains as well.
Second, the cue-value patterns used to elicit the Attraction Search Effect
have been kept constant between experiments. These patterns were
specifically designed to be highly diagnostic for the Attraction Search
Effect. However, as a general theory of decision making, iCodes’s
predictions should not be confined to a specific set of cue-value patterns
but should be applicable in other cue-value constellations as well. The
cue-value patterns have already been varied to some extent in the
reanalyses of previously run studies in (Jekel et al., 2018). These
reanalyses have, however, all used the same context settings, namely a
stock-market game.
A third aspect that was not varied between experiments is the way the
information for the current decision task was presented. In all
experiments, the cue values were presented in the matrix format of a
typical mouselab task. Presenting information this way makes the relevant
information highly accessible, facilitates information search itself, and
might even influence the subsequent processing of information
(Söllner et al., 2013). Yet, in many real-life decision tasks,
the necessary information is often presented in a more complex fashion than
in a matrix arranged according to cue validity. Thus, in order to claim
that iCodes is general theory of decision making, it is important to show
that the Attraction Search Effect still emerges when information is
structured differently.
The current experiments successively relaxed the restrictions inherent in
(Jekel et al., 2018) demonstrations of the Attraction Search
Effect. First, we extended the semantic contexts to various decision
domains beyond the stock-market game in all three experiments, using 13
different decision contexts altogether. Second, we also used cue-value
patterns different from the original ones (Experiment 2). Finally, we
disposed of the commonly used restrictive matrix format of information
presentation that is prevalent in many studies investigating information
search in decision making (Experiment 3). By relaxing many of the
restrictions inherent in Jekel et al.’s (2018) original experiments, we
aim to replicate the Attraction Search Effect in different decision
contexts and thus test the limits of its generalizability.
4 Experiment 1: Extension to different decision domains
The first experiment used cue-value patterns from the experiments by
(Jekel et al., 2018) but in a selection of six different semantic
contexts. As we are interested in whether iCodes can predict information
search in different contexts, we will concentrate solely on information
search as the dependent variable in this and the following
experiments. Thus, we will not analyze subjects’ choices.
4.1 Method
4.1.1 Materials
Content scenarios.
We constructed six different content
scenarios for the decision task that represented mainly preferential
decisions. These scenarios ranged from choosing a hotel to deciding which
weather forecast to trust when planning a trip. One of the scenarios is the
task to choose which of two cities is larger, commonly known as
city size task, and was added to relate to earlier research
(e.g., GigerenzerTodd, 1999). For every scenario, we chose four
cues relevant to this decision. As the validity of these cues is mostly
subjective, cues were ordered by our assumed importance for each
scenario. To validate our assumptions, subjects were asked after the task
for their subjective rating of importance of the cues. The content
scenarios and the respective cues are displayed in
Table A1 in Appendix 7.2. To make the
decision task less abstract, we further changed the format of the cue
values from "+" and "−" to different pictoral formats, such as a five-
vs. two-star ratings, thumbs-up vs. thumbs-done icons, or "yes" vs. "no"
icons for the city size scenario.3
Cue patterns.
In this experiment, we used a subset of the
original cue-value patterns from
(Jekel et al., 2018). (Jekel et al., 2018) designed their cue-value
patterns in pairs such that two versions of the same pattern differed in
one or two cue values, so that either Option A or Option B was more
attractive (see Table 1). For the present experiment, we
selected three cue patterns from Jekel et al.’s (2018) studies.
Pattern 3 was selected because it illicited the strongest Attraction Search
Effect in Jekel et al.’s (2018) studies, with an Cohen’s d
ranging from 0.81 to 2.66. Patterns 1 and 2 showed the third and fourth
strongest Attraction Search Effect, respectively, in the original studies,
with Cohen’s d ranging from 0.22 to 1.15 and from 0.61 to 0.92,
respectively. These cue-value patterns were chosen to increase our chances
to find an Attraction Search Effect under more relaxed experimental
conditions.
| Table 1: Version a and Version b of cue patterns used in Experiment 1. |
| | Pattern 1 | Pattern 2 | Pattern 3 |
| | A | B | A | B | A | B |
|
Cue 1 | ? | −(+) | +(−) | ? | +(−) | −(+) |
Cue 2 | − | ? | +(−) | ? | ? | ? |
Cue 3 | + | − | ? | ? | + | − |
Cue 4 | − | + | ? | ? | − | ? |
| Note. + = positive cue value, − = negative cue value, ? = hidden, searchable cue value; Version a of patterns is displayed, cue values in parentheses are from Version b. Patterns 1, 2, and 3 correspond to Patterns 4, 5, and 7, respectively, in (Jekel et al., 2018). |
4.1.2 Measures
Subjective importance of cues.
To assess the subjective importance of the cues, subjects were asked to rate each cue on how important they thought the cue was for their decision on a scale from 0 to 100, with zero representing not important at all and 100 representing extremely important. The purpose of this measure was to check whether the assumed validity ordering corresponded to the actual importance ordering by subjects.
Attraction search score.
Just as in the study by
(Jekel et al., 2018), we computed the individual Attraction Search Scores
as the difference of the probability of searching for Option A in Version a
vs. in Version b across the three cue-value patterns,
Attraction Search Score = p(Searching Option A |
Version a)−p(Searching Option A | Version b).4 As mentioned above, the first probability represents the probability of
behavior consistent with the Attraction Search Effect, whereas the second
probability represents the probability of behavior inconsistent with the
Attraction Search Effect. Thus, if the Attraction Search Score is larger
than zero, subjects show more behavior in line with the Attraction Search
Effect.
4.1.3 Design and procedure
Each subject was presented with each of six content scenarios and with each
of the six patterns (three patterns in two versions each). To avoid large
trial numbers which are suboptimal for online studies, the variable
Scenario with six levels and the variable Pattern with six levels (three pattern with two versions each) were
balanced using a latin square design which resulted in six experimental
groups. Therefore, each experimental group was exposed to every pattern and
every content scenario. After opening the online study and agreeing to an
informed consent, subjects provided demographic information before working
on the actual task. In each of the six trials subjects were familiarized
with the decision context and could then search for one piece of additional
information. A picture of the task setup can be found in
Figure 2. After seeing the additional piece of
information, subjects had to choose one of the options. When the decision
task was completed, subjects filled out the subjective importance measure
for each of the scenario’s cues.
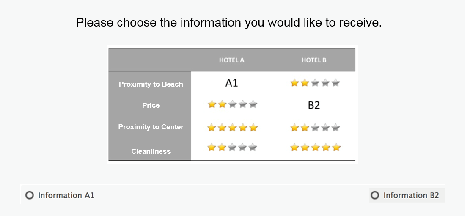
| Figure 2: A translated (from German) screenshot
of the decision task in Experiment 1. The current cue-value pattern is
Pattern 1 in Version a. Subjects could search for information by
selecting the radio button for the corresponding piece of information in
the matrix. On the next screen, the searched-for information appeared in
the decision matrix and subjects could choose one of the options. |
4.1.4 Subjects
The online experiment was conducted with the program Unipark
(Questback, 2016). Subjects were recruited online via the
registration system of the University of Mannheim and via online platforms
such as Facebook research groups. The data collection yielded a sample of
303 subjects (201 female, 47.5 % university students, Mage = 33.7,
SDage = 15.5, age range 17–70). Subjects could decide whether they
participated for course credit or entered a lottery to win a 15€
online-shop gift certificate.
4.2 Results
All following analyses were conducted with R
(R Core Team, 2019). All plots were created by using the
ggplot2 package (Wickham, 2016), mixed model
analyses were run with the packages lme4
(Bates et al., 2015) and lmerTest
(Kuznetsova et al., 2017).
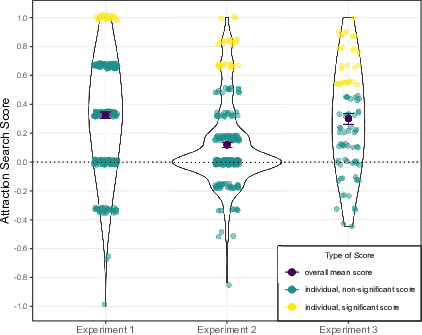
| Figure 3: Distribution of individual Attraction Search
Scores in all three experiments. The violet points represent the mean
Attraction Search Score in each experiment and error bars the standard
errors of those means. Attraction Search Scores of zero indicate
information search that is independent of the currently available
evidence. Thus, every data point above zero indicates that an individual
showed a tendency to search for information on the currently attractive
option. Yellow points indicate individuals showing a significant
(p < .050) score at the individual level according to a one-tailed
binomial test. The number of trials required for significance is 6 out
of 6, 12 out of 14, and 14 out of 18 in Experiments 1–3, respectively. |
To test for the Attraction Search Effect, we tested whether the Attraction
Search Score was significantly larger than zero. The mean Attraction Search
Score of subjects was MASS = 0.32 and was significantly larger than
zero, t(302) = 14.55, p < .001, d = 0.84 (see
Figure 3 for the distribution of individual Attraction
Search Scores in all experiments). We also looked at the Attraction Search
Scores per cue-value pattern.5 The Attraction Search Score was also significantly larger than
zero when looking at the three patterns separately, MPattern1 = 0.25,
t(302) = 6.06, d = 0.35, MPattern2 = 0.26, t(302) = 8.29,
d = 0.48, and MPattern3 = 0.46, t(302) = 13.62, d = 0.78, all
ps < .001. Note, however, that comparing the Attraction Search Scores of
the separate patterns required comparing across different scenarios. To
account for this, we also calculated the Attraction Search Scores for each
scenario across subjects.6 As shown in Figure 4,
all scenario-wise Attraction Search Scores were above zero; however, there
was substantial heterogeneity in the sizes of the scenario-wise Attraction
Search Scores.
One explanation for the heterogeneity of the Attraction Search Scores on
the scenario level might be that our assumed subjective importance of cues
did not match subjects’ subjective importance. Looking at the subjective
importance ratings, our assumed ordering of cues was mostly matched by the
importance ratings of subjects. Subjects’ mean subjective importance
ratings can be found in Table A1 in the
Appendix 7.2. Substantial differences occurred in the
Hotel scenario, in which subjects considered the last cue as most
important. Further, in the Job and in the City Size
scenarios, subjects considered the second cue as more important than the
first, more so for the City Size scenario.
As the Attraction Search Score aggregated over subjects and content
scenarios, we also ran a generalized linear mixed model analysis to
investigate the variation across these variables. In this model, the
dependent variable was whether subjects searched for Option A in any given
trial. The effect-coded predictor in this model was whether Option A was
attractive in this trial (Version a; +1) or not (Version b; −1). A
significant, positive regression weight for the predictor version
would indicate an information-search pattern consistent with the Attraction
Search Effect. To account for variation in the data, we implemented a
maximum random effects structure with random intercepts for subjects and
content scenarios, as well as random slopes for version.
The results of this generalized linear mixed model showed that subjects
were in general more likely to search for information on Option A given
that this option was attractive, β = 0.75, SE = 0.11, z = 6.77,
p < .001 (see Table B1 and Table B2 for all model
estimates). More precisely, the probability of searching information for
Option A increased from 21.7% in Version b to 55.5% in Version a of the
patterns. The effect of pattern version varied across subjects as well as
content scenarios (see Figure 6). Specifically, the
heterogeneity of the content scenarios matched the one we observed in the
aggregated results.
To check whether we could explain some of the heterogeneity when accounting
for differences due to cue-value patterns, we added a Helmert-coded
cue pattern predictor to the mixed model7 as well as the interaction of
cue pattern and version. The effect of version
remained positive and significant, β = 0.88, SE = 0.13, z = 6.84,
p < .001. Additionally, there was a significant effect that subjects were
less likely to search for Option A when faced with Pattern 2 than when
faced with Pattern 1, β = −0.80, SE = 0.07, z = −10.75,
p < .001. Further, the effect of version on information search
depended on cue pattern, such that the version effect was
the most pronounced for Pattern 3 when comparing it to the other two
cue-value patterns, β = 0.15, SE = 0.04, z = 3.72, p <
.001. There also was a larger effect for Pattern 1 compared to Pattern 2,
β = 0.16, SE = 0.07, z = 2.14, p = .032.
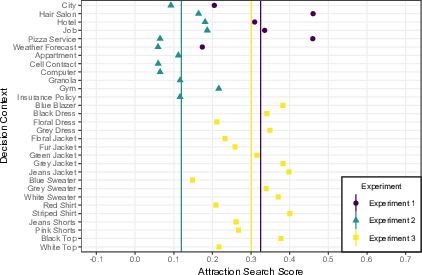
| Figure 4: Distribution of Attraction Search Scores for each decision context in all three experiments. The lines represent the mean Attraction Search Scores across subjects and scenarios in the respective experiments. |
4.3 Discussion
The first experiment shows strong support for the Attraction Search Effect
in semantic contexts different from the hypothetical stock-market game
originally used by (Jekel et al., 2018). Subjects tended to search for
information about the more attractive option in all of the three cue-value
patterns as well as in every content scenario. The effect sizes as well as
the absolute Attraction Search Scores overall and for the separate cue-value
patterns mirror those from (Jekel et al., 2018) in their study without
information search costs (for the Attraction Search Scores in
(Jekel et al., 2018) experiments see
Figure 5).
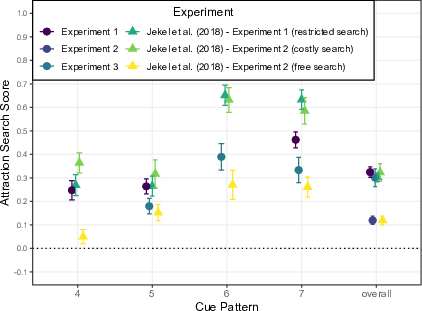
| Figure 5: Mean Attraction Search Scores for
each cue-value pattern and overall from all three experiments in
comparison with the Attraction Search Scores from
(Jekel et al., 2018). The triangles represent the mean
Attraction Search Scores from the first two studies by
(Jekel et al., 2018) for each pattern and overall. Cue-pattern
names on the x axis are the original names from
(Jekel et al., 2018): Patterns 4, 5, and 7 correspond to
Patterns 1, 2, and 3 in Experiment 1, respectively; Patterns 5, 6, and 7
correspond to Patterns 1, 2, and 3 in Experiment 3, respectively. |
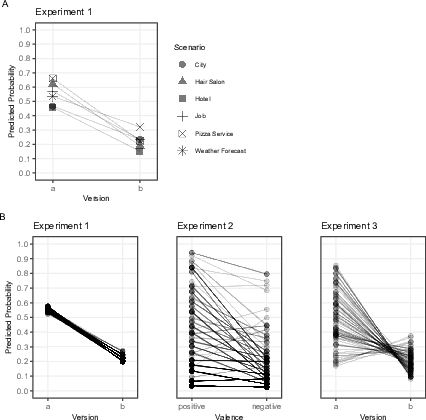
| Figure 6: Predicted probabilities of searching for
Option A (Experiment 1 and 3) or of searching for the same option
(Experiment 2) based on random slopes of mixed logistic regression
analyses. The plot under A represents the random slope for the different
decision scenarios in Experiment 1, the plots under B represent the
random slopes for subjects in all three experiments. These plots can be
read as follows: the more negative the slope between Version a and b (or
positive and negative initial valence in Experiment 2, respectively),
the stronger the predicted Attraction Search Effect for this scenario or
subject. |
Our mixed model analyses reveals that the strength of the Attraction Search
Effect differs between individuals as well as semantic contexts. The
differences in effect size for the semantic contexts might be due to the
fact that our assumed subjective importance ordering did not always match
those of subjects. This assumption is supported by the fact that among the
weakest predicted effects for decision context are the City and the Hotel
Scenario.8
Both semantic contexts showed on average a different ordering in subjects’
importance ratings. In sum, we replicated the results from
(Jekel et al., 2018) in a more diverse setting, however, while still
using the cue-value patterns that were specifically designed to elicit the
Attraction Search Effect. Therefore, it is an important next step to show
that the Attraction Search Effect can be found with different cue-value
patterns.
5 Experiment 2: Extension to different cue patterns
In the second experiment, we extended the results from the first experiment
by testing whether the Attraction Search Effect can be found in more
diverse semantic contexts and even without using specifically designed,
highly diagnostic cue patterns. Therefore, we did not present any
information before search and manipulated only the valence of the first cue
value subjects searched for while randomizing the valence of the remaining
cue values. This experiment and the respective hypothesis were
preregistered (Open Science
Framework; Scharf et al., 2017, osf.io/j7vg4).
5.1 Method
5.1.1 Materials
In addition to the six decision scenarios used in the first experiment, we
developed six further decision contents, ranging from renting a new
apartment to deciding on a new gym or to buying a new computer (all
scenarios and cues can be found in Table 2).
We presented a completely closed mouselab matrix to our subjects. In this
matrix, the valences for all but the first opened cue values were randomly
assigned. The valence of the first searched-for cue value was
counterbalanced, to achieve an experimental manipulation of the
attractiveness of options. This manipulation thus ensures that in six of
the twelve trials the first searched-for cue value yielded positive
information (and thus made the first searched-for option attractive)
whereas in the other six trials the first searched-for cue value yielded
negative information (and thus made the first searched-for option
unattractive). It is important to note that it did not matter which
specific piece of information subjects searched for first for this
manipulation to take effect.
To control whether subjects complied with instructions and read the
decision scenarios, we included a decision scenario recognition test. After
subjects completed the decision trials, they were asked to identify on
which topics they had just decided. For this purpose, they were shown
six out of the twelve original decision scenarios and six distractor
scenarios. If they answered more than two scenarios incorrectly, subjects
were excluded from analysis.
| Table 2: Additional content scenarios and cues in Experiment 2. |
| Granola | Gym |
|
|
| Amount of Dietary Fiber | Monthly Pay |
| Number of Calories | Offered Courses |
| Proportion Organic Ingredients | Equipment |
| Proportion Fairtrade Ingredients | Opening Hours |
|
| Computer | Apartment |
|
|
| Price | Proximity to City Center |
| Speed | Sufficient Lighting |
| Design | Square Footage |
| Loudness | Friendliness of Neighbors |
|
| Insurance Company | Cell Contract |
|
|
| Coverage | Monthly Pay |
| Monthly Pay | Network Reception |
| Accessibility in Case of Damage | Number of Free Minutes |
| Customer Friendliness | Data Volume |
| Note. Scenario names are printed in bold font, the four cue names are printed underneath the respective scenario name.
|
5.1.2 Measures
As we did not use the cue-value patterns from the original study by
(Jekel et al., 2018), we computed the individual Attraction Search
Scores as the difference of the probability of switching options
between the first and the second information search across subjects
and scenarios when the initial evidence was negative vs. positive;
Attraction Search Score = p(switching options|initial negative
information) − p(switching options | initial positive information).9 Switching options when the
initially found evidence is negative is consistent with the Attraction
Search Effect, while switching options when the initially found
evidence is positive is inconsistent search behavior. Therefore, as in
the first experiment, if the Attraction Search Score is larger than
zero, subjects show more behavior in line with the Attraction Search
Effect.
5.1.3 Design and procedure
We manipulated the valence of the first clicked-on cue value (positive vs.
negative) within-subjects. As (Jekel et al., 2018) showed that the
Attraction Search Effect is stronger when information search is costly, we
additionally tried to induce a sense of search costs by restricting the
number of possible searches per trial (either three, five, or seven
searches). We opted for restricting information search instead of
implementing explicit search costs, as implementing monetary search costs
is difficult in preferential decision tasks, especially with hypothetical
tasks conducted online. Since the Attraction Search Effect requires
available information to take effect, restricting search to one piece of
information as in the original experiments by (Jekel et al., 2018) is not
possible in a completely closed matrix. In order to restrict information
search and at the same time to avoid subjects immediately opening the fixed
amount of information granted to them, we opted for restricting information
search variably from trial to trial without subjects knowing beforehand how
much information they could open in this specific trial. This way, every
piece of information subjects chose to open during a trial should
rationally be the most informative piece of information they could choose,
as it could be their last piece of information. Therefore, subjects were
not informed about the restriction of search before starting a trial but
were only informed whenever they opened the maximal number of possible
information for the trial. It is important to note that information search
was restricted only in the sense that subjects could not open more
information — they were free to search for less information than the
allowed amount per trial given they opened at least one cue
value.
The order of trials and thus the valence of the first cue value and the
amount of search was randomized for each subject. After following the link
to the online study, subjects first gave their consent for participating in
the study. Following a practice task, subjects started working on the
actual decision trials. Before each trial, subjects were presented with a
brief introduction into the ensuing content scenario. Subjects had to open
one piece of information in every trial. They could then search for either
two, four, or six additional pieces of information; however, they did not
know how many pieces of information they could search for in a specific
trial. When subjects reached the limit of searchable information in a
trial, they were informed that they could no longer search for additional
information and that they had to decide now (for an example trial of the
decision task see Figure 7). After completing all
12 trials, subjects had to work on the recognition task, in which they had
to identify six of the original content scenarios among a list with
additional six distractor scenarios.10 After finishing this task, subjects went
on to provide some demographic details about themselves and then could
decide whether they wanted to receive course credit; participate in the
lottery, in which they could win one of ten 10€-online shop gift
certificates; or neither of these two options. Finally, subjects were
debriefed and thanked for their participation.
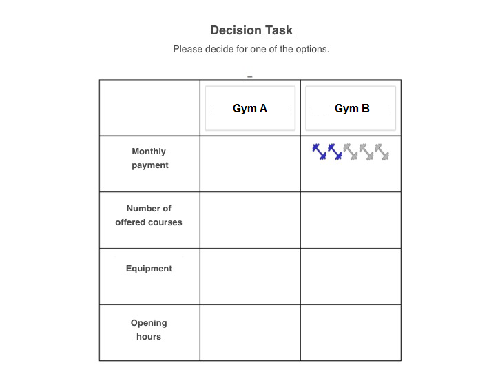
| Figure 7: A translated screenshot of the
decision task in Experiment 2. In the current trial, the valence of the
first opened information was negative (2 of 5 dumbbells). Subjects could
search for information by clicking on the empty boxes in the
matrix. Then the respective cue value would appear. Afterwards, they
chose one of the options by clicking on the button around the options. |
5.1.4 Subjects
An a-priori power analysis assuming α = β = .05 for a one-tailed one sample t test and a small Attraction Search Effect with a Cohen’s d = 0.20 yielded a sample size of 272 subjects (Faul et al., 2007). Due to expected dropout, a sample of 300 subjects was aspired to collect. The stopping rule was to either stop data collection after two months or when 300 subjects were collected. The study was programmed with lab.js (Henninger et al., in press) in conjunction with the Multi-Attribute Decision Builder (Shevchenko, 2019). The original sample included 305 completed data sets. From these 305 subjects, eight subjects were excluded because data were not saved for all of the twelve decision trials. Thus, the complete sample included a sample of 297 subjects (230 female, 1 other, Mage = 22.9, SDage = 5.6). Seventeen subjects were excluded because they answered more than two questions incorrectly in the recognition test. After exclusion, a total of 280 subjects remained in the final sample (217 female, 1 other, 84.6% university students). The mean age of the sample was Mage = 22.8 (SDage = 5.6, range 18–63).
5.2 Results
5.2.1 Preregistered analyses
To test whether the Attraction Search Effect emerged in a preferential decision task without specifically designed patterns, we calculated the Attraction Search Score for each subject over all trials. As predicted, the Attraction Search Score was significantly larger than zero MASS = 0.12, t(279) = 6.82, p < .001, Cohen’s d = 0.41. Thus, we found evidence for the Attraction Search Effect in different semantic contexts and closed cue-value patterns.
5.2.2 Additional exploratory analyses
To compare the heterogeneity between decision scenarios to the first
experiment, we also calculated the Attraction Search Scores for each
scenario across subjects. As shown in Figure 4,
all scenario-wise Attraction Search Scores were above zero and there was
less heterogeneity between scenarios compared to Experiment 1.
To account for the multi-level structure of the data and to explore the
heterogeneity between scenarios further, we also ran a generalized linear
mixed model analysis comparable to that in Experiment 1. In this model, the
dependent variable was whether subjects continued to search for the same
option as in their first search in any given trial. The predictor was
whether the valence of the first opened cue value was positive or
negative. Again, a significant, positive regression weight for the
predictor valence would indicate an information-search pattern
consistent with the Attraction Search Effect. To account for variation in
the data, we implemented a model with random intercepts for subjects and
content scenarios as well as a random slope for valence for
subjects.11
The results of this generalized linear mixed model showed that subjects
were in general more likely to stay with the searched-for option when the
first opened cue value was positive, β = 0.38, SE = 0.11,
z = 3.58, p < .001 (see Table B1 and Table B2
for all model estimates). Specifically, the probability of staying with the
searched-for option increased on average from 6.5%, when the first opened
cue value was negative, to 12.9%, when the first cue value was
positive. The results for the random effects showed considerable variance
of the effect of valence between subjects (see
Figure 6).
Looking at the distribution of the Attraction Search Score values in
Figure 3 and the heterogeneity of the individual effects
in the mixed model, it was apparent that there is a large proportion of
subjects that did not show the Attraction Search effect. In fact, the
median of the overall Attraction Search Score distribution was
MdASS = 0. One difference between subjects with an Attraction Search
Score of zero and subjects with a non-zero Attraction Search Score was the
amount of searched cue values. Subjects with an Attraction Search Score of
zero tended to search for more cue values, MASS=0 = 4.72, than
subjects with a non-zero Attraction Search Score, MASS≠0 = 4.57,
t(277.09) = −2.61, p = .010, Hedge’s g = −0.31. Additionally, we
found that subjects with higher individual Attraction Search Scores tended
to take longer to open the first cue value, r(278) = .341, p < .001.
To further investigate subjects who had an Attraction Search Score of zero,
we hypothesized that some subjects used predetermined, fixed search
strategies. To test this assumption, we formulated three different search
strategies: strictly cue-wise, lenient cue-wise, and strictly option-wise
information search.12 The strictly cue-wise search was
defined as subjects starting to search for information on one option’s
side, continuing their search on the same cue on the other option’s side,
and then returning to the first option’s side for the ensuing search and so
on. The lenient cue-wise search also was defined as always searching for
two pieces of information from the same cue consecutively but did not
require to always start the search on the same option. The strictly
option-wise search was defined as searching information on one option until
all information for this option was acquired and then switching to the
other option. On average, subjects used a strictly cue-wise search strategy
in 39.1% (SD = 25.0), a lenient cue-wise search strategy in 23.7%
(SD = 17.9), and an option-wise search strategy in 7.1% (SD = 14.2) of
trials. In 30.1% (SD = 23.4) of trials, subjects’ information-search
pattern could not be classified as belonging to one of the aforementioned
strategies. Thus, in over half of all trials some kind of fixed cue-wise
search strategy was used.
In order to test whether the occurrence of Attraction Search Scores of zero
could be explained by subjects using predetermined search strategies, we
correlated the individual Attraction Search Scores with the number of
trials of each subject belonging to one of formulated search
strategies. Indeed, the correlation of individual Attraction Search Scores
and the number of trials in which subjects searched strictly cue-wise was
negative, r = −.31, n = 280, p < .001; indicating that subjects who
searched for information strictly cue-wise in more trials had lower
Attraction Search Scores. The results were similar for the lenient cue-wise
strategy for which the correlation was negative as well, r = −.16,
n = 280, p = .008. For the number of trials searched following an
option-wise strategy, we found a positive correlation, r = .28,
n = 280, p < .001. The correlation between the number of unclassified
trials per subject and the individual Attraction Search Scores was also
positive, r = .28, n = 280, p < .001. Therefore, subjects with a low
Attraction Search Score had a stronger tendency to search for information
consistent with a pre-determined, cue-wise search strategy.
To analyze the influence of strategies on the trial level, we ran the same
mixed logistic regression as described above and added the count of trials
following any of the above-mentioned strategies as a
predictor.13 In this model, the probability of searching for the
same option was 12.6% when finding initial positive evidence compared to
6.2% when finding initial negative evidence, β = 0.38, SE = 0.11,
z = 3.63, p < .001 (see Table B1 and Table B2
for all model estimates). Additionally, the more trials in which a subject
showed information-search behavior that followed a specific strategy the
less likely she was to continue to search for the same option,
β = −0.41, SE = 0.04, z = −9.99, p < .001. The number of trials
following a search strategy also influenced the strength of the effect of
the first opened cue value, β = −0.09, SE = 0.03, z = −2.71,
p = .007. This interaction took the effect that if no strategy was used
in any trial, the predicted probability of searching for the same option
when the initial information was positive was 90.4% compared to 51.0%
when the initial information was negative. On the other hand, when an
information search strategy was used in every trial, the predicted
probability of searching for the same option was 2.3% when the initial
information was positive and 2.0% when the initial information was
negative. Note that the overall effect of searching with a strategy
was negative because cue-wise search strategies, which had a negative
effect on the Attraction Search Score, were much more common (in total
62.8% of trials) than option-wise search strategies (7.1% of trials),
which had a positive effect on the Attraction Search Score.
5.3 Discussion
In the second experiment, we took a step further away from the original
setup of (Jekel et al., 2018) by extending the range of semantic contexts
and using closed cue-value patterns with randomized cue values. The results
show that the Attraction Search Effect emerges under these conditions as
well and, thus, does not appear only when using highly diagnostic cue-value
patterns. Further, in contrast to the first experiment, the effect of the
valence manipulation did not differ between decision contexts and there
were systematic differences only in how likely subjects were to continue to
search for the same option in different contexts. The systematic
differences in the valence effect between different scenarios might be
absent because in this experiment the prediction of the Attraction Search
Effect did not require the subjects to have the correct subjective
importance ordering. Rather, we assumed that the first opened cue is likely
to be the most valid cue.
We did observe a considerable drop in effect size in the second experiment
compared to the first. This drop is due to a large number of subjects who
had an Attraction Search Score of zero. This finding is also supported by
the large variability due to subjects in the mixed model analysis. The
heterogeneity can partly be explained by looking at subjects’ search
behavior: Subjects with Attraction Search Scores of zero tended to search
for more information. Additionally, subjects with lower Attraction Search
Scores tended to open the first cue value faster and searched for
information in a cue-wise fashion in more trials. The results of the mixed
logistic regression corroborate these findings by showing that the
Attraction Search Effect is weakened the more subjects followed specific
information search strategies on the trial level. Taken together, these
exploratory results show similarities to Jekel et al.’s (2018) results in
the condition without search costs. (Jekel et al., 2018) showed that
subjects searched for more information faster and that individual
Attraction Search Scores were considerably reduced when no information
search costs were implemented. Thus, the results of Experiment 2 indicate
that the restriction of search might not have been strong enough to induce
a sense of search costs.
Besides the aforementioned limitations, we still found a medium-sized
Attraction Search Effect in an experiment that did not rely on a specific
semantic context or specifically designed cue-value patterns. Thus, the
results of this experiment emphasize the overall robustness of the effect
and the range of applicability of iCodes.
| Table 3: Version a and Version b of cue patterns used in Experiment 3. |
| | Pattern 1 | Pattern 2 | Pattern 3 |
|
| | A | B | A | B | A | B |
|
Cue 1 | +(−) | ? | +(−) | −(+) | +(−) | −(+) |
Cue 2 | +(−) | ? | ? | ? | ? | ? |
Cue 3 | ? | ? | + | − | + | − |
Cue 4 | ? | ? | − | + | − | ? |
| Note. + = positive cue value, − = negative cue value, ? = hidden, searchable cue value; Version a of patterns is displayed, cue values in parentheses are from Version b. Patterns 1, 2, and 3 correspond to Patterns 5, 6, and 7, respectively, in (Jekel et al., 2018). |
6 Experiment 3
Experiment 3 varied another aspect of the decision task that has been kept
constant in Jekel et al.’s (2018) studies and in our studies so far: the
way in which information is presented. Until now, every experiment testing
the predictions of iCodes has used the matrix presentation of the classic
mouselab task. It has been shown that the way information is presented
influences information-search behavior
(BettmanKakkar, 1977,Ettlin et al., 2015). Presenting information in a
matrix organizes the information for the decision maker and this
organization in turn influences search behavior
(SchkadeKleinmuntz, 1994). Thus, in this experiment we test whether
the Attraction Search Effect still emerges in a quasi-realistic online shop
setting. The subjects’ task in this experiment was to imagine being a buyer
for an online clothing shop and to buy clothes online. In addition, as the
two previous experiments were both run in German and with German samples,
we decided to collect data from a different, non-German subject pool via
the platform Prolific (PalanSchitter, 2018). This
experiment and our hypothesis were preregistered (Open Science
Framework; Scharf et al., 2018, osf.io/nfruq).
6.1 Method
6.1.1 Materials
Cue patterns.
As in Experiment 1, we again used a subset of
the original cue-value patterns from (Jekel et al., 2018). As described
above, each pattern has two versions that differ in which option is
currently more attractive. For this experiment, we selected three from the
original eight patterns, displayed Table 3. Pattern 2 and
Pattern 3 were chosen because they elicited the strongest and the second
strongest Attraction Search Effect in the original studies. Pattern 1,
which elicited the fourth strongest Attraction Search Effect in the
original studies, was chosen to include a pattern that showed a strong
effect but at the same time has more than three searchable cue
values. Thus, the addition of Pattern 1 was supposed to increase the
variability between patterns. Each pattern in both versions was presented
three times, leading to a total number of 18 trials per subject.
Shop items.
We used images of 18 different items of clothing
for this experiment. These articles of clothing were each described by
customer ratings on four attributes. Subjects were told that these
attributes differed in their relative importance for the online shop they
are shopping for. The attributes in the order of their importance were the
fit of the clothes, the comfort of the fabric, the availability of sizes,
and the ease of care. The customer ratings were dichotomized, such that a
negative overall rating of one of the attributes was described by two stars
and a positive overall rating was described by five stars. To increase the
realism of the online shop, each item was assigned a fictional brand name
(four-letter pseudowords adapted from StarkMcClelland, 2000) and a
fictional brand logo. In each trial, subjects had to decide between the
same article of clothing that differed in their brands and the customer
ratings of their attributes only. An example trial is displayed in
Figure 8.
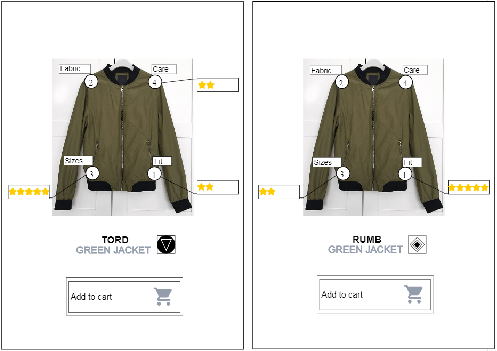
| Figure 8: A screenshot of the decision task in
Experiment 3. The current cue-value pattern is Pattern 3 in Version
b. Subjects could search for information by clicking on the number under
the cue name. The number indicated the importance of the cue for the
decision, with "1" representing the most important attribute and "4"
representing the least important attribute. Then the respective cue
value would appear. Afterwards, they chose one of the options by
clicking on its "Add to cart" button. |
6.1.2 Measures
Just as in Experiment 1, we computed the individual Attraction Search
Scores as the difference of the probability of searching for Option A in
the nine trials of Version a vs. of Version b across articles of clothing,
Attraction Search Score = p(Searching Option A | Version a)
− p(Searching Option A | Version b).14
6.1.3 Design and procedure
All subjects were presented with all cue-value patterns in both versions
and all shop items in a total of 18 trials (3 cue-value patterns x 2
pattern versions x 3 repetitions). Note that the cue patterns were repeated
but not the items of clothing. The order of trials as well as the
combination of cue-value patterns, shop items, logos, and brand names were
randomized for each subject. We further balanced presentation of the
cue-value patterns for the repetitions, such that Option A of each pattern
was once on the left side, once on the right side, and assigned to a side
randomly for the third repetition. The online experiment was programmed in
lab.js (Henninger et al., in press) and run via the platform
Prolific (PalanSchitter, 2018). Subjects received £1.10 for their participation. Before working on the actual task, subjects
agreed to an informed consent form and read the instructions for the
task.
Subjects were asked to imagine that they work as a buyer for an online
clothing shop and that their task was to choose 18 different articles of
clothing in order to restock their employer’s warehouse. We included three
questions about the instructions that had to be answered correctly before
the subjects could continue with the actual task. The number of repetitions
it took to answer these questions correctly were used as an exclusion
criterion, such that when subjects had to repeat these questions more then
once they were excluded from analysis. During the task, subjects were
allowed to search one additional piece of information, after which they had
to decide which article of clothing they wanted to buy. Before finishing
the study, subjects were asked to provide some demographic information and
were then thanked for their participation.
6.1.4 Subjects
In a student project conducted to pretest the materials, we found an
Attraction Search Effect with an effect size of Cohen’s d = 1.34 with
N = 312. As the current experiment was run in a non-German and likely
more diverse sample, we decided to be rather conservative for our
sample-size rationale. A sensitivity analysis revealed that we could find
an effect of Cohen’s d = 0.33 for a one-sided one-sample t-test with an
α = β = .05 and a sample of N = 100 subjects. As we expected
some experimental mortality due to the fact that this experiment was run
online, we aimed to collect 10% more than the needed sample, which
resulted in a total sample size of 110 subjects. We collected data of
N = 110 subjects, from which N = 99 were complete data sets (48 female,
1 other, Mage = 31.3, SDage = 10.0). Ten subjects were excluded
because they had to repeat the instruction check two or more times which
resulted in a final sample of N = 89 (44 female, 1 other, 16.9%
university students). The mean age of the sample was Mage = 31.3
(SDage = 10.0, Range 18–60). All but one subject indicated that they
were native English speakers.
6.2 Results
6.2.1 Preregistered analyses
Just as in the first and the second experiment, we hypothesized that the
average Attraction Search Score is significantly larger than zero. In order
to test this hypothesis, we calculated the individual Attraction Search
Scores for all subjects. The mean Attraction Search Score was
MASS = 0.30, t(88) = 7.92, p < .001, Cohen’s d =
0.84. Therefore, we found evidence for subjects’ search behavior being
consistent with iCodes’s predictions even when the cue-value information
was not presented in a matrix.
6.2.2 Exploratory analyses
As a first exploratory analysis, we tested whether we could find an
Attraction Search Score larger than zero when looking at the three patterns
separately.15 Each pattern yielded a significantly positive Attraction Search
Score, MPattern1 = 0.18, t(88) = 5.47, d = 0.58,
MPattern2 = 0.39, t(88) = 6.87, d = 0.73, and
MPattern3 = 0.33, t(88) = 6.23, d = 0.66, all p < .001. We also
calculated the Attraction Search Scores for each article of clothing, which
can be found in Figure 4. The heterogeneity
between items of clothing seemed to be more pronounced than in Experiment 2
but somewhat less pronounced than in Experiment 1.
We also ran a generalized linear mixed model for Experiment 3. Just as in
Experiment 1, the dependent variable was whether subjects searched for
Option A in any given trial and the effect-coded predictor was whether
Option A was attractive in that trial (Version a; +1) or not (Version b;
−1). To account for variation in the data, we added random intercepts for
subjects and content scenarios as well as a random slope for
version for subjects.16
The results showed that subjects were on average more likely to search for
information on Option A given that this option was attractive,
β = 0.76, SE = 0.10, z = 7.18, p < .001 (see
Table B1 and Table B2 for all model
estimates). Specifically, the probability of searching information for
Option A increased from 18.5% in Version b of the pattern to 51.0% in
Version a of the pattern. At the same time, the effect of pattern version
varied across subjects systematically, as shown in
Figure 6.
To try to explain some of the inter-individual variance in the effect, we
added the Helmert-coded cue pattern predictor17 to the
model. The effect of version was still significantly positive in
this model, β = 0.91, SE = 0.14, z = 6.60, p < .001, indicating
that the probability of searching for Option A increased from 14.3% in
Version b to 50.8% in Version a. There were also significant effects for
both pattern predictors, indicating that subjects were more likely to
search for Option A in Pattern 2 compared to Pattern 1, β = 1.36,
SE = 0.11, z = 12.96, p < .001, as well as in Pattern 3 compared to
Pattern 1 and 2, β = 0.18, SE = 0.05, z = 3.81, p <
.001. However, there was no significant interaction between the
cue pattern and the version predictors, ps > .100.
6.3 Discussion
The results of Experiment 3 show that the Attraction Search Effect is not
restricted to a matrix presentation format but can also be found in a more
realistic, less restrictive setting. The effect sizes of the separate cue
patterns as well as the absolute Attraction Search Scores are comparable to
those of (Jekel et al., 2018) in the condition without search costs (see
Figure 5), as all three patterns show a medium
to large effect. The results plotted in Figure 3 further
show that, albeit not restricted to the original cue-value patterns, the
effect is more pronounced with the original cue-value patterns, when
comparing the results of Experiment 2 with Experiment 3. We do not find the
same level of heterogeneity between decision contexts in Experiment 3
compared to the first experiment (see
Figure 4). This might be explained by the fact
that the decision content is more homogeneous in Experiment 3 compared to
Experiment 1 because all decisions were made between articles of
clothing. There is also no evidence in the results of Experiment 3 for the
same interaction of the cue patterns and the cue pattern version that was
found in Experiment 1. The absent interaction is probably due to two
reasons: first, the original effect sizes in (Jekel et al., 2018) of the
cue patterns used in Experiment 3 were more homogenous from the start when
compared to the cue patterns from Experiment 1. Second, the interaction between
subjective importance of cues and option attractiveness was reduced in
Experiment 3 as the ordering of the cues’ importance was given at the start
of the experiment.
7 General discussion
The Attraction Search Effect is the core prediction by iCodes that states
that information search is influenced not only by the validity of the
information but also by the attractiveness of the
options. (Jekel et al., 2018) provided first evidence for this prediction
in three experiments that all shared the same task characteristics and the
same semantic content. The goal of the current project was to test the
range of applicability of iCodes’s search predictions. For this purpose, we
ran three conceptual replications of the original studies that varied
aspects that were kept constant in the original experiments. In the first
experiment, we showed that the Attraction Search Effect is not restricted
to the probabilistic-inference tasks in Jekel et al.’s (2018) experiments
but also emerges in preferential decision tasks in six every-day content
domains. The results of the second experiment, which was preregistered,
illustrate that the Attraction Search Effect generalizes to a wider range
of different semantic contexts and further show that the Attraction Search
Effect also emerges without specifically designed and diagnostic cue-value
patterns, albeit with a somewhat reduced effect size. In the last
experiment, also preregistered, we found evidence that the Attraction
Search Effect is also present when one moves away from the classic matrix
format of information presentation to a more realistic simulated
online-shop setting. Thus, we found evidence for iCodes’s
information-search prediction in three experiments with in total 627
subjects. These results show that the influence of the already available
information on information-search direction is a robust phenomenon that can
be found in different variants of the classic multi-attribute decision
task. They further strengthen iCodes as a general theory of decision making
and information search.
7.1 Limitations and future directions
The results of Experiment 2 show that there are boundary conditions for the
generalizability of the Attraction Search Effect. As the second experiment
was the only experiment that did not use the cue-value patterns from
(Jekel et al., 2018) and did not restrict information search to one piece
of information, it is likely that the reduced effect size in Experiment 2
was at least partially caused by the change in the experimental setup. The
change from specifically designed, diagnostic cue-value patterns to
randomized cue-value patterns naturally weakens the effect of the
experimental manipulation, as the reduced experimental control due to the
randomization of cue values may have increased the noise in the data. The
second aspect that was different in Experiment 2 compared to the two other
experiments was that search was less restrictive. The original results by
(Jekel et al., 2018) showed that costly or restricted search is relevant
for the strength of the Attraction Search Effect. It is possible that the
restriction of search, that varies from trial to trial, we used to
implement search costs was not strong enough to elicit a reliable
Attraction Search Effect for many subjects who instead opted for a
heuristic search strategy. This assumption is supported by the fact that
subjects that showed no Attraction Search Effect tended to search for more
information and did so faster than subjects that did show the Attraction
Search Effect in this experiment, just like subjects in the condition
without search costs in (Jekel et al., 2018). In fact, individual
Attraction Search Scores tended to be lower for subjects that used cue-wise
search strategies more often and higher for subjects whose search behavior
could not be classified as belonging to one search strategy.
The results of Experiment 2 show that we observed larger interindividual
heterogeneity in the Attraction Search Effect than in Experiments 1 and 3
in this paper (see Figure 3). This larger heterogeneity in
Experiment 2 was also revealed by the mixed model analyses of all three
experiments. The fact that the most variance in individual Attraction
Search Effects was found in Experiment 2 hints that the diagnostic
cue-value patterns as well as the restricted information search are
relevant for the homogeneity and strength of the effect. Future research
should tease apart the effects underlying the heterogeneity of the
Attraction Search Effect.
The variability of individual Attraction Search Effects in Experiment 2
also points to hidden moderators determining the individual strength of the
effect. (Jekel et al., 2018) already identified search costs as a
moderator of the Attraction Search Effect and the results of Experiment 2
corroborate this finding. A still unanswered question is what happens to
the information-search process when information-search costs are
introduced. One explanation for the effect of search costs might be that
costs increase the deliberation about the search decision
(Jekel et al., 2018). This assumption is corroborated by the fact that
subjects with a higher Attraction Search Score tend to take slightly longer
to search for the first piece of information. A promising avenue for future
research is to investigate the role of deliberation in the Attraction
Search Effect more closely, for example by employing dual-task
(SchulzeNewell, 2016) or time-pressure manipulations
(RieskampHoffrage, 2008,Payne et al., 1988). Further, the
emergence of the Attraction Search Effect might be moderated by different
individual characteristics. One may assume, for example, that subjects
differ in their tendency to focus on the more attractive option
(MatherCarstensen, 2005,Noguchi et al., 2006). When investigating
potential moderators of the effect, one should keep in mind that using the
original cue-value patterns decreases heterogeneity of the Attraction
Search Effect and thus might mask interinidvidual differences.
While finding substantial interindividual differences in the Attraction
Search Effect, we find only a little evidence for differences in Attraction
Search Effect between content scenarios. Only in Experiment 1 do we find
support for differences between decision contexts from the mixed model
analyses. This might be due to the fact that in that experiment only
the order of subjective importance for the cues was implied rather than
explicitly stated (Experiment 3) or inferred from subjects’ behavior
(Experiment 2). This explanation is further supported by the fact that the
same decision scenarios that differed in effect size in Experiment 1 were
also included in Experiment 2 and did not show the same variability in that
experiment. The findings with regard to decision contexts emphasize the
role of cues’ importance in the information-search process and, thus,
reveals an important variable to control in future investigations of the
Attraction Search Effect.
When comparing our results to those from (Jekel et al., 2018), we find
that the overall Attraction Search Score results from Experiments 1 and 3
are similar to those of the experiments with restricted and costly
information search by (Jekel et al., 2018), whereas the results from
Experiment 2 are comparable to Jekel et al.’s experiment without
information search costs (see Figure 5). The
effect sizes in our three experiments are considerably reduced compared to
the original results, but they are still medium (Experiment 2) to large
(Experiment 1 and 3). Next to reducing the level of experimental control in
our replications, this decrease is probably also due to the reduced number
of trials in our studies, which reduces the reliability of the estimation
per individual. Nonetheless, the fact that we are still able to find the
Attraction Search Effect with fewer trials opens up the possibility to
investigate even more diverse contexts.
One of iCodes’ advantages is that it is a fully formalized model that gives
process descriptions of a well-documented phenomenon of information search
(Doherty et al., 1979,Mynatt et al., 1993,Hart et al., 2009). The
formalization of iCodes allows researchers to determine the fit of the
observed behavior with model predictions and to compare this fit with the
search predictions of other models for information search
(Jekel et al., 2018). One prerequisite for fitting iCodes, however, is
knowing the exact cue validities, as they heavily influence iCodes
predictions. In case of preferential tasks, the importance of cues is
difficult to determine due to the subjective nature of the relative
importance of the cues. Further, we do not know the relationship between
ratings of importance and perceptions of cue validities. In the current
experiments, we opted to test iCodes’s qualitative predictions for
information search only. In order to fit iCodes to search behavior in
preferential tasks, one might utilize methods such as conjoint analysis
(as, for example, done in Meißner et al., 2015) in order to deduce the
individual importance weights.
In this project, we varied the semantic content, the cue-value patterns,
and the way of information was presented to test whether the Attraction
Search Effect generalizes to various decision settings. However, there are
still multiple aspects of the decision situation that have been kept
constant between the experiments in this project and the experiments by
(Jekel et al., 2018). A next step might be to change the way information
is presented more radically, for example by randomizing the position of the
information on the screen between trials, as has been done for instance in
(Söllner et al., 2013), so that subjects can not memorize the
positions on screen. In addition, it might be interesting to refrain from
using variants of the classic decision board altogether by utilizing a
procedure in which subjects can naturally search for information by asking
questions (Huber et al., 2011). Another
characteristic all studies shared was that information search was tracked
in a mouselab-type setting via recording mouse clicks on a computer
screen. As using the mouselab setup for process tracing might influence
information search
(GlöcknerBetsch, 2008,LohseJohnson, 1996), a fruitful
avenue for future research might be to investigate information search with
other process-tracing measures such as eye-tracking. Utilizing eye-tracking
as a process-tracing method for information search would further allow one
to observe information-search behavior in naturalistic settings, such as an
actual online shop.
With showing that the Attraction Search Effect appears in diverse settings,
we take a step closer to connecting iCodes’s predictions to the already
existing literature on biased information search. Selective exposure,
pseudo-diagnostic search, and leader-focused search have all been
investigated in various semantic settings and paradigms
(Mynatt et al., 1993,Fraser-MackenzieDror, 2009,CarlsonGuha, 2011). In this project, we could show that the
Attraction Search Effect also generalizes to diverse contextual
settings. In future research, the iCodes model could be extended in such a
way that it can be applied to data from different research paradigms for
biased information search. Doing so would allow a bridge to prior research
and extend the applicability of iCodes. It would also allow researchers to
test which parameters in the iCodes model are affected by manipulations
that have been known to influence biased information search (see Hart et al., 2009, for
an overview of potential moderators of selective
exposure).
7.2 Conclusion
We showed that the Attraction Search Effect, an important prediction of the
new iCodes model, is a robust finding that is not restricted to specific
decision task settings. The results of the three experiments further
highlight that the already available information about choice options is
highly relevant for information search and that the direction of
information search is not necessarily subject to strict rules but rather is
influenced by coherence as well.
References
-
[Bates et al., 2015]
-
Bates, D., Mächler, M., Bolker, B., & Walker, S. (2015).
Fitting Linear Mixed-Effects Models Using lme4.
Journal of Statistical Software, 67(1), 1–48,
https://doi.org/10.18637/jss.v067.i01.
- [BettmanKakkar, 1977]
-
Bettman, J. R. & Kakkar, P. (1977).
Effects of information presentation format on consumer information
acquisition strategies.
Journal of Consumer Research, 3(4), 233–240,
https://doi.org/10.1086/208672.
- [Bredenkamp, 1980]
-
Bredenkamp, J. (1980).
Theorie und Planung Psychologischer Experimente.
Heidelberg: Steinkopff-Verlag.
- [Bröder, 2000]
-
Bröder, A. (2000).
Assessing the empirical validity of the "take-the-best" heuristic as
a model of human probabilistic inference.
Journal of Experimental Psychology: Learning, Memory, and
Cognition, 26(5), 1332–1346,
https://doi.org/10.1037/0278-7393.26.5.1332.
- [Bröder, 2003]
-
Bröder, A. (2003).
Decision making with the "adaptive toolbox": Influence of
environmental structure, intelligence, and working memory load.
Journal of Experimental Psychology: Learning, Memory, and
Cognition, 29(4), 611–625,
https://doi.org/10.1037/0278-7393.29.4.611.
- [BöckenholtHynan, 2006]
-
Böckenholt, U. & Hynan, L. S. (2006).
Caveats on a process‐tracing measure and a remedy.
Journal of Behavioral Decision Making, 7(2), 103–117,
https://doi.org/10.1002/bdm.3960070203.
- [CarlsonGuha, 2011]
-
Carlson, K. A. & Guha, A. (2011).
Leader-focused search: The impact of an emerging preference on
information search.
Organizational Behavior and Human Decision Processes, 115(1), 133–141, https://doi.org/10.1016/j.obhdp.2010.12.002.
- [Doherty et al., 1979]
-
Doherty, M. E., Mynatt, C. R., Tweney, R. D., & Schiavo, M. D. (1979).
Pseudodiagnosticity.
Acta Psychologica, 43(2), 111–121,
https://doi.org/10.1016/0001-6918(79)90017-9.
- [Ettlin et al., 2015]
-
Ettlin, F., Bröder, A., & Henninger, M. (2015).
A new task format for investigating information search and
organization in multiattribute decisions.
Behavior Research Methods, 47(2), 506–518,
https://doi.org/10.3758/s13428-014-0482-y.
- [Evans et al., 2002]
-
Evans, J. S. B. T., Venn, S., & Feeney, A. (2002).
Implicit and explicit processes in a hypothesis testing task.
British Journal of Psychology, 93(1), 31–46,
https://doi.org/10.1348/000712602162436.
- [Faul et al., 2007]
-
Faul, F., Erdfelder, E., Lang, A.-G., & Buchner, A. (2007).
G*Power 3: A flexible statistical power analysis program for the
social, behavioral, and biomedical sciences.
Behavior Research Methods, 39(2), 175–191,
https://doi.org/10.3758/BF03193146.
- [FischerGreitemeyer, 2010]
-
Fischer, P. & Greitemeyer, T. (2010).
A New Look at Selective-Exposure Effects: An
Integrative Model.
Current Directions in Psychological Science, 19(6),
384–389, https://doi.org/10.1177/0963721410391246.
- [Fischer et al., 2011]
-
Fischer, P., Lea, S., Kastenmüller, A., Greitemeyer, T., Fischer, J., & Frey,
D. (2011).
The process of selective exposure: Why confirmatory information
search weakens over time.
Organizational Behavior and Human Decision Processes, 114(1), 37–48, https://doi.org/10.1016/j.obhdp.2010.09.001.
- [Fraser-MackenzieDror, 2009]
-
Fraser-Mackenzie, P. A. F. & Dror, I. E. (2009).
Selective information sampling: Cognitive coherence in evaluation
of a novel item.
Judgment and Decision Making, 4(4), 307–316.
- [Frey, 1986]
-
Frey, D. (1986).
Recent Research on Selective Exposure to Information.
In L. Berkowitz (Ed.), Advances in Experimental Social
Psychology, volume 19 (pp. 41–80). Academic Press.
- [Gigerenzer et al., 2014]
-
Gigerenzer, G., Dieckmann, A., & Gaissmaier, W. (2014).
Efficient cognition through limited search.
In P. M. Todd, G. Gigerenzer, & T. A. R. Group (Eds.), Ecological Rationality: Intelligence in the World. Cary: Oxford
University Press.
- [GigerenzerGoldstein, 1996]
-
Gigerenzer, G. & Goldstein, D. G. (1996).
Reasoning the fast and frugal way: Models of bounded rationality.
Psychological Review, 103(4), 650–669,
https://doi.org/10.1037/0033-295X.103.4.650.
- [GigerenzerTodd, 1999]
-
Gigerenzer, G. & Todd, P. M. (1999).
Fast and frugal heuristics: The adaptive toolbox.
In Simple heuristics that make us smart, Evolution and
cognition. (pp. 3–34). New York: Oxford University Press.
- [GlöcknerBetsch, 2008]
-
Glöckner, A. & Betsch, T. (2008).
Multiple-reason decision making based on automatic processing.
Journal of Experimental Psychology: Learning, Memory, and
Cognition, 34(5), 1055–1075,
https://doi.org/10.1037/0278-7393.34.5.1055.
- [GlöcknerBetsch, 2012]
-
Glöckner, A. & Betsch, T. (2012).
Decisions beyond boundaries: When more information is processed
faster than less.
Acta Psychologica, 139(3), 532–542,
https://doi.org/10.1016/j.actpsy.2012.01.009.
- [Glöckner et al., 2010]
-
Glöckner, A., Betsch, T., & Schindler, N. (2010).
Coherence shifts in probabilistic inference tasks.
Journal of Behavioral Decision Making, 23(5), 439–462,
https://doi.org/10.1002/bdm.668.
- [Glöckner et al., 2012]
-
Glöckner, A., Heinen, T., Johnson, J. G., & Raab, M. (2012).
Network approaches for expert decisions in sports.
Human Movement Science, 31(2), 318–333,
https://doi.org/10.1016/j.humov.2010.11.002.
- [Glöckner et al., 2014]
-
Glöckner, A., Hilbig, B. E., & Jekel, M. (2014).
What is adaptive about adaptive decision making? A parallel
constraint satisfaction account.
Cognition, 133(3), 641–666,
https://doi.org/10.1016/j.cognition.2014.08.017.
- [GlöcknerHodges, 2010]
-
Glöckner, A. & Hodges, S. D. (2010).
Parallel constraint satisfaction in memory-based decisions.
Experimental Psychology, 58(3), 180–195,
https://doi.org/10.1027/1618-3169/a000084.
- [Hart et al., 2009]
-
Hart, W., Albarracín, D., Eagly, A. H., Brechan, I., Lindberg, M. J., &
Merrill, L. (2009).
Feeling validated versus being correct: A meta-analysis of
selective exposure to information.
Psychological Bulletin, 135(4), 555–588,
https://doi.org/10.1037/a0015701.
- [HarteKoele, 2001]
-
Harte, J. M. & Koele, P. (2001).
Modelling and describing human judgement processes: The
multiattribute evaluation case.
Thinking & Reasoning, 7(1), 29–49,
https://doi.org/10.1080/13546780042000028.
- [HausmannLäge, 2008]
-
Hausmann, D. & Läge, D. (2008).
Sequential evidence accumulation in decision making: The individual
desired level of confidence can explain the extent of information
acquisition.
Judgment and Decision Making, 3(3), 229–243.
- [Henninger et al., in press]
-
Henninger, F., Shevchenko, Y., Mertens, U. K., & Hilbig, B. E. (in press).
lab.js: A free, open, online study builder.
Behavior Research Methods,
https://doi.org/10.5281/zenodo.597045.
- [Huber et al., 2011]
-
Huber, O., Huber, O. W., & Schulte-Mecklenbeck, M. (2011).
Determining the information that participants need: Methods of
active information search.
In M. Schulte-Mecklenbeck, A. Kühberger, & R. Ranyard (Eds.), A Handbook of Process Tracing Methods for Decision Research: A
Critical Review and User’s Guide (pp. 65–85). New York:
Psychology Press.
- [Jekel et al., 2018]
-
Jekel, M., Glöckner, A., & Bröder, A. (2018).
A new and unique prediction for cue-search in a parallel-constraint
satisfaction network model: The attraction search effect.
Psychological Review, 125(5), 744–768,
https://doi.org/10.1037/rev0000107.
- [Johnson et al., 1989]
-
Johnson, E. J., Payne, J. W., Bettman, J. R., & Schkade, D. A. (1989).
Monitoring information processing and decisions: The mouselab
system.
Technical report, Duke University, Durham, NC, Center For Decision
Studies.
- [Kuznetsova et al., 2017]
-
Kuznetsova, A., Brockhoff, P. B., & Christensen, R. H. B. (2017).
lmerTest Package: Tests in Linear Mixed Effects Models.
Journal of Statistical Software, 82(13), 1–26,
https://doi.org/10.18637/jss.v082.i13.
- [LeeCummins, 2004]
-
Lee, M. D. & Cummins, T. D. R. (2004).
Evidence accumulation in decision making: Unifying the “take the
best” and the “rational” models.
Psychonomic Bulletin & Review, 11(2), 343–352,
https://doi.org/10.3758/BF03196581.
- [LohseJohnson, 1996]
-
Lohse, G. L. & Johnson, E. J. (1996).
A comparison of two process tracing methods for choice tasks.
Organizational Behavior and Human Decision Processes, 68(1), 28–43, https://doi.org/10.1006/obhd.1996.0087.
- [Makel et al., 2012]
-
Makel, M. C., Plucker, J. A., & Hegarty, B. (2012).
Replications in psychology research: How often do they really
occur?
Perspectives on Psychological Science, 7(6), 537–542,
https://doi.org/10.1177/1745691612460688.
- [Marewski, 2010]
-
Marewski, J. N. (2010).
On the theoretical precision and strategy selection problem of a
single-strategy approach: A comment on Glöckner, Betsch, and
Schindler (2010).
Journal of Behavioral Decision Making, 23(5), 463–467,
https://doi.org/10.1002/bdm.680.
- [MatherCarstensen, 2005]
-
Mather, M. & Carstensen, L. L. (2005).
Aging and motivated cognition: the positivity effect in attention and
memory.
Trends in Cognitive Sciences, 9(10), 496–502,
https://doi.org/10.1016/j.tics.2005.08.005.
- [Meißner et al., 2015]
-
Meißner, M., Musalem, A., & Huber, J. (2015).
Eye tracking reveals processes that enable conjoint choices to become
increasingly efficient with practice.
Journal of Marketing Research, 53(1), 1–17,
https://doi.org/10.1509/jmr.13.0467.
- [Mynatt et al., 1993]
-
Mynatt, C. R., Doherty, M. E., & Dragan, W. (1993).
Information relevance, working memory, and the consideration of
alternatives.
The Quarterly Journal of Experimental Psychology Section A,
46(4), 759–778, https://doi.org/10.1080/14640749308401038.
- [Newell et al., 2003]
-
Newell, B. R., Weston, N. J., & Shanks, D. R. (2003).
Empirical tests of a fast-and-frugal heuristic: Not everyone
“takes-the-best”.
Organizational Behavior and Human Decision Processes, 91(1), 82–96, https://doi.org/10.1016/S0749-5978(02)00525-3.
- [Noguchi et al., 2006]
-
Noguchi, K., Gohm, C. L., & Dalsky, D. J. (2006).
Cognitive tendencies of focusing on positive and negative
information.
Journal of Research in Personality, 40(6), 891–910,
https://doi.org/10.1016/j.jrp.2005.09.008.
- [PalanSchitter, 2018]
-
Palan, S. & Schitter, C. (2018).
Prolific.ac—A subject pool for online experiments.
Journal of Behavioral and Experimental Finance, 17,
22–27, https://doi.org/10.1016/j.jbef.2017.12.004.
- [Payne, 1976]
-
Payne, J. W. (1976).
Task complexity and contingent processing in decision making: An
information search and protocol analysis.
Organizational Behavior and Human Performance, 16(2),
366–387, https://doi.org/10.1016/0030-5073(76)90022-2.
- [Payne et al., 1988]
-
Payne, J. W., Bettman, J. R., & Johnson, E. J. (1988).
Adaptive strategy selection in decision making.
Journal of Experimental Psychology: Learning, Memory, and
Cognition, 14(3), 534–552,
https://doi.org/10.1037/0278-7393.14.3.534.
- [Payne et al., 1993]
-
Payne, J. W., Bettman, J. R., & Johnson, E. J. (1993).
The adaptive decision maker.
Cambridge: University Press.
- [Questback, 2016]
-
Questback (2016).
Unipark EFS Survey (Version 10.9).
- [R Core Team, 2019]
-
R Core Team (2019).
R: A Language and Environment for Statistical
Computing.
Vienna, Austria: R Foundation for Statistical Computing.
- [RieskampHoffrage, 2008]
-
Rieskamp, J. & Hoffrage, U. (2008).
Inferences under time pressure: How opportunity costs affect
strategy selection.
Acta Psychologica, 127(2), 258–276,
https://doi.org/10.1016/j.actpsy.2007.05.004.
- [Scharf et al., 2017]
-
Scharf, S., Wiegelmann, M., & Bröder, A. (2017).
Generalizability of the attraction search effect. (Preregistration.)
https://osf.io/j7vg4/.
- [Scharf et al., 2018]
-
Scharf, S., Wiegelmann, M., & Bröder, A. (2018).
Generalizability of the attraction search effect. (Preregistration).
https://osf.io/nfruq/.
- [SchkadeKleinmuntz, 1994]
-
Schkade, D. A. & Kleinmuntz, D. N. (1994).
Information displays and choice processes: Differential effects of
organization, form, and sequence.
Organizational Behavior and Human Decision Processes, 57(3), 319–337, https://doi.org/10.1006/obhd.1994.1018.
- [SchulzeNewell, 2016]
-
Schulze, C. & Newell, B. R. (2016).
Taking the easy way out? Increasing implementation effort reduces
probability maximizing under cognitive load.
Memory & Cognition, 44(5), 806–818,
https://doi.org/10.3758/s13421-016-0595-x.
- [Shevchenko, 2019]
-
Shevchenko, Y. (2019).
Multi-attribute task builder.
Journal of Open Source Software, 38(4), 1409,
https://doi.org/10.21105/joss.01409.
- [StarkMcClelland, 2000]
-
Stark, C. E. L. & McClelland, J. L. (2000).
Repetition priming of words, pseudowords, and nonwords.
Journal of Experimental Psychology: Learning, Memory, and
Cognition, 26(4), 945–972,
https://doi.org/10.1037/0278-7393.26.4.945.
- [Söllner et al., 2013]
-
Söllner, A., Bröder, A., & Hilbig, B. E. (2013).
Deliberation versus automaticity in decision making: Which
presentation format features facilitate automatic decision making?
Judgment and Decision Making, 8(3), 278–298.
- [WellsWindschitl, 1999]
-
Wells, G. L. & Windschitl, P. D. (1999).
Stimulus Sampling and Social Psychological Experimentation.
Personality and Social Psychology Bulletin, 25(9),
1115–1125, https://doi.org/10.1177/01461672992512005.
- [Wickham, 2016]
-
Wickham, H. (2016).
ggplot2: Elegant Graphics for Data Analysis.
New York: Springer-Verlag.
- [Wilson et al., 2000]
-
Wilson, T. D., Wheatley, T., Meyers, J. M., Gilbert, D. T., & Axsom, D.
(2000).
Focalism: A source of durability bias in affective forecasting.
Journal of Personality and Social Psychology, 78(5),
821–836, https://doi.org/10.1037/0022-3514.78.5.821.
Appendix A: Results for importance ratings in Experiment 1
These are the results of the cue ratings made by subjects in Experiment 1. Subjects had to answer the question "How important were these dimensions for you when deciding between (decision scenario)?".
Table A1: Mean importance ratings and respective standard deviations of scenarios’ cues in Experiment 1.
| City Size Scenario | Hair Salon Scenario |
| Cue | | MRating (SD) | | Cue | | MRating (SD) |
|
|
| State Capital | | 57.47 (32.66) | | Competency | | 85.16 (22.04) |
| International Airport | | 68.05 (29.81) | | Price | | 58.02 (26.02) |
| University | | 47.36 (28.24) | | Proximity to Home | | 37.59 (26.62) |
| Opera | | 36.99 (29.95) | | Scheduling Appointments | | 36.31 (26.68) |
|
| Hotel Scenario | Job Scenario |
| Cue | | MRating (SD) | | Cue | | MRating (SD) |
|
|
| Proximity to Beach | | 59.07 (29.51) | | Pay | | 72.41 (23.32) |
| Price | | 64.70 (24.84) | | Working Conditions | | 73.52 (27.33) |
| Proximity to City Center | | 37.67 (26.01) | | Colleagues | | 64.64 (28.43) |
| Cleanliness | | 76.33 (27.15) | | Proximity to Home | | 44.95 (27.35) |
|
| Pizza Service Scenario | Weather Forecast Scenario |
| Cue | | MRating (SD) | | Cue | | MRating (SD) |
|
|
| Quality | | 89.16 (18.21) | | German Weather Service | | 82.68 (24.89) |
| Price | | 55.12 (26.32) | | "ZDF" Weather Forecast | | 63.22 (30.12) |
| Timeliness | | 47.25 (28.04) | | "BILD" Weather Forecast | | 23.69 (24.09) |
| Friendliness | | 33.33 (27.04) | | Horoscope | | 5.17 (12.54) |
| Note. Ratings were made on a scale from 0 to 100; the displayed order of the cues in the tables represents the displayed order, and therefore the assumed ranking, of the cues in the experiment.
|
Appendix B: Results of mixed logistic regressions of all three experiments
Table B1. Variances and correlations of random effects in mixed logistic regressions for Experiment 1–3.
| | | | | | | Model 1 | Model 2 |
|
| Random Effects | Variance | | Correlation | | Variance | | Correlation |
|
| Experiment 1 | | | | | | | |
| | | Subject | | | | | | | |
| | | | | Intercept | | 0.04 | | | | 0.16 | | |
| | | | | Pattern Version | | 0.06 | | | | 0.18 | | |
| | | | | Intercept, Pattern Version | | | | −.42 | | | | −.35 |
| | | Decision Scenarios | | | | | | | |
| | | | | Intercept | | 0.07 | | | | 0.08 | | |
| | | | | Pattern Version | | 0.05 | | | | 0.07 | | |
| | | | | Intercept, Pattern Version | | | | .00 | | | | −.02 |
|
| Experiment 2 | | | | | | | |
| | | Subjects | | | | | | | |
| | | | | Intercept | | 3.12 | | | | 1.96 | | |
| | | | | Valence of First Search | | 0.60 | | | | 0.59 | | |
| | | | | Intercept, Valence of First Search | | | | 0.40 | | | | 0.26 |
| | | Decision Scenarios | | | | | | | |
| | | | | Intercept | | 0.01 | | | | 0.01 | | |
|
| Experiment 3 | | | | | | | |
| | | Subjects | | | | | | | |
| | | | | Intercept | | 0.11 | | | | 0.31 | | |
| | | | | Pattern Version | | 0.63 | | | | 1.11 | | |
| | | | | Intercept, Pattern Version | | | | 0.67 | | | | 0.71 |
| | | Shop Item | | | | | | | |
| | | | | Intercept | | 0.05 | | | | 0.07 | | |
| Note. Model 1 represents the mixed logistic regression with only one predictor: pattern version in Experiment 1 and 3 and the valence of the first searched-for cue value in Experiment 2. Model 2 includes the cue pattern predictor for Experiment 1 and 3 and the strategy count predictor for Experiment 2.
|
Table B2. Fixed effects estimates of mixed logistic regressions for Experiment 1–3.
| | | Model 1 | Model 2 |
| | Fixed Effects | B | SE | z | p | B | SE | z | p |
| Experiment 1 | | | | | | | | |
| | Intercept | -0.53 | 0.12 | -4.40 | < .001 | -0.64 | 0.14 | -4.67 | < .001 |
| | Version a | 0.75 | 0.11 | 6.77 | < .001 | 0.88 | 0.13 | 6.84 | < .001 |
| | Pattern 1 vs. Pattern 2 | | | | | -0.80 | 0.07 | -10.75 | < .001 |
| | Patterns 1 & 2 vs. Pattern 3 | | | | | 0.02 | 0.04 | 0.58 | .563 |
| | Version a * Pattern 1 vs. Pattern 2 | | | | | 0.16 | 0.07 | 2.14 | .032 |
| | Version a * Patterns 1 & 2 vs. Pattern 3 | | | | | 0.15 | 0.04 | 3.73 | < .001 |
|
| Experiment 2 | | | | | | | | |
| | Intercept | -2.29 | 0.15 | -15.42 | < .001 | -2.32 | 0.13 | -17.52 | < .001 |
| | Valence positive | 0.38 | 0.11 | 3.58 | < .001 | 0.38 | 0.11 | 3.63 | < .001 |
| | Strategy Count | | | | | -0.41 | 0.04 | -9.99 | < .001 |
| | Valence positive * Strategy Count | | | | | -0.09 | 0.03 | -2.71 | .007 |
|
| Experiment 3 | | | | | | | | |
| | Intercept | -0.72 | 0.09 | -8.09 | < .001 | -0.88 | 0.12 | -7.38 | < .001 |
| | Version a | 0.76 | 0.11 | 7.18 | < .001 | 0.91 | 0.14 | 6.60 | < .001 |
| | Pattern 1 vs. Pattern 2 | | | | | 1.36 | 0.11 | 12.96 | < .001 |
| | Patterns 1 & 2 vs. Pattern 3 | | | | | 0.18 | 0.05 | 3.81 | < .001 |
| | Version a * Pattern 1 vs. Pattern 2 | | | | | 0.17 | 0.10 | 1.64 | .100 |
| | Version a * Patterns 1 & 2 vs. Pattern 3 | | | | | -0.01 | 0.05 | -0.22 | .828 |
| Note. Predictors valence and version were both effect coded in all analyses, such that Version a/positive valence was coded with +1 and Version b/negative valence with −1. The predictor pattern in Experiment 1 and 3 was Helmert-coded, always comparing the cue pattern with the strongest effect in (Jekel et al., 2018) with the remaining cue patterns. Thus, Pattern 3 (+2) was compared to Patterns 1 and 2 (both −1) and Pattern 2 (+1) was compared with Pattern 1 (−1) in both experiments. The predictor strategy count was mean centered across subjects.
|
Appendix C: The effect of (mis-)match in importance ratings on the attraction search effect
We ran a generalized linear mixed model with the data from Experiment 1, including the individual (rank) correlations of the intended ordering of the cues and the ordering of the cues following subjects’ ratings for each scenario. Thus, a high, positive correlation represents very similar orderings, whereas a zero correlation represents no association of the intended and the rated cue ordering. Just as with the other mixed logistic regressions, the dependent variable was whether subjects searched for Option A in any given trial and the effect-coded predictor whether Option A was attractive in this trial (Version a; +1) or not (Version b; −1). To account for systematic variation in the data, we added random intercepts for subjects and content scenarios as well as a random slopes for version for both subjects and content scenarios. We additionally included the (as described above) Helmert-coded cue pattern predictor as well as the individual rank correlations in the model.
The effect of interest here is the interaction of version and rank correlation, β = 0.26, SE = 0.14, z = 1.91, p = .056. Although the interaction is not significant, the predicted probabilities for searching for Option A depict the expected pattern: The probability to search for Option A increases from 21.0% in trials with Version b to 42.3% in trials with Version a, when the correlation of subjective cue order and intended cue order is −1. When the subjective cue order and intended cue order are not correlated at all, the probability to search for Option A increases from 18.8% in trials with Version b to 52.1% in trials with Version a. Finally, when the cue orderings are perfectly (positively) correlated, the probability of searching for Option A in Version b is 16.9% and in Version a 61.8%. Thus, the effect of version on search behavior increases with an increasing correlation between the intended and the rated cue ordering. The remaining results from this analyses can be found in Tables C1 and C2. One thing to note is that compared to the analyses of Model 2 from Experiment 1 (see Tables C1 and C2), the variance of the Decision Scenarios random slope slightly increased when including the rank correlation predictor (from 0.07 in Model 2 of Experiment 1 to 0.08 in the Model with rank correlations as predictor). Thus, it is not entirely clear whether including the rank correlations actually explained variation in the effect of pattern version between Decision Scenarios.
Table C1. Variances and correlations of random effects in mixed logistic regressions for Experiment 1 including rank correlations.
| Random Effects | Variance | | Correlation |
|
| Subjects | | | |
| | | Intercept | | 0.16 | | |
| | | Pattern Version | | 0.15 | | −.23 |
| Scenarios | | | |
| | | Intercept | | 0.04 | | |
| | | Pattern Version | | 0.08 | | −.10 |
Table C2. Fixed effects estimates of mixed logistic regressions
for Experiment 1 including rank correlations.
| Fixed Effects | Estimate | SE | z | p |
| Intercept | -0.69 | 0.13 | -5.21 | < .001 |
| Version a | 0.77 | 0.15 | 5.05 | < .001 |
| Pattern 1 vs. Pattern 2 | -0.07 | 0.10 | -0.73 | .465 |
| Patterns 1 & 2 vs. Pattern 3 | 0.01 | 0.06 | 0.16 | .870 |
| Rank Correlations | 0.13 | 0.14 | 0.92 | .359 |
| Version a * Pattern 1 vs. Pattern 2 | 0.26 | 0.10 | 2.58 | .010 |
| Version a * Patterns 1 & 2 vs. Pattern 3 | 0.12 | 0.06 | 2.09 | .037 |
| Version a * Rank Correlation | 0.26 | 0.14 | 1.91 | .056 |
| Pattern 1 vs. Pattern 2 * Rank Correlation | -1.42 | 0.15 | -9.76 | < .001 |
| Patterns 1 & 2 vs. Pattern 3 * Rank Correlation | 0.02 | 0.08 | 0.28 | .783 |
| Version a * Pattern 1 vs. Pattern 2 * Rank Correlation | -0.20 | 0.15 | -1.40 | .162 |
| Version a * Patterns 1 & 2 vs. Pattern 3 * Rank Correlation | 0.01 | 0.08 | 0.18 | .860 |
| Note. Predictor version was effect coded, such that Version a was coded with +1 and Version b with −1. The predictor pattern was Helmert-coded, comparing the cue pattern with the strongest effect in (Jekel et al., 2018) with the remaining cue patterns. Thus, Pattern 3 (+2) was compared to Patterns 1 and 2 (both −1) and Pattern 2 (+1) was compared with Pattern 1 (−1) in both experiments.
|
This document was translated from LATEX by
HEVEA.