Judgment and Decision Making, Vol. 14, No. 2, March 2019, pp. 179-186
Cross-cultural support for a link between analytic thinking and disbelief in God: Evidence from India and the United Kingdom
Michael N. Stagnaro*
Robert M. Ross#
Gordon Pennycook$
David G. RandX
|
A substantial body of evidence suggests that favoring reason over
intuition (employing an analytic cognitive style) is associated with
reduced belief in God. In the current work, we address outstanding issues
in this literature with two studies examining the relationship between
analytic cognitive style (as measured by performance on the Cognitive
Reflection Test) and belief in God. First, prior research focused on
Judeo-Christian cultures, and it is uncertain whether the results
generalize to other religious systems or beliefs. Study 1 helps to
address this question by documenting a negative correlation between CRT
performance and belief in God, r = −.18, in a sample of 513
participants from India, a majority Hindu country. Second, among 150
participants from the United Kingdom, Gervais et al. (2018) reported the
first and (to date) only evidence for a positive relationship between CRT
and belief in God. In Study 2, we assess the robustness of this result by
recruiting 547 participants from the United Kingdom. Unlike Gervais et
al., using the same items, we find a negative correlation between CRT and
belief in God (r = −.19). Our results add further support to the
argument that analytic thinking undermines belief in God.
Keywords: analytic thinking, belief in God, Cognitive Reflection Test (CRT), cognitive style
1 Introduction
Religious identification is associated with a number of positive outcomes,
from improved mental and physical health (Carrico et al., 2006; Ironson et
al., 2006), to greater reported happiness (Ferriss, 2002), increased
prosocial behavior (Stagnaro et al., 2018) and even a longer life
(McCullough et al., 2000).1
Yet, despite these potential benefits, religious belief has been steadily
declining in recent years (Burkimsher, 2014). Scholars have increasingly
directed their attention to why some people believe in God while others do
not (Norenzayan & Gervais, 2013). Although several potential pathways to
religious disbelief have been identified (Mercier et al., 2018), one
pathway in particular has received much attention in the cognitive science
of religion – that of analytic cognitive style (Gervais & Norenzayan,
2012; Pennycook et al., 2012; Pennycook, Ross, et al., 2016; Shenhav et
al., 2012).
This line of work is rooted in dual-process theory, in which human
cognition is characterized by a distinction between processes that are
autonomous and relatively fast (“Type 1” processes), and relatively slower
processing that is deliberative and dependent on working memory (“Type 2”
processes) (De Neys, 2012; Evans & Stanovich, 2013; Kahneman, 2011;
Pennycook et al., 2015). According to dual-process theory, individuals
vary in the extent to which they utilize Type 1 versus Type 2 processing
(Stanovich & West, 2000, Stanovich, 2009) – that is, some people are more
disposed to engaging deliberative Type 2 processing. One name for this
individual difference is cognitive style; with those who engage in more
Type 2 processing referred to as having a more analytic cognitive style
(Pennycook et al., 2012).
Of the different measures of cognitive style, one of the most widely used
is the Cognitive Reflection Test (CRT; Frederick, 2005). This measure
involves a series of “trick questions” with intuitively compelling but
incorrect answers. With some reflection, these incorrect answers can be
identified and overridden by participants who engage in more analytic
thinking. Consider the following item:
A bat and ball cost $1.10 in total. The bat costs $1.00 more than the
ball. How much does the ball cost?
This problem elicits a fast, intuitive response (10 cents) that on
reflection can be identified as incorrect (if the ball costs 10 cents,
the bat would cost $1.10 and thus total $1.20). Despite this, the
incorrect intuitive response is typically the modal response
(e.g., 65% in a Canadian undergraduate population; Pennycook, Cheyne, et
al., 2016), indicating a common failure to engage in reflective
reasoning (Pennycook & Ross, 2016).
Evidence suggests that analytic cognitive style (as indexed by scores on
the CRT) increases the probability of critically evaluating evidence that
conflicts with previously held information (Pennycook et al., 2015). Some
theories (Shenhav et al., 2012) have used this reasoning to argue that
religious beliefs are particularly intuitive (Barrett, 2000; Kelemen,
2004) and, as such, would be accepted by most individuals save those who
are particularly prone to detect conflicting signals and thus override
initial beliefs. A different, but related theory (Pennycook, et al., 2012)
posits that there is likely nothing special about religious beliefs per
say – there is simply an asymmetry in belief and non-belief such that when
an individual is exposed to and attempts to comprehend some claim, they
must initially internalize it as true (Gilbert et al., 1993). Thus,
individual who tend to be more “intuitive” in their reasoning are more
inclined to simply internalize the initial belief as true (especially if
the source is of high status, and or centrally connected in one’s
community; Henrich & Gil-White, 2001). Those who are more inclined to
detect inconsistencies and, over time, reject, or reduce confidence, in
such claims should show a decrease in such belief.
Critically for this work, evidence supports the hypothesis that people with
a propensity to think analytically typically show lower levels of
religious belief (Bahçekapili & Yilmaz, 2017; Gervais & Norenzayan,
2012; Pennycook et al., 2012; Pennycook, Ross, et al., 2016; Saribay &
Yilmaz, 2017; Shenhav et al., 2012). A recent meta-analysis of 31 studies
(N = 15,078) found that a propensity to think analytically (measured the
number of correct responses on the CRT) is consistently and negatively
associated with religious belief (Pennycook, Ross, et al., 2016).
Furthermore, experimental work has provided mixed evidence that priming
analytic thinking can decrease belief in God (Gervais & Norenzayan, 2012;
Shenhav et al., 2012; Yilmaz et al., 2016), although some of the results
from Gervais and Norenzayan (2012) have not replicated (Camerer et al.,
2018; Sanchez et al., 2017).
Apart from the uncertainty of the experimental results, a clear shortcoming
of research on the relationship between belief in God and cognitive style
is that it has relied almost entirely on North American participants, a
common problem in psychological research (Henrich et al., 2010). Although
the negative relationship between CRT and belief in God has been replicated
in a majority Muslim sample in Turkey (Bahçekapili & Yilmaz, 2017), the
dearth of cross-cultural evidence, especially from
non-Abrahamic/monotheistic cultures, has been a notable concern for claims
that analytic thinking plays a role in the absence of belief.2
However, a recent cross-cultural study (N = 3,461) conducted
across 13 religiously and culturally diverse societies has provided some
evidence that the relationship between CRT and belief in God is in fact a
culturally broad phenomenon (Gervais et al., 2018). The authors argued, as
we do above, that the work supporting the claim for what they term
“analytic atheism” (Norenzayan & Gervais, 2013) has overwhelmingly come
from WEIRD populations (Henrich et al., 2010). Although Gervais, et al.
did find a significant negative overall relationship
between belief in God and CRT, this relationship interestingly appeared to
hold for mostly non-WEIRD samples,3 the magnitude (and confidence) of the effect varied
across countries. In particular, the negative correlation appeared to be
larger in countries that had strong religious traditions than in countries
that did not. Based on the cross-cultural variability in magnitude, the
authors argued that the negative relationship between CRT and belief in
God previously observed among Americans (a WEIRD sample) may be
cross-culturally “weak and fickle” (p. 5). Particularly troubling for the
negative relationship between CRT and belief in God were Gervais et al.’s
United Kingdom data (N = 150). This was the only country in which
a significant positive correlation between CRT score and belief
in God was found.
In the present work, we present two large sample studies which help address
two key questions: First, does the previously observed negative
relationship between performance on the CRT and belief in God maintain in
non-monotheistic, non-Abrahamic majority culture? Study 1 used participants
from India, a majority Hindu country.4 Second, in contexts where belief is not the
dominant cultural norm, is there the potential for a positive relationship
between CRT and belief in God? Study 2 use participants from the United
Kingdom, where Gervais et al. (2018) observed a positive relationship.
2 Study 1 — India
2.1 Methods
To assess the relationship between CRT and belief in God in a predominantly
non-monotheistic, non-Western population, we pooled data from two studies
that we had previously run on Amazon Mechanical Turk (AMT) that used Indian
participants, collected in 2012, when it was still easy for Indian residents
to open worker accounts on AMT, and thus a sizable number of AMT workers
were Indian. IP addresses were used to confirm their location to be in
India. Though not representative of the average Indian citizen (working on
AMT implies a level of English proficiency and technical access which may
not be broadly available), this convenience sample nonetheless allows us to
test the question of interest. We identified N = 513 Indian
individuals (185 female; mean age 28) for whom we had data on both belief
in God and the original 3-item CRT. Both studies were under 15 min long,
and all participants were compensated for their time in US
dollars.5
Performance on the CRT was comparable to previous samples, M =
1.36, SD = 1.06, Median = 2, Cronbach’s α =
.634. Further, there was reasonable variation in performance, with over
15% answering all items correctly and less than 30% missing all three.
Of those that gave no correct answers, 44% gave all three of the
intuitively incorrect answers and over 97% giving at least one intuitive
answer. The correlation between correct and intuitive answers was
r = −.815. Thus, there is good evidence these participants
understood and engaged with this measure as intended.
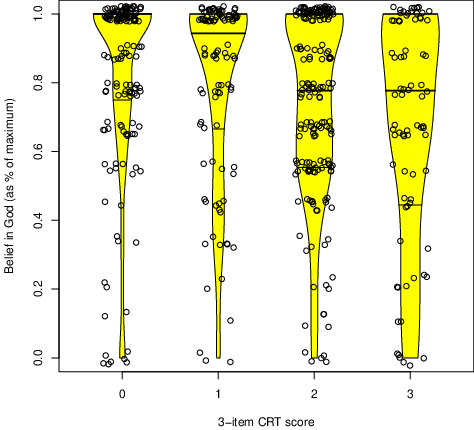
| Figure 1: Violin plots (with jittered individual data points) showing belief
in God (represented by POMP scores) as a function of correct responses on the 3-item CRT. Width of
each plot shows density. Horizontal lines show median (heavy line) and
25th and 75th percentile. |
Belief in God was measured with the question: “To what extent do
you believe in the existence of God (or gods)?”, responding on a scale
ranging from 1 (not at all) to 10 (very much). Belief
was high, M = 7.86, SD = 2.55, Median = 9, with
over 40% using the maximum value on the scale and less than 5% using the
minimum.
| Table 1: Multiple regression analyses (standardized coefficients)
predicting belief in God using the 3-item CRT and controlling for
study, age, gender (Male = 1, Female = 2), income, trust, and education
(dummy code). Standard errors are in parentheses. |
| | Model1 | Model2 | Model3 | Model4 |
| CRT3 | -0.178*** | -.185*** | -.171*** | -.167*** |
| | (.105) | (.105) | (.104) | (.105) |
| Study | | .067 | .063 | .072† |
| | | (.237) | (.232) | (.234) |
| Age | | | .191*** | .198*** |
| | | | (.014) | (.014) |
| Gender | | | .083† | .072† |
| | | | (.230) | (.232) |
| Income | | | | -.094* |
| | | | | (.064) |
| Trust | | | | .066 |
| | | | | (.102) |
| Intercept | 8.434*** | 8.226*** | 5.9*** | 4.96** |
| | (.180) | (.226) | (.525) | (1.801) |
| Edu dum | no | no | no | yes |
| N | 513 | 513 | 512 | 512 |
| R2 | .031 | .035 | .082 | .101 |
| Adj R2 | .029 | .032 | .075 | .081 |
| † p<0.1, * p<0.05, ** p<0.01, *** p<0.001.
|
2.2 Results and Discussion
Using linear regression, with correct CRT scores as the independent
variable predicting belief in God as the dependent variable, we found a
significant, negative relationship (β = −.176,
F(1, 511) = 16.30, p < .001, 95% CI [−.63,
−.22]6; all coefficients
represent standardized betas unless otherwise noted). See Figure 1. This
relationship became slightly stronger when including a dummy code for study
(β = −.185, F(2, 510) = 9.33, p
< .001, 95% CI [−.65, −.24]). Further, this relationship was
robust to the inclusion of “upstream” demographic variables (those
unaffected by belief in God: gender and age; β = −.171,
F(4, 507) = 11.33, p < .001, 95% CI [−.62,
−.21]), and potentially “downstream” demographic variables (those
potentially affected by belief in God: education, income, and self-reported
trust in others; β = −.167, F(11, 500) = 5.10,
p < .001, 95% CI [−.61, −.20]).7 In addition, using the number of intuitive responses,
rather than correct responses, as the independent variable yielded very
similar results (see the
supplement). Analyses are
summarized in Table 1.
Thus, in a sample that is substantially larger than the Indian sample
included in Gervais et al. (2018) (which had 224 Indian workers from AMT),
we replicate the previously observed negative relationship between CRT and
belief in God.
3 Study 2 — United Kingdom
We next turn to the surprising result reported by Gervais et al. (2018): of
the 13 countries they studied, only the United Kingdom showed moderate
evidence for a positive relationship between belief in God and CRT score.
Here we collected a much larger sample from the United Kingdom to see if
this result would replicate. The preregistered analysis protocol, survey
items, and data can be found at https://osf.io/jb2mr/.
3.1 Methods
We recruited participants using Prolific (https://prolific.ac/), an
online marketplace where people can sign up to participate in paid academic
studies (Irvine et al., 2018). Only participants with a UK-based IP address
were eligible to respond to the study advertisement. Sessions lasted
approximately 8 minutes and participants were compensated in pounds for
their time. We preregistered an intention to request 550 participants from
Prolific and to remove participants who a) reported their age as less than
18, or b) had a repeat IP address, suggesting that they may have previously
completed the study. 548 participants completed the study and collected
compensation. One participant was removed for reporting their age as 17,
meaning that 547 participants (348 female; mean age 36) were retained for
analysis.
Analytic cognitive style was measured using the original 3-item CRT
(Frederick, 2005) and a more recent 4-item CRT which was designed to rely
less on numeracy (Thomson & Oppenheimer, 2016).8
These were combined into a single, 7-item CRT. Scores on the 3-item CRT
were comparable to earlier studies, with 36.2% receiving a score of zero,
21.9% receiving a score of three, and a mean of 1.28 (SD =
1.17). The 7-item scale had a more normal distribution, with only 8%
scoring zero, 10.24% scoring a full seven, a mean of 3.66 (SD =
2.13, Cronbach’s α = .772). Belief in God (or gods) was measured
used a single item measure anchored from 0 to 100.9 Given the potential problem of
relying on a single item measure, we also included a broader index of
religious belief: Namely, the 6-item Supernatural Belief Scale (Jong et
al., 2013; Jong & Halberstadt, 2016) which asks participants about their
beliefs in religious supernatural concepts and has good psychometric
properties.10
We found that this scale had high reliability (Cronbach’s α =
.956). We also collected demographic variables: age, gender, education,
ethnicity, income, political ideology (social and fiscal) and a measure of
attention (an instructional manipulation check; Oppenheimer et al.,
2009). Finally, we collected some additional variables for exploratory
analysis that are not reported here.
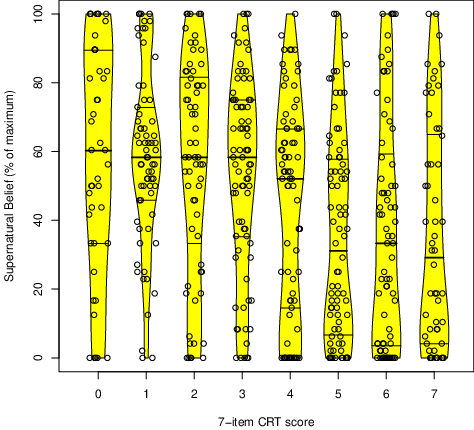
| Figure 2: Violin plots (with jittered individual data points) showing
supernatural belief (represented by POMP scores) as a function of
correct responses on the 7-item CRT. |
3.2 Results and Discussion
To test our primary hypothesis, we used linear regression to examine
whether performance on the 7-item CRT predicts supernatural belief using
the 6-item Supernatural Belief Scale. Secondarily, we used linear
regression to examine whether performance on the 3-item CRT predicts
belief in God using the single-item belief in God measure. This secondary
analysis was performed to directly replicate Gervais et al.’s (2018)
analysis.
As shown in Figure 2, we found a significant negative relationship
between the number of correct responses on the 7-item CRT and Supernatural
Belief Scale score (β = −.291, F(1, 545) =
50.43, p < .001, 95% CI [−2.67, −1.52]).11 We also found a significant
negative relationship between the number of correct responses on
the 3-item CRT and the single-item belief in God measure, β
= −.189, F(1, 545) = 20.15, p < .001, 95% CI
[−8.38, −3.28], Figure 3.12
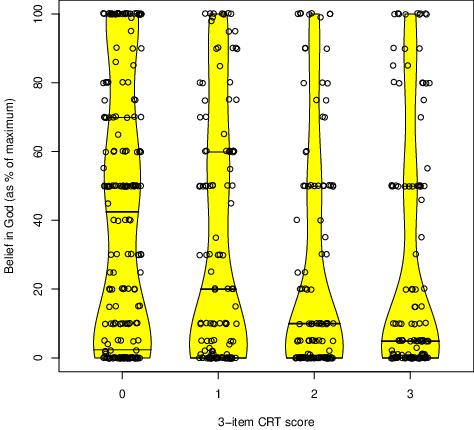
| Figure 3: Violin plots (with jittered individual data points) showing
belief in God (represented by POMP scores) as a function of number of
correct responses on the 3-item CRT. |
| Table 2: Multiple regression analyses (standardized) predicting a) belief
in God using the 3-item CRT and b) supernatural belief using the 7-item
CRT while controlling for age, gender (Male = 1, Female = 2), income,
social conservatism, fiscal conservatism, performance in an
attention check, ethnicity (dummy coded), and education (dummy coded).
Standard errors are in parentheses. |
| | CRT3 predicting belief in God | CRT7 predicting Sup Nat belief |
| | M1 | M2 | M3 | M1 | M2 | M3 |
| CRT | -.189*** | -.166*** | -.152*** | -.291*** | -.231*** | -.197*** |
| | (1.3) | (1.28) | (1.31) | (.295) | (.291) | (.298) |
| Age | | .160*** | .160*** | | .127** | .116** |
| | | (.118) | (.121) | | (.049) | (.05) |
| Gender | | .01 | .020 | | .157*** | .177*** |
| | | (3.11) | (3.11) | | (1.28) | (1.283) |
| Income | | | -.069 | | | -.042 |
| | | | (.844) | | | (.348) |
| Social con | | | .153* | | | .114† |
| | | | (2.18) | | | (.90) |
| Fisc con | | | .031 | | | .053 |
| | | | (2.203) | | | (.907) |
| attention ck | | .046 | | | .049 |
| | | | (7.172) | | | (2.970) |
| Intercept | 40.990*** | 17.780* | 20.110 | 35.975*** | 19.064*** | 16.000* |
| | (2.25) | (6.95) | (15.40) | (1.25) | (6.17) | (6.44) |
| Ethnic dum | no | yes | yes | no | yes | yes |
| Edu dum | no | no | yes | no | no | yes |
| N | 547 | 547 | 547 | 547 | 547 | 547 |
| R2 | .036 | .151 | .191 | .085 | .198 | .237 |
| Adj R2 | .034 | .130 | .158 | .083 | .179 | .205 |
| * p<0.05, ** p<0.01, *** p<0.001. |
To test the robustness of our analyses, we also conducted a number of post
hoc analyses. Again, we found a significant negative relationship when
controlling for demographics “upstream” of belief (age, gender and
ethnicity dummies), using both the 7-item CRT and Supernatural Belief
Scale score (β = −.231, F(13, 533) = 10.15,
p < .001, 95% CIs [−2.23, −1.09]) and the 3-item CRT
and single-item belief in God measure (β = −.166,
F(13, 533) = 7.28, p < .001, 95% CI [−7.63,
−2.60]). Further, this relationship maintains when we added demographics
that are potentially “downstream” of belief (education dummies, income,
political ideology [social and fiscal], and failed comprehension), for
both the 7-item CRT and Supernatural Belief Scale score (β
= −.197, F(22, 524) = 7.40, p < .001, 95% CI
[−2.01, −.83]), and the 3-item CRT and the single-item belief in God
measure (β = −.152, F(22, 524) = 5.64, p
< .001, 95% CI [−7.28, −2.12]). Analyses are summarized in Table
2.
4 General Discussion
In the present paper, we examined the relationship between analytic
cognitive style and belief in God (or gods) in India and the United
Kingdom. First, consistent with Gervais et al. (2018), we found a negative
relationship between CRT and religious belief in our Indian sample. This
further strengthens the evidence that this relationship between belief and
analytic thinking does not occur only in WEIRD populations, but can also
occur in non-Western cultures in which the majority follow a non-monotheist
religion.13
Second, in contrast to the results reported by Gervais et al. (2018), we
found a negative relationship between CRT and belief in God in our UK
sample. In fact, the magnitude of the negative association we observed was
very similar to that found in a recent meta-analysis of 31 studies,
r = −.183 (Pennycook, Ross, et al., 2016). It is not clear why
our results differ markedly from Gervais et al. (2018). However, our
sample was recruited online, while Gervais et al. employed a college
sample. It is possible that students at British universities show the
opposite association to that of a more demographically diverse sample of
the British population. This possibility would have to apply to British
universities in particular, since studies using North American college
samples have found a negative relationship (Gervais & Norenzayan, 2012;
Pennycook, Ross, et al., 2016; Shenhav et al., 2012). Another possibility
is sample size; our sample was substantially larger (N = 548 vs
N = 150). Thus, it could be the case that Gervais et al.’s result
was spurious (i.e., a type 1 error).
Gervais et al. (2018) observe that in their study the countries where the
negative relationship between CRT scores and belief was weakest were also
the countries where religious belief is less prominent. They suggest that
cognitive reflection may be involved in the challenging of cultural norms
– irrespective of their theological frame. Thus, if belief was the
minority view, utilizing reflection could make individuals more likely to
challenge this view and adopt or experiment with religious belief. The
British data from the present study, however, are not consistent with this
interpretation. Britain has particularly low levels of religious belief
(59% in this sample which is representative of current trends; Evans &
Baronavski, 2018), yet we found a negative association between CRT and
religious belief. Still, the level of religious belief in British
universities might be particularly low.
A more general explanation for this pattern could be that, in populations
of low belief, there is simply less of a signal being sent between
reflection and non-belief. Since many individuals relying on intuition
would normally adopt a religious world view as a sort of default belief in
religious societies, here, it is not a common or easily accessible
worldview and thus we should not expect individuals to be defaulting to
belief. Thus this lower overall level of belief makes detecting
relationships much harder (due to the constrained variance).
Our results from the British sample also support a (perhaps obvious)
speculation about methodology made by Pennycook, Ross, et al. (2016): The
effect size of the correlation between religious disbelief and analytic
thinking depends on the measures that are used. Gervais et al. (2018)
referred to the association as “weak”, but they used a 3-item measure of
analytic thinking and a single-item measure of belief in God. Using these
same measures, we found a correlation r = −.19 in our UK sample.
However, using a 7-item CRT measure and a 6-item religious belief measure,
this correlation increased to r = −.29. Gignac and Szodorai
(2016) found that correlations of r = .11, .19, and .29 represent
the 25th, 50th, and
75th percentiles (respectively) for effect sizes in
individual differences research in social psychology. Thus, the effect
size for the correlation between analytic thinking and religious beliefs
appears to be medium using extremely short measures and relatively large
when using longer (but nonetheless fairly short) measures (see also
Pennycook, Ross, et al., 2016).
In conclusion, recent work has raised questions about the robustness
and function of analytic processing in the context of belief in God
(Camerer et al., 2018; Gervais et al., 2018; Sanchez et al., 2017). Here,
we report results that further reinforce the evidence for a negative
relationship between religious belief and analytic thinking in a
non-Abrahamic, non-monotheistic, and non-Western population — in this
case, India. Furthermore, we have also shown that the negative
relationship maintains even in a population where religious belief is much
weaker — in this case, the United Kingdom. This suggests that analytic
thinking is not motivating people to merely challenge whatever the default
norm happens to be (be it belief or non-belief), but is rather motivating
people to specifically question religious belief. Although there appears
to be cross-cultural variability in the association between analytic
thinking and religious disbelief (Gervais et al., 2018), the causes of
this variability are still unknown.
References
Bahçekapili, H. G., & Yilmaz, O. (2017). The relation between different
types of religiosity and analytic cognitive style. Personality and
Individual Differences, 117, 267–272.
http://dx.doi.org/10.1016/j.paid.2017.06.013.
Barrett, J. L. (2000). Exploring the natural foundations of religion.
Trends in Cognitive Sciences, 4(1), 29–34.
https://doi.org/10.1016/s1364-6613(99)01419-9.
Burkimsher, M. (2014). Is religious attendance bottoming out? An
examination of current trends across Europe. Journal for the
Scientific Study of Religion, 53(2), 432–445.
https://doi.org/10.1111/jssr.12111.
Camerer, C. F., Dreber, A., Holzmeister, F., Ho, T.-H., Huber, J.,
Johannesson, M., . . . Pfeiffer, T. (2018). Evaluating the replicability
of social science experiments in Nature and Science between 2010 and 2015.
Nature Human Behaviour, 2(9), 637–644.
https://doi.org/10.1038/s41562-018-0399-z.
Carrico, A. W., Ironson, G., Antoni, M. H., Lechner, S. C., Durán, R. E.,
Kumar, M., & Schneiderman, N. (2006). A path model of the effects of
spirituality on depressive symptoms and 24-hurinary-free cortisol in
HIV-positive persons. Journal of Psychosomatic Research, 61(1),
51-58. https://doi.org/10.1016/j.jpsychores.2006.04.005.
De Neys, W. (2012). Bias and conflict: A case for logical intuitions.
Perspectives on Psychological Science, 7(1), 28–38.
https://doi.org/10.1177/1745691611429354.
Draper, J. W. (1875). History of the Conflict between Religion and
Science (Vol. 13). New York, NY: D. Appleton & Company.
Evans, J. & Baronavski, C. (2018). How do European countries differ in
religious commitment? Use our interactive map to find out. Retrieved from
http://www.pewresearch.org/fact-tank/2018/12/05/how-do-european-countries-differ-in-religious-commitment/.
Evans, J. S. B., & Stanovich, K. E. (2013). Dual-process theories of
higher cognition advancing the debate. Perspectives on
Psychological Science, 8(3), 223–241.
https://doi.org/10.1177/1745691612460685.
Ferriss, A. L. (2002). Religion and the quality of life. Journal of
Happiness Studies, 3(3), 199–215.
Frederick, S. (2005). Cognitive reflection and decision making.
Journal of Economic Perspectives, 19(4), 25–42.
https://doi.org/10.1257/089533005775196732.
Gervais, W. M., & Norenzayan, A. (2012). Analytic thinking promotes
religious disbelief. Science, 336(6080), 493–496.
https://doi.org/10.1126/science.1215647.
Gervais, W. M., van Elk, M., Xygalatas, D., McKay, R. T., Aveyard, M.,
Buchtel, E. E., . . . Riekki, T. (2018). Analytic atheism: A
cross-culturally weak and fickle phenomenon? Judgment and Decision
Making, 13(3), 268–274. https://doi.org/10.31234/osf.io/92r8x.
Gilbert, D. T., Tafarodi, R. W., & Malone, P. S. (1993). You can’t not
believe everything you read. Journal of Personality and Social
Psychology, 65(2), 221–233.
https://doi.org/10.1037/0022-3514.65.2.221.
Gignac, G. E., & Szodorai, E. T. (2016). Effect size guidelines for
individual differences researchers. Personality and Individual
Differences, 102, 74–78. https://doi.org/10.1016/j.paid.2016.06.069.
Groth, S. W., Dozier, A., Demment, M., Li, D., Fernandez, I. D., Chang, J.,
& Dye, T. (2016). Participation in genetic research: Amazon’s Mechanical
Turk workforce in the United States and India. Public Health
Genomics, 19(6), 325–335. https://doi.org/10.1159/000452094.
Henrich, J., & Gil-White, F. J. (2001). The evolution of prestige: Freely
conferred deference as a mechanism for enhancing the benefits of cultural
transmission. Evolution and Human Behavior, 22(3), 165–196.
https://doi.org/10.1016/s1090-5138(00)00071-4.
Henrich, J., Heine, S. J., & Norenzayan, A. (2010). The weirdest people in
the world? Behavioral and Brain Sciences, 33(2-3), 61–83.
https://doi.org/10.2139/ssrn.1601785.
Indian Census Commissioner. (2001). Religion. Retrieved from
http://censusindia.gov.in/Census\_And\_You/religion.aspx.
Ironson, G., Stuetzle, R., & Fletcher, M. A. (2006). An increase in
religiousness/spirituality occurs after HIV diagnosis and predicts slower
disease progression over 4 years in people with HIV. Journal of
General Internal Medicine, 21(5), S62-S68.
https://doi.org/10.1111/j.1525-1497.2006.00648.x.
Irvine, K., Hoffman, D. A., & Wilkinson-Ryan, T. (2018). Law and
psychology grows up, goes online, and replicates. Journal of
Empirical Legal Studies, 15(2), 320–355.
https://doi.org/10.1111/jels.12180.
Jong, J., Bluemke, M., & Halberstadt, J. (2013). Fear of death and
supernatural beliefs: Developing a new supernatural belief scale to test
the relationship. European Journal of Personality, 27, 495–506.
https://doi.org/10.1002/per.1898.
Jong, J., & Halberstadt, J. (2016). Death anxiety and religious
belief: An existential psychology of religion. London, UK: Bloomsbury
Publishing.
Kahneman, D. (2011). Thinking, fast and slow. New York, NY:
Farrar, Straus and Giroux.
Kelemen, D. (2004). Are children “intuitive theists”? Reasoning about
purpose and design in nature. Psychological Science, 15(5),
295-301. https://doi.org/10.1111/j.0956-7976.2004.00672.x.
McCullough, M. E., Hoyt, W. T., Larson, D. B., Koenig, H. G., & Thoresen,
C. (2000). Religious involvement and mortality: A meta-analytic review.
Health Psychology, 19(3), 211–222.
https://doi.org/10.1037/0278-6133.19.3.211.
Mercier, B., Kramer, S. R., & Shariff, A. F. (2018). Belief in god: Why
people believe, and why they don’t. Current Directions in
Psychological Science, 27(4), 263–268.
https://doi.org/10.1177/0963721418754491.
Norenzayan, A., & Gervais, W. M. (2013). The origins of religious
disbelief. Trends in Cognitive Sciences, 17(1), 20–25.
https://doi.org/10.1016/j.tics.2012.11.006.
Oppenheimer, D. M., Meyvis, T. & Davidenko, N. (2009). Instructional
manipulation checks: Detecting satisficing to increase statistical power.
Journal of Experimental Social Psychology, 45(4), 867–872.
https://doi.org/10.1016/j.jesp.2009.03.009.
Pennycook, G., Cheyne, J. A., Koehler, D. J., & Fugelsang, J. A. (2016).
Is the cognitive reflection test a measure of both reflection and
intuition? Behavior Research Methods, 48(1), 341–348.
https://doi.org/10.3758/s13428-015-0576-1.
Pennycook, G., Cheyne, J. A., Seli, P., Koehler, D. J., & Fugelsang, J. A.
(2012). Analytic cognitive style predicts religious and paranormal belief.
Cognition, 123(3), 335–346.
https://doi.org/10.1016/j.cognition.2012.03.003.
Pennycook, G., Fugelsang, J. A., & Koehler, D. J. (2015). Everyday
consequences of analytic thinking. Current Directions in
Psychological Science, 24(6), 425–432.
https://doi.org/10.2139/ssrn.2644392.
Pennycook, G., & Ross, R. M. (2016). Commentary: Cognitive reflection
vs. calculation in decision making. Frontiers in Psychology, 7,
9. https://doi.org/10.3389/fpsyg.2016.00009.
Pennycook, G., Ross, R. M., Koehler, D. J., & Fugelsang, J. A. (2016).
Atheists and agnostics are more reflective than religious believers: Four
empirical studies and a meta-analysis. PLoS ONE, 11(4), e0153039.
https://doi.org/10.1371/journal.pone.0153039.
Sanchez, C., Sundermeier, B., Gray, K., & Calin-Jageman, R. J. (2017).
Direct replication of Gervais & Norenzayan (2012): No evidence that
analytic thinking decreases religious belief. PLoS ONE, 12(2),
e0172636. https://doi.org/10.1371/journal.pone.0172636.
Saribay, S. A., & Yilmaz, O. (2017). Analytic cognitive style and
cognitive ability differentially predict religiosity and social
conservatism. Personality and Individual Differences, 114, 24–29.
http://dx.doi.org/10.1016/j.paid.2017.03.056.
Shenhav, A., Rand, D. G., & Greene, J. D. (2012). Divine intuition:
Cognitive style influences belief in God. Journal of Experimental
Psychology: General, 141(3), 423–428.
https://doi.org/10.1037/e519702015-023.
Sloan, R. P. (2006). Blind faith: The unholy alliance of religion
and medicine. New York, NY: St. Martin’s Press.
Stanovich, K. E., & West, R. F. (2000). Individual differences in
reasoning: Implications for the rationality debate?. Behavioral
and Brain Sciences, 23(5), 645–665.
https://doi.org/10.1017/s0140525x00003435.
Stanovich, K. E. (2009). Distinguishing the reflective, algorithmic, and
autonomous minds: Is it time for a tri-process theory? In Evans, E. &
Frankish, K. (Eds.), In two minds: Dual processes and beyond (pp.
55-88) Oxford, UK: Oxford University Press.
https://doi.org/10.1093/acprof:oso/9780199230167.003.0003.
Stagnaro, M., Arechar, A., & Rand, D. G. Are those who believe in God
really more prosocial? (April 15, 2018). Available at SSRN:
https://ssrn.com/abstract=3160453 or
http://dx.doi.org/10.2139/ssrn.3160453.
Thomson, K. S., & Oppenheimer, D. M. (2016). Investigating an alternative
form of the Cognitive Reflection Test. Judgment and Decision
Making, 11(1), 99–113.
Yilmaz, O., Karadöller, D. Z., & Sofuoglu, G. (2016). Analytic thinking,
religion, and prejudice: An experimental test of the dual-process model of
mind. The International Journal for the Psychology of Religion,
26(4), 360–369. https://doi.org/10.1080/10508619.2016.1151117.
This document was translated from LATEX by
HEVEA.