Judgment and Decision Making, Vol. 14, No. 3, May 2019, pp. 280-287
Terrorism, dread risk and bicycle accidents
Peter Ayton*
Samantha Murray#
James A. Hampton#
|
Following the airplane attacks of September 11th, 2001 it is claimed that
many Americans, dreading a repeat of these events, drove instead of
flying, and that, consequently, there were extra car accidents,
increasing the number of fatalities directly caused by the attacks by
1,500. After the Madrid train bombings of March 11th, 2004, Spaniards,
like Americans, avoided the attacked mode of travel, but no increase in
car travel or fatal accidents resulted. Here we analyze behavioral
concomitants of the July 7th 2005 bomb attacks on public transport in
London. We find reduced underground train travel and an increase in rates
of bicycling and, over the 6 months following the attacks, 214 additional
bicyclist road casualties — a 15.4% increase. Nevertheless we found no
detectable increase in car accidents. We conclude that, while fear caused
by terrorism may initiate potentially dangerous behaviors, understanding
the secondary effects of terrorism requires consideration of the
environmental variables that enable fear to manifest in dangerous
behaviors.
Keywords: public transport, decision making, risk perception, road accidents
1 Introduction
Gigerenzer (2004, 2006) published evidence that the attacks in the USA on
September 11th 2001 caused substantially greater loss of
life than had been noticed via a secondary psychological dread
risk effect. People dread, and are especially averse to, situations
where many may be harmed or killed at one point in time, compared to
situations in which a similar or even greater number may be harmed or
killed, but distributed over a longer period (Slovic, 1987). Gigerenzer,
observing a decrease in air travel in the wake of the attacks and a
simultaneous increase in road traffic, claimed that some people, seeking to
avoid a dread risk, switched from flying to driving. Calamitously, because
driving is more dangerous than flying (Myers, 2001), the switch resulted in
more fatalities than would have occurred if people had continued with their
previous pattern of travel. Gigerenzer (2004) estimated the increase in
road deaths in the three months following September 11th
2001 was 353 — exceeding the total number of passengers killed on the four
hijacked airplanes; subsequently Gigerenzer (2006) reported an increase of
1,595 in traffic fatalities over the twelve months following the attacks
and attributed this increase to a dread risk effect.
Gigerenzer’s (2004 & 2006) analyses compared the number of road fatalities
for the months following the attacks with the numbers for the five
preceding years, but did not report any tests of statistical significance.
Evidence that travel by road increased was limited to comparison with the
figures for the period eight months before and twelve months after the
attacks – but again no tests of statistical significance were reported.
Motivated in part by the lack of tests of statistical significance in
Gigerenzer’s analyses, Su, Tran, Wirtz, Langteau & Rothman (2009)
conducted more rigorous statistical analyses of the data.
Consistent with Gigerenzer’s (2004) descriptive findings, one-way ANOVAs
revealed that while the number of pre-September passenger flying miles did
not vary by year, the number of U.S. domestic passenger flying miles in
the post-September months was significantly lower in 2001 than in 1999 and
2000. However Su et al. found no evidence to support the second element of
the dread risk effect — a significant increase in miles driven or of a
significant increase in traffic fatalities after September 11th.
Gigerenzer (2004) reported a 2.9% increase in total U.S. driving miles in
the post-September months of 2001, compared with the post-September months
of 2000, and contrasted this increase with the 0.9% increase in total
driving miles during the pre-September months of 2001, compared with the
same months in 2000. However, Su et al. noted the presence of historical
trends in U.S. driving such that, from 1970 through 2004, for a given
month relative to that same month in the previous year, driving miles
increase on average by 2.91%; hence the 2.9% increase in total driving
miles between October and December of 2001 reported by Gigerenzer (2004)
was quite close to expectations. Moreover, as total U.S. driving miles in
the post-September months of 2001 did not differ significantly from total
U.S. driving miles in the same months in 1999 and 2000, Su et al. rejected
Gigerenzer’s claim that there was a notable increase in driving miles in
the United States after the September 11 attacks. Consequently any change
in the number of driving fatalities could not be attributed to the dread
risk effect – that is a switch from flying to driving.
Su et al.’s statistical analyses also revealed that while the number of
fatal traffic accidents in the United States was somewhat elevated during
the last 3 months of 2001, there was no significant overall increase in
traffic fatalities. Su, et al. also reported statistical analyses to test
for a regional increase in traffic fatalities in the post-September months
of 2001; citing survey evidence that proximity to the attacks was
associated with a greater stress reaction (Schlenger et al., 2002) they
hypothesized that stress induced by geographic proximity to the attacks
would decrease driving quality.
Su et al.’s analyses divided the United States into three geographic
regions and, consistent with their hypothesis, found that traffic
fatalities increased in the post-September months of 2001 but only in the
north-eastern portion of the United States – the region where the attacks
occurred. As there was no corresponding significant increase in the
amount of driving in the Northeast during that period, and also as the
number of alcohol- or drug-related traffic citations increased during the
last 3 months of 2001, again only in the Northeast of the USA, Su et al.
argued for a different causal account of the increased traffic fatalities:
the traumatic effect of the attacks increased psychological stress, which
in turn impaired driving ability and predisposed individuals to fatal
traffic accidents.
Critically for the dread risk hypothesis this interpretation places the
locus of the behavioral consequences of the USA attacks on involuntary
stress rather than on volitional choice. Although Su et al.’s account of
the increased fatalities attributes them to dangerous behaviors induced by
fear, it does not imply any misguided attempt to avoid risk through
voluntary decisions – specifically a switch in mode of travel. This
matters because, while interventions to reduce these effects would of
course be just as important, different sorts of intervention may be
appropriate to counter stress rather than dread risk.
Gaissmaier and Gigerenzer (2012) responded to Su et al.’s (2009) paper by
conducting a more fine-grained analysis of driving data. Analysing data
across each of the 50 states plus Washington, D.C., for the years 1996 to
2001 they found that the average monthly increase in miles driven per
inhabitant in the post-September months of 2001 (27.2 miles) was
substantially (and significantly) larger than the average increase
observed in the previous 5 years in those same months (9.9 miles); while
for the pre-September months, the average monthly changes in miles driven
in 2001 was non-significantly lower than the average monthly changes in
the 5 previous years. Moreover while increased driving was weakly
associated with proximity to New York City, where stress reactions to the
attacks were previously shown to be greatest (Schuster et al., 2001), it
was much more strongly associated with driving opportunity,
operationalized either as number of highway miles per inhabitant or as
number of car registrations per inhabitant. Increased driving, in turn,
was the best predictor of increased fatalities; Gaissmaier and
Gigerenzer’s analysis of state-by-state variations in changes in
fatalities after the attacks showed that fatalities increased with changes
in miles driven, but not with proximity to New York City. Although traffic
fatalities increased in the Northeast, substantial increases also occurred
in many states more distant from New York City, which, by virtue of their
number of highway miles per inhabitant and/or number of car registrations
per inhabitant, afforded greater opportunity for increased
driving.1 Thus, Gaissmaier and Gigerenzer (2012) claimed a
secondary impact of the terrorist attacks — which increased fatalities -
was attributable to both varying fear of dread risks and variance in the
environmental conditions conducive to increased driving instead of flying.
López-Rousseau (2005) investigated whether any similar effect occurred
following the March 11th 2004 bomb attacks on four trains in Spain which
killed 191 people and injured 1,755. The effect was smaller and shorter
than the American reaction following September 11th
2001; train travel reduced for just two months following the bombing.
However, there was no corresponding increase in road traffic; in fact,
there was a decrease. Accordingly traffic fatalities also decreased and no
secondary dread risk effect was observed.
Why were reactions to the attacks on the civilian populations of the two
countries different? One suggestion is the socio-political differences
between the countries: López-Rousseau points out that, unlike the USA,
Spain had been exposed to decades of bomb attacks on public targets so one
attack may produce a smaller alarm reaction and less of a dread risk. A
possible reason why any — albeit reduced — reaction did not result in
secondary deaths is that Spain has less of a car culture than the USA;
Spaniards may not be so willing or able to transfer from train to car when
cars are less available and public transport is more available.
In light of these observations we conducted an analysis of the effects
of the 2005 bomb attacks in London. On July 7th 2005, 52
people were killed and 700 were injured in four separate explosions caused
by bomb attacks on public transportation in London. Bombs exploded on
three underground trains and on one bus. We focused our analysis of
secondary effects on London – the location of the bomb attacks.
Prompted by press reports of large increases in bicycle sales immediately
following the London attacks which suggest that some switching from public
transport to bicycles may have occurred (Muir, 2005) we examined
variations in bicycle travel and bicycle accidents.
People switching from underground trains to bicycles could cause a
secondary effect: just as car travel is riskier than plane travel (Myers,
2001), bicycling is more dangerous than traveling by underground train.
Between 1997–2006 an annual average of 16 fatalities and 3,452 injuries
were recorded for London cyclists. Despite far more traveling by
underground than bicycle (1.1 million underground passengers and 18,000
bicyclists travel daily into central London), between 2000–2004 there was
an annual average of six fatalities and 119 injuries on the underground.
However note that most underground fatalities are attributable to suicides
or follow deliberate trespass on the line (Transport for London, 2007).
Only five underground train accidents causing passenger deaths have
occurred since it opened in 1863. Litman (2005) reports that, for London
in 2004, the number of deaths per billion trips was Underground (9.44);
Bus (4.89) and Bicycle (152.7).
We also analyzed London car accident data but couldn’t detect any increase
in car accidents following the London attacks. Like Spain, the UK has
less of a car culture than the USA — particularly in London. Of those
working in central London, 80% travel to work by public transport (bus,
rail or underground); only 11% travel by car — compared with 76% in the
rest of Great Britain (Transport for London, 2007). For many Londoners
driving is not feasible: cars were charged (£8 — US$14 — at the time of
the attacks) — for entering central London during weekdays and parking is
scarce and costly. Nonetheless bicycling may be one option for some
public transport users.
2 Method And Results
To test for a secondary effect we analyzed four data sets: recorded London
underground passenger journeys, a London bicycle survey, London car
accident casualties and London pedal-cyclist casualties. The underground
passenger data and bicycle survey were supplied to the authors on request
by Transport for London – the organization responsible for public transport
in London. The road casualties datasets, compiled from reports made by
police attending accidents, are available from the UK government website
(https://data.gov.uk/).
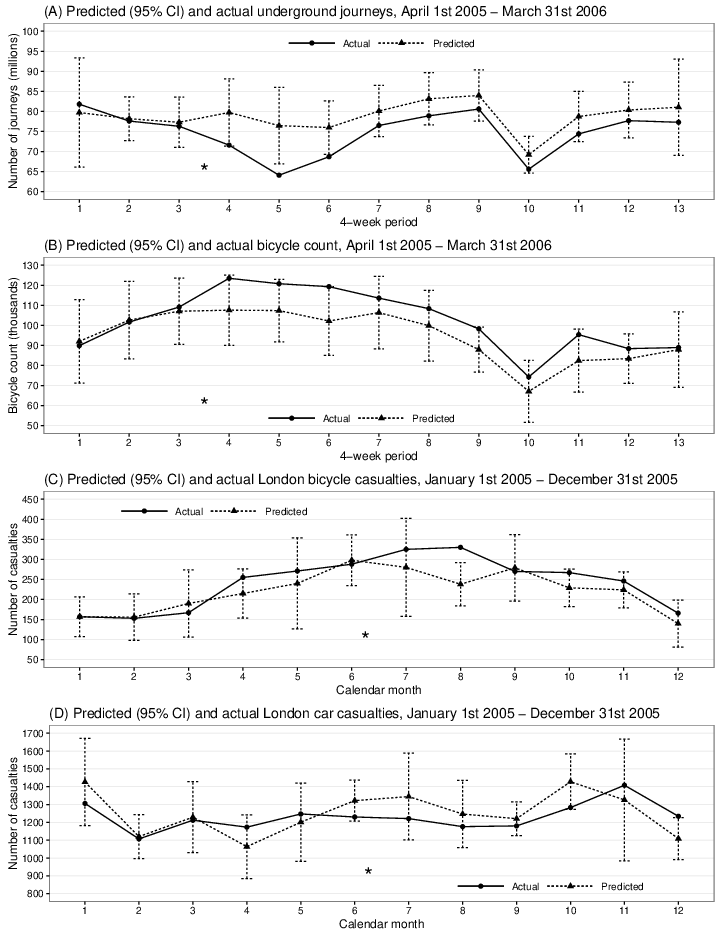
| Figure 1: Predicted and observed numbers of underground train travelers,
cyclists, bicycle accident casualties and car accident casualties in
London. The predicted points for each period (month or 4-week period) are
based on separate linear regression models – one for each period -
regressing the time series of historic annual data onto numerical year to
infer the slope and intercept in the historic data so as to extrapolate a
prediction for the predicted year. * marks the temporal location of July
7th 2005. |
Recorded underground passenger journeys were listed for each of 13
four-week periods for 11 years (starting April 1st,
ending March 31st) for the years 1995–1996 to 2005–6. We computed thirteen
regression models – one for each of the 13 four-week periods – regressing
passenger count onto numerical year using data for the 10 years prior to
the attacks (1995–1996 to 2004–5). Each model fitted well (mean
R2 = 0.75) to the historical counts of underground
passengers. Together these regression analyses modelled intra- and
inter-annual variance and, by substituting the year of the attacks into
each of the obtained regression equations, generated predictions for the
year of the attacks that we could compare with the observed counts of
underground passengers for the year of the attacks (April 1st 2005 – March
31st 2006). Predicted and observed counts are shown in the upper panel of
Figure 1.
We performed a similar analysis on the London bicycle survey data. Whilst
this survey does not purport to be representative of London-wide bicycle
levels it does represent bicycle levels on the “red route network” — 580 km
of strategic road (5% of total road length in London carrying 33% of
traffic by volume) managed by Transport for London. As such, fluctuations
in this survey could be seen as indicative of fluctuations in bicycling
levels in London. Regression models fitted well to historical counts of
bicyclists for each of 13 four-week periods (mean
R2=0.92) for the years from period 13 of 1999–200 to
period 8 of 2008–2009 excluding the year of the attacks (2005–2006); this
gave us models based on eight years for periods 1–8 and period 13 and
seven years data for the remaining periods. We included data for years
following the year of the attacks due to the relatively small number of
years of data available for the years preceding the attacks and in order to
get good fits to the regression models. Note that, while the years
following the attacks could conceivably reflect any impact of the attacks
on levels of bicycling, any upturn in those years would make any upturn in
the observed levels of bicycling in the year 2005–2006 harder to detect as
a disparity between predicted and observed.
As with the counts of underground passengers, the regression models modeled
intra- and inter-annual variance and provided predictions for the year of
the attacks that we could compare with the observed counts of bicyclists
for the year of the attacks (April 1st 2005 – March 31st 2006); predicted
and observed counts are depicted in the second panel of Figure 1.
The July 7th attacks occurred nearly half way through
period 4 of 2005–6. The top panel of Figure 1 shows that the observed
number of underground journeys was close to the predicted number for the
first three periods of the year (April 1st – June
24th) but below the predicted number from period 4 of
2005–6 through to period 13 (June 25th 2005 – March
31st 2006); for period 6 (August 21-September 17 2005)
observed journeys are outside the 95% interval. The underground system
operated a reduced service for a period after the attacks but was fully
operational by August 4th 2005 (Transport for London
Press Release, 2005) so disruption to service cannot account for this
observation. Simultaneously, observed numbers of cyclists (second panel
Figure 1) closely match predictions for the first three periods but are
noticeably above predictions from period 4 and for the remainder
of 2005–6; for period 6 the observed count is above the 95% confidence
interval.
To further test how the numbers of underground journeys and numbers of
bicycle journeys changed at the time of the attacks we tested the relative
accuracy of the forecasts of the regression models for the time periods
before and after the date of the attacks. For underground journeys the
discrepancy between predicted and actual was significantly greater for the
nine periods after the attacks than the three periods before (Before:
predicted = 235.2 million; before observed = 235.7 million; After
predicted = 788.8 million; after observed = 733.2 million)
χ2 (1) = 504,247, p<0.001. The models
over-predicted underground journeys after the attacks; across
the nine four-week periods after the attacks there were 55.6 million
(7.1%) fewer underground journeys than expected. For bicycle journeys
the models under-predicted bicycle journeys after the attacks;
across the nine four-week periods after the attacks there were 98,638
(10.6%) more than expected. The discrepancy between predicted and actual
was significantly greater for the nine periods after the attacks than the
three periods before (Before predicted = 301,743; before observed =
300,682; after predicted = 932,168; after observed = 1,030,806)
χ2 (1) = 1,249, p<.001.
We analyzed bicycle casualties by again using regression models for
historical counts for the ten calendar years 1995–2004 to generate
predictions for the year of the attacks. As the bicycle casualty data
were collated by calendar month per calendar year rather than by the
thirteen four week periods used in the other data sets, we analyzed the
data accordingly. The third panel of Figure 1 shows that bicycle
casualties (injuries including fatalities) increased in July, and
were above the levels predicted by the regression models we fitted for
each of the twelve calendar months (mean R2 = 0.75) for
all bar one of the months following July (September was a marginal
exception); August casualties exceeded the model’s 95% confidence
interval. As the July 7th attacks occurred almost
exactly half way through the year we compared the differences between
predicted and actual numbers of bicycle casualties in each half of the
year; casualties surpassed predictions significantly more during the
second half of 2005 (predicted = 1390; observed = 1604) than the first
half (predicted = 1256; observed = 1291), χ2 (1)
= 4.597, p = 0.032, indicating 214 (15.4%) additional casualties.
To investigate the link between changes in bicycling frequency and changes
in bicycle accident frequency we computed the correlation between the
historical variations in our measures of bicycle journeys and bicycle
accidents. Across the 88 consecutive four-weekly periods from March
2nd, 2000 to June 9th 2007 the
correlation was only modest — r(86) = 0.24, p = 0.026. However, over that
same time period, bicycle journeys increased substantially yet, despite
this, bicycle accidents declined somewhat: while bicycle journeys
correlated positively with time measured in four-week periods, r(86) =
0.83, p<0.001; bicycle accidents correlated negatively albeit
non-significantly, r(86) = -0.20, p = 0.06. Presumably some factor(s)
exogenous to the relationship between bicycle journey frequency and
bicycle accident frequency affected the bicycle accident rate over time as
their partial correlation, controlling for the time variable, revealed
that the underlying relationship between bicycle journeys and bicycle
accidents was much stronger, r(85) = 0.66, p<0.001.
Our regression analyses of car accident casualties are depicted in the
bottom panel of Figure 1; regression models for each calendar month fitted
well to historical data for the five years from 2000–2004 (mean
R2 = 0.86) and provided predictions for 2005. As is
evident from the figure, observed car accident casualties do not show any
noticeable increase over predicted levels; indeed, levels of car accident
casualties appear somewhat below the predicted levels for the
second half of the year. Nonetheless, and in contrast with the pattern
for bicycle casualties, the discrepancy between predicted and observed car
accident casualties in the second six months of the year (predicted =
7674; observed = 7502) was not significantly greater than the discrepancy
observed in the first six months of the year (predicted=7362; observed =
7275), χ2 (1) = 0.21, p = 0.65.
As a final point for this section we note that while our method of using
separate regression models of historic time series data to generate
predictions for each period (month or 4-week period) in the datasets
analyzed here might seem unduly elaborate, it offers clear advantages over
simpler methods suggested by one reviewer of this paper such as taking the
average of previous years. As noted above, along with the seasonal
variations within each year, there are also long term trends over the years
that would generate mispredictions if a simple averaging approach was
used. For example, the annual count of bicycle accidents over ten years in
the data we analyzed shows a long term downward trend – for each month
there is a strong negative correlation between the number of accidents and
increasing numerical year – (Pearson’s r between −0.758 and −0.967,
mean = −0.86). Our analyses show that, for each month, there is a strong
downward linear trend, and no evidence for a deviation from linearity (see
supplementary materials) which also confutes the possibility raised by an
anonymous reviewer that nonlinear trends in the historic data for bicycle
accidents might account for our observations.
3 Discussion
Our analyses establish a behavioral pattern consistent with the dread risk
effect. Although the pattern is for all casualties not just fatalities,
evidence of a secondary adverse effect of the London attacks is discernible
– though not in terms of an increase in car accident
casualties. Immediately following the attacks of July
7th, Londoners simultaneously reduced their travel on
underground trains by 7.1% and over the same period increased their travel
on bicycles by 10.6% resulting in an increase in the number of bicycle
road accident casualties; in the second half of 2005 bicycle accident
casualties were 15.4% higher than predicted. While the usual caveats of
correlational data apply, this pattern of change is consistent with a dread
risk effect – that, in the wake of the attacks, some people switched their
travel from underground trains to bicycles and that, as a consequence, the
London bomb attacks caused a mediated secondary casualty toll estimated at
214 additional casualties.
A question arises as to why the measures of secondary effects following
attacks on public targets are as variable as they appear to be. To wit, no
secondary effect on casualties was measurable in Spain following the 2004
Madrid attacks (López-Rousseau, 2005) but an effect was reported following
the 2001 attacks in the USA (Gaissmaier & Gigerenzer, 2012) and a
discernible effect of the London attacks is reported here for bicycle
casualties but not car casualties. Doubtless many factors could potentially
account for varying reactions to different attacks. As mentioned it is
possible that experience of attacks may reduce the dread risk reaction
(López-Rousseau, 2005; Yechiam, Barron & Erev, 2005). Familiarity with
such attacks may result in reduced dread risk, however the study into the
effects of the attacks in Spain did not report any measures of dread (such
as a survey of public attitudes) and other factors could account for the
differences. For example, if economic, social and geographical
circumstances are such that air travel is more discretionary and
substitutable by driving for American airplane passengers than train travel
is by driving for Spanish train travelers, we need not assume that
experience of attacks reduces dread. Like Spain, the UK (including London)
had experienced decades of bomb attacks and we were able to detect a
behavioural pattern consistent with a secondary effect in London – albeit
not in terms of an increase in car accident casualties. This nuanced
pattern, while hardly probative, fits Gaissmaier & Gigerenzer’s, (2012)
notion that an environmental structure that enables fear to manifest in
dangerous behavior is critical for dread risk effects.
Yechiam et al. (2005) investigated the impact of the prolonged wave of
attacks in Israel known as Al-Aqsa Intifada, where attacks were targeted
toward specific civilian targets in each month that led to fatalities
between September 2000 and October 2003. These authors suggested that,
while attacks create phobia-like responses, experience with the
environment could provide a therapeutic-like process that reduces the
long-term effects of terrorism. Yechiam et al. reasoned that, during the
Intifada, Israelis had to decide between a safe alternative (e.g., “stay at
home”) and a riskier alternative that exposed the decision maker to a
small probability of being attacked. Yechiam et al. argued that most
occasions when local residents went to a public place (walking in the
street or sitting in a café), implying selection of the risky alternative,
usually resulted in a “good” outcome – no attack – which would reinforce
the tendency to participate in similar activities in the future.
Consistent with this notion Yechiam et al. found that Israeli hotel visits
by tourists from abroad sharply decreased but that hotel visits by native
Israelis hardly reduced during the Intifada. This might reflect, as they
suggest, reduced dread in those exposed to risk without suffering bad
outcomes compared to those tourists from abroad who avoided exposure to
the risk and therefore did not obtain any positive experience from
surviving it. However Yechiam et al. also had no direct measures of dread
and, as they note, the cost of avoiding a risky area is much higher for
local residents than to potential visitors from abroad who, presumably, in
many cases, can simply select a different vacation location. For many
Israelis the risks of a hotel visit when they already live in a threatened
area were very marginal. Accordingly it is possible that dread was not
diminished in the manner suggested.
Critically for understanding their implications, the observational
studies in the USA, Spain, Israel and London are essentially
correlational; lacking experimental controls, they do not exclude
alternative explanations for the observed associations between attacks and
public behavior. Consequently caution is needed before inferring any
particular causal account. For example, it is possible that the observed
reduction in plane travel observed in the USA in the wake of the September
11th 2001 attacks was not due to dread at all but to
aversion to the inconvenience that the increased security
arrangements2 brought to air travel (see
Blalock, Kadiyali & Simon, 2007). Although in the present case it is
difficult to see any rival causal account for the observed pattern — for
example, in the wake of the London attacks there was no corollary
inconvenience caused by increases in security for traveling on the London
underground — we cannot establish conclusively that dread effects were
responsible for a switch – or even, strictly, that any people at all
actually “switched” travelling from underground to bicycle.
One putative defence of the rationality of a switch from public transport
to bicycling is that cycling confers health benefits that outweigh the
risks from higher exposure to air pollution and traffic accidents. While
there is evidence that this may be true in the Netherlands (de Hartog,
Boogaard, Nijland & Hoek, 2010), there is no evidence on the equivalent
position in London where both air pollution (see de Hartog et al, 2010)
and traffic accident risk (Pucher & Buehler, 2008) are considerably
higher. Nevertheless, irrespective of any cost benefit analysis, any
switch to bicycling triggered by the bomb attacks would somewhat
undermine the health benefits defence of the rationality of the human
response to risks: why wait for a terror attack before evaluating the
options for getting fit?
Another reservation that deserves consideration is the idea that although
switching to riskier forms of transport appears maladaptive, this
evaluation relies on the benefit of hindsight inasmuch as the attacks
might have heralded a change in the actuarial landscape; if attacks had
subsequently recurred to a significant extent then such transport switches
might not have been so ill advised. Indeed, 14 weeks after the September
11th 2001 attacks in the USA, there was a failed attempt
to blow up an American passenger airliner in midair and two weeks after
the July 7th attacks in London there were four failed
attempted bomb attacks, on one day, in London on public transport that
mirrored the pattern of the July 7th attacks in that
three were on underground trains and one was on a bus. However, as it
turned out, in both cases, there were no repeat events to cause a sea
change in the statistical risks.
The question of how to respond to unusual events has parallels with the
question posed by Paul Meehl in his paper “When shall we use our heads
instead of the formula?” (Meehl, 1957). Acknowledging that there will be
cases where so-called “broken leg cues”3 can invalidate
actuarially based predictions, Meehl argued that, nevertheless, the
occasions when people should use judgment to overrule statistics should be
“very very seldom” (p. 273). Yet, and contrary to Meehl’s prescription,
abundant evidence indicates that people very readily eschew statistics in
favor of judgment based on more individuated features of events. Exemplary
cases include, the strong tendency to discount historical data when
forecasting (e.g., Kahneman & Lovallo, 1993; Buehler, Griffin & Ross,
2002); the curiously incurious interest in the statistical probabilities of
winning shown by even experienced gamblers (e.g., Wagenaar, 1989;
Clotfelter & Cook, 1990) and people’s widespread ignorance of statistical
risks — for instance, Gigerenzer (2006) argued that few people will be
aware that the probability of losing one’s life is about the same for
driving 12 miles by car as for a nonstop flight from Boston to Los Angeles
(Sivak & Flannagan, 2003) — will all usually be to the detriment of
decisions under risk.
Claims that, in response to the risk of terror attacks, the vast sums spent
by governments and other institutions on aviation security and other
counter-measures could have been spent far more effectively (Linos, Linos
& Colditz, 2007; Stewart & Mueller, 2008; 2013) suggest that dread risk
may also adversely drive institutional policies to the detriment of many
individuals. For example, Stewart and Mueller’s (2008) cost-benefit analyses
of the increased US homeland security expenditure following the 9/11
attacks estimated that the annual cost per life saved ranged from $64
million to $600 million, far above the regulatory safety goal (societal
willingness to pay to save a life) of $1–$10 million per life saved.
Finally we note that, while the evidence for dread risk effects in the wake
of terrorism is correlational, experimental studies of decisions under
risk show that risky choices depend on affective reactions (Loewenstein,
Weber, Hsee & Welch, 2001). Specifically consistent with dread risk
effects, Rottenstreich and Hsee (2001) show, for “affect-rich” rather than
“affect-poor” events, more pronounced overweighting of small probabilities
and less sensitivity to probability variation (though see Klein et al.,
(2018) for a contrary finding). Assuming terrorism evokes emotion, this
pattern of “probability neglect” (Sunstein, 2002) could at least
contribute to dread risk reactions to terror attacks. Further analyses of
behavioral consequences of the discretionary choices people are free to
make in reaction to dreaded events may reveal other secondary effects.
4 References
Baron, J. (2004). Fatal car crashes after 9/11. Baron’s Blog April
7th, 2004. Retrieved from
http://finzi.psych.upenn.edu/~baron/mt/archives/000230.html
Blalock, G., Kadiyali, V., & Simon, D. (2007). The impact of post-9/11
airport security measures on the demand for air travel. Journal of
Law & Economics, 50, 731–755.
Buehler, R., Griffin, D., & Ross, M. (2002). Inside the planning fallacy:
The causes and consequences of optimistic time predictions. In T. D.
Gilovich, D. W. Griffin, & D. Kahneman (Eds.), Heuristics and
biases: The psychology of intuitive judgment (pp. 250–270). New York:
Cambridge University Press.
Clotfelter, C. T., & Cook, P. J. (1990). On the economics of state
lotteries. Journal of Economic Perspectives, 4(4), 105–119.
The Economist (2000). How not to run a railway (Editorial). The
Economist, 357 (8198), 35–36. November 23rd, 2000.
Retrieved from http://www.economist.com/node/433992.
Gaissmaier, W. and Gigerenzer G. (2012). 9/11, Act II: a fine-grained
analysis of regional variations in traffic fatalities in the aftermath of
the terrorist attacks. Psychological Science, 23, 1449–1454.
Gigerenzer G. (2004) Dread risk, September 11, and fatal traffic accidents.
Psychological Science, 15, 286–287.
Gigerenzer G. (2006). Out of the frying pan into the fire: behavioural
reactions to terrorist attacks. Risk Analysis, 26, 347–351.
de Hartog, J.J., Boogaard, H., Nijland, H. & Hoek, G. (2010). Do the
health benefits of cycling outweigh the risks? Environmental
Health Perspectives, 118, 1109–1116.
Kahneman, D., & Lovallo, D. (1993). Timid choices and bold forecasts: A
cognitive perspective on risk taking. Management Science, 39,
17–31.
Klein, R. A., Vianello, M., Hasselman, F., Adams, B. G., Adams Jr, R. B.,
Alper, S., ... & Batra, R. (2018). Many Labs 2: Investigating variation
in replicability across samples and settings. Advances in Methods
and Practices in Psychological Science, 1(4), 443–490.
Linos, E., Linos, E., & Colditz, G. (2007). Screening programme evaluation
applied to airport security. BMJ, 335(7633), 1290–1292.
Litman, T. (2005). Terrorism, Transit and Public Safety: Evaluating
the Risks. Victoria Transport Policy Institute. Retrieved from:
http://www.vtpi.org/transitrisk.pdf.
Loewenstein, G. F., Weber, E. U., Hsee, C. K. & Welch, E. S. (2001). Risk
as feelings. Psychological Bulletin, 127, 267–286.
López-Rousseau, A. (2005). Avoiding the death risk of avoiding a dread
risk. Psychological Science, 16, 426–428.
Meehl, P. E. (1957). When shall we use our heads instead of the formula?
Journal of Counseling Psychology, 4, 268–273
Muir, H. (2005, July 12) US bans military staff from travelling to London,
The Guardian. Retrieved from:
http://www.guardian.co.uk/uk/2005/jul/12/world.transport.
Myers D. (2001). Do we fear the right things? American
Psychological Society Observer, 14, 3.
Pucher, J. & Buehler, R. (2008) Making cycling irresistible: lessons from
the Netherlands, Denmark and Germany. Transport Reviews, 28,
495–528.
Rottenstreich, Y. & Hsee, C. K. (2001). Money, kisses, and electric
shocks: An affective psychology of risk. Psychological Science,
12, 185–190
Schlenger, W.E., Caddell, J.M., Ebert, L., Jordan, B.K., Rourke, K.M.,
Wilson, D., et al. (2002). Psychological reactions to terrorist attacks:
Findings from the National Study of Americans’ Reactions to September 11.
Journal of the American Medical Association, 288, 581–588.
Schuster, M. A., Stein, B. D., Jaycox, L. H., Collins, R. L., Marshall, G.
N., Elliott, M. N., …Berry, S. H. (2001). A national survey of stress
reactions after the September 11, 2001, terrorist attacks. New
England Journal of Medicine, 345, 1507–1512.
Sivak, M., & Flannagan, M. J. (2003). Flying and driving after the
September 11 attacks. American Scientist, 91, 6–8.
Slovic P. (1987). Perception of risk. Science, 236, 280–285.
Stewart, M. G., & Mueller, J. (2008). A risk and cost-benefit
assessment of United States aviation security measures. Journal of
Transportation Security, 1(3), 143–159.
Stewart, M. G., & Mueller, J. (2013). Terrorism risks and cost-benefit
analysis of aviation security. Risk Analysis, 33(5), 893–908.
Su, J. C., Tran, A. G. T. T., Wirtz, J. G., Langteau, R. A., & Rothman,
A. J. (2009). Driving under the influence (of stress): evidence of a
regional increase in impaired driving and traf[FB01?]c fatalities after the
September 11 terrorist attacks. Psychological Science, 20, 59–65.
Sunstein, C. R. (2002). Probability neglect: emotions, worst cases, and
law. The Yale Law Journal, 112(1), 61–107.
Transport for London Press Release (2005, August 19). Retrieved from:
https://www.tfl.gov.uk/info-for/media/press-releases/2005/august/tube-passenger-numbers-showing-strong-recovery.
Transport for London (2007). London Travel Report 2007. Retrieved
from:
http://www.tfl.gov.uk/cdn/static/cms/documents/London-Travel-Report-2007-final.pdf.
Accessed on October 20th 2014.
Wagenaar, W-A. (1989). Paradoxes of Gambling Behaviour. Hove,
England: Erlbaum.
Yechiam E, Barron G. & Erev I. (2005). The role of personal experience in
contributing to different patterns of response to rare terrorist attacks.
Journal of Conflict Resolution, 49, 430–439.
This document was translated from LATEX by
HEVEA.