| Figure 1: Average fraction of tokens kept across conditions and blocks. |
Judgment and Decision Making, Vol. 16, No. 1, January 2021, pp. 142-164
Steady steps versus sudden shifts: Cooperation in (a)symmetric linear and step-level social dilemmasJudith Kas* David J. Hardisty# Michel J. J. Handgraaf$ |
Abstract:Are groups of people better able to minimize a collective loss if there is a collective target that must be reached or if every small contribution helps? In this paper we investigate whether cooperation in social dilemmas can be increased by structuring the problem as a step-level social dilemma rather than a linear social dilemma and whether cooperation can be increased by manipulating endowment asymmetry between individuals. In two laboratory experiments using ‘Public Bad’ games, we found that that individuals defect less and are better able to minimize collective and personal costs in a step-level social dilemma than in a linear social dilemma. We found that the level of cooperation is not affected by an ambiguous threshold: even when participants cannot be sure about the optimal cooperation level, cooperation remains high in the step-level social dilemmas. We find mixed results for the effect of asymmetry on cooperation. These results imply that presenting social dilemmas as step-level games and reducing asymmetry can help solve environmental dilemmas in the long term.
Keywords: cooperation, social dilemma, behavioral economics, environmental behavior
Many efforts have been made that aim to understand and increase cooperation in order to solve social dilemmas. These dilemmas are often framed as linear problems (e.g., Balliet, Li, MacFarlan & Van Vugt, 2011), while in reality many societal problems are not linear. In the current paper we theorize the conditions under which cooperation may be higher in non-linear dilemmas and we perform two incentive-compatible laboratory experiments in which we test our theory.
In linear social dilemmas each decision by every agent has a similar impact on the outcomes of the dilemma: every extra euro donated, petition signed and every kilometre driven less has an equal positive impact. However, in reality many societal problems are not linear, but rather S-shaped, which means that the expected outcome is probabilistically related to the proportion of cooperation. For example, if a fish stock is threatened, not every additional fish caught is considered equally harmful to the stock, and each person cannot equally harm or protect the stock. Rather, the more a population is depleted, the lower the capacity of the population to reproduce itself and the larger the impact of catching an extra fish, until the population is too small to reproduce itself (Myers, Rosenberg, Mace, Barrowman & Restrepo, 1994). Another example are ‘desire lines’, paths created by pedestrians or vehicles through a patch of grass. If only a few people walk on the grass there is no problem, but if more people take the shortcut, the grass will get trampled. If a lot of people have already walked on the grass, an additional person taking the shortcut does not make a difference anymore, since the grass is dead anyway (Baron, 2008).
An extreme form of this probabilistic distribution is a step-level problem in which contributions have no effect, except at a specific level of cooperation (Abele, Stasser & Chartier, 2010). As such, step-level problems involve sudden rather than gradual shifts. Once a certain threshold is reached, the outcomes change dramatically, but if the threshold is not reached, no change occurs. An example of such a situation is a situation where a group has to make a joint decision, e.g., the decision to place solar panels on a shared roof. To get the majority vote, some group members may have to spend time and effort to collecting information and convincing others that it is a good idea. When they succeed, the whole group benefits, but when they fail they do not benefit, while they also bear the costs in terms of time and money.
The question of why some projects attract donations and supporters or induce behavioural change, while others do not is topic of many research papers and is a question of large societal relevance. In the current research we study how the structure of a problem affects the ability for groups to solve social dilemmas. Extensive research on both linear and step-level social dilemmas has been done, for example in relation to social value orientation (Attari, Krantz & Weber, 2014; Balliet, Parks & Joireman, 2009), social identity (Simpson, 2006), the role of uncertainty (Biel & Gärling, 1995), membership fees (Bchir & Willinger, 2013), social norms and efficacy (Attari et al., 2014) and the possibility to punish (Cooper & Stockman, 2002). However, we are not aware of any direct empirical comparisons between these two problem types. In the current paper we compare cooperation levels in a linear social dilemma with a step-level social dilemma. We theorize why and under what conditions the shape of the outcomes (relative to the total contributions) matters. This helps us to form predictions about how different factors will work out differently in the two dilemmas. We also test how this may be moderated by asymmetry (where different people are endowed with different amounts), which is found to be a complicating factor in establishing cooperation (Zelmer, 2003).
In the first experiment we show that individuals cooperate more in step-level social dilemmas than in linear social dilemmas and that asymmetry between individuals in a group affects cooperation differently in the two different dilemmas. We use ‘public bad’ games, in which groups only pay a group cost when defection exceeds a certain threshold. In the second experiment we explore the extent to which the higher cooperation level in the step-level social dilemma is robust to ambiguity in the extent to which each group member should cooperate to avoid exceeding the threshold.
Social dilemma problems have been extensively studied using decision making games: in experiments that resemble simplified social dilemma situations individuals are asked to make a choice between their self-interest and the group’s interest. The main paradigm that is used to study social dilemmas are public goods games (in which players can cooperate by contributing to a public good) and resource dilemma games (in which players cooperate by not taking from a common resource pool; Van Dijk & Wilke, 2000). However, many societal problems do not resemble public goods or resource dilemmas, but rather a ‘public bad’: the more CO2 is emitted, the worse it is for the climate, which is bad for everyone; the more people litter, the worse for everyone, etc. The defecting behavior is here to litter or to emit CO2 and the cooperative behavior is to not perform those harmful behaviors. Because public bad games have received relatively little attention in social dilemma research, the current study explores the research questions in a public bad scenario. Individuals receive tokens that they can either keep or put in a common pool. Tokens that are kept incur costs for the individual, while tokens given to the common pool may incur costs for the group but there are no direct costs for the individual. Cooperation is here defined as the number of tokens kept, while defection is defined as the number of tokens deposited. Another reason to study this type of social dilemmas is that findings from earlier research on public goods games may not always be applicable to these situations where cooperating means refraining from certain harmful behavior. While in public goods games individuals with larger endowments are both wealthier and have more power, this does not apply to the case of public bad games: individuals who have a larger endowment have a larger influence on the group outcome, but may also face larger costs without benefitting more from the group outcome than individuals with a smaller endowment.
The linear social dilemma is represented by a Public Bad Game with a linear relation between tokens given and group costs. In particular, we look at behavior in a Public Bad Game that is framed as an environmental scenario. For every pollution token deposited to the common pool, the group costs increase with a fixed amount. We focus on situations in which the group costs are equally split over all the actors and where the group costs per actor are lower than the individual costs of keeping tokens. In the step-level social dilemma, the relation between tokens deposited and group costs is non-linear. Rather than paying per token in the common pool, the group pays a fixed amount only when more tokens than a certain threshold are given to the common pool, otherwise there are no group costs (but players always have to pay the individual costs the for tokens they keep). Individuals in groups will thus benefit from staying under the threshold, analogous to a situation where fishers benefit from sustaining the reproductive capacity of common fish stock. The amount that needs to be paid is independent of the number of tokens extra deposited above the threshold. (Therefore, once past the threshold, it is rational for all players to put all pollution tokens into the common pool.)
We use game-theoretical tools to describe how behavior differs between linear and step-level Public Bad Games and to describe how asymmetry between actors affects behavior differently in the two social dilemma types. We assume that individuals have different motivations that drive their behavior in these social dilemmas. While some individuals will be motivated only to serve their own interest, other individuals may me more altruistic. That means that they are more willing to give up their own payoff to increase the payoff of others or reduce their costs.
We expect that individuals cooperate more in step-level social dilemmas than in linear social dilemmas for two reasons.
First, in a linear social dilemma, there is only the Nash equilibrium. Regardless of the choice of the other players, defecting always yields superior outcomes for the self, because cooperation involves costs to the cooperators that are not compensated with the benefits of a higher cooperation level. Since the costs of keeping tokens are always higher than the costs of depositing tokens to the common pool, self-interested actors are expected to deposit all their (negative) tokens into the common pool. This Nash equilibrium in which everyone defects is clearly not Pareto efficient: if everyone would have cooperated, everyone would have had a better outcome (Abele et al., 2010). 100% cooperation is the Pareto efficient solution, but this situation is not a Nash equilibrium, because defecting is always payoff maximizing in linear social dilemmas. As a consequence, the Pareto efficient solution in which everybody cooperates is unstable (Abele et al., 2010): it is always tempting for individuals to move towards defecting and thus move away from the optimal solution. If people believe that others cannot resist the temptation to defect because it gives them a higher payoff, they themselves may be less motivated to cooperate.
While purely self-interested individuals are not expected to cooperate in a linear social dilemma, more altruistic individuals may be more motivated to cooperate, since they do not only care about their own payoff, but also about the payoff of others.
In a repeated social dilemmas, individuals may also cooperate if it induces other players to respond in kind and cooperate as well. Earlier experiments on linear social dilemmas indeed find that while some individuals cooperate in linear social dilemmas, cooperation quickly breaks down when there are no institutions such as punishments or reputation systems to motivate self-interested individuals to cooperate (Fehr & Gächter, 2000).
In step-level social dilemmas on the other hand, cooperating does not necessarily lead to a reduction in personal payoff. If an actor expects his or her cooperation to be critical for the group to stay under the threshold, it may under certain circumstances be beneficial for the self-interested individual to cooperate to avoid the group penalty for exceeding the threshold. If the group penalty is sufficiently large and the costs of keeping tokens sufficiently low, individuals may receive a higher payoff if they keep some tokens than if they dump everything. When the threshold is exactly reached there is a Nash equilibrium that is also Pareto efficient (Abele et al., 2010). No one can move from cooperating to defecting without harming the others and themselves, because that would mean that the threshold is no longer avoided and both the personal and societal benefits would be smaller than if that person would have cooperated. Similar to the linear social dilemma, more altruistic individuals will be more likely than more selfish individuals to cooperate if their contributions help the group.
The difference in contributions between the linear and the step-level social dilemmas may depend on the level of the threshold (Rapoport & Suleiman, 1993). While the best strategy for self-interested individuals in the linear social dilemma is to defect, cooperation increases their personal payoff under certain conditions in the step-level dilemma. More altruistic players are expected to cooperate more in the step-level social dilemma when exceeding the threshold can be avoided only if they cooperate more their ‘natural’ level of cooperation, which is the number of tokens they would keep in the linear social dilemma. If the threshold can be avoided by keeping fewer tokens than they would keep in the linear social dilemma, altruistic individuals may cooperate less in the step-level social dilemma than in the linear social dilemma.
A meta-analysis that includes 349 earlier studies on repeated linear public goods games found an average cooperation level of 37.7% (Zelmer, 2003). In the current experiment we choose a threshold that can be avoided only if subjects cooperate more than the average cooperation level in earlier studies. We ask whether cooperation can indeed be higher in a step-level game than in a linear game. Groups in step-level social dilemmas are expected to minimize (costly) cooperation, while still staying under the threshold. They are not expected to cooperate (much) more than required for staying under the threshold, so when staying under the threshold requires less cooperation than the average cooperation rate in a linear social dilemma, it is not possible to ask whether cooperation can be higher in threshold social dilemmas than in linear social dilemmas. However, staying under the threshold should also not require too much cooperation. When staying under the threshold requires little cooperation, it is less costly for individuals to cooperate to make sure the group as a whole stays under the threshold. The more cooperation is required for staying under the threshold, the lower the relative benefit of cooperating, and the less likely that individuals will cooperate. A threshold that is exceeded when groups deposit more than 50% of their endowment is a realistic target for groups and is also higher than the average cooperation rate in linear games.
We hypothesize that with this threshold, cooperation will be higher in the step-level social dilemma than in the linear social dilemma.
Another reason why we expect a difference in cooperation levels between linear social dilemmas and the step-level social dilemmas applies only to social dilemmas in which cooperation and defection are gradual (someone can, e.g., cooperate for 75% and defect for 25%) rather than a dichotomous cooperate or defect choice. Different individuals have different perceptions of what an acceptable amount to cooperate is (e.g., Buchan, Croson & Johnson, 2004; Van Dijk & Wilke, 1993). In linear social dilemmas those individual differences will translate into different cooperation rates by different persons, but step-level social dilemmas have an anchor of what an acceptable amount to cooperate is and variety in perceived acceptable amounts may therefore be relatively limited (Van Dijk, de Kwaadsteniet & De Cremer, 2009). The threshold indicates what the right amount to cooperate is. If the threshold is exceeded when more than 45 tokens are deposited and there are three persons in a group, the fair amount to deposit is 15 for every player, so in step-level social dilemmas it is easier for individuals to decide how much they should cooperate. In contrast, linear social dilemmas lack this reference point. If staying under the threshold in a step-level dilemma requires more cooperation than the average cooperation rate in linear social dilemmas, and if individuals try to avoid that threshold, cooperation will be higher in step-level social dilemmas (Croson & Marks, 2000; Suleiman & Rapoport, 1992).
Individuals cooperate more in step-level social dilemmas than in linear social dilemmas.
Diversity in endowments, influence or consequences of cooperation among individuals in a group may affect behavior in both linear and step-level social dilemmas. When these is heterogeneity in endowments, some individuals have more tokens to keep or dump than others. While in the symmetric case there may be ambiguity about how much similar individuals should cooperate, asymmetry in endowments introduces a second source of ambiguity: what should the contribution of each group member be, relative to their endowment? Earlier studies on asymmetry in endowments show mixed results: in a meta-analysis, Zelmer (2003) found that asymmetry in endowments leads to lower cooperation in linear public goods games, while in another meta-analysis of threshold public goods games, Croson and Marks (2000) found no effect of asymmetry between actors.
We discuss how the impact of (a)symmetry may be different for linear vs. step-level social dilemmas. We formulate two contrasting hypotheses. On the one hand, we might expect the effect of asymmetry to be more negative in linear social dilemmas than in step-level social dilemmas. While defection is always better for the individual in the linear dilemma, this is not always the case in step-level social dilemmas. If a person’s cooperation is critical for staying under the threshold in the step-level situation, (s)he should cooperate to maximize both his or her own benefit and the collective benefit. In this case, cooperating overlaps with self-interest and therefore individuals who possess higher endowments in step-level social dilemmas may be likely to cooperate, even if group members with fewer endowments cooperate relatively less. In linear social dilemmas this logic does not apply, since it is not in the self-interest of individuals with more endowments to compensate the lower cooperation of individuals with fewer endowments, even if individuals with smaller endowments cooperate less. Therefore, individuals who possess higher endowments are expected to cooperate more in the step-level social dilemma than in the linear social dilemma. This leads to the following hypothesis:
There will be an interaction between (a)symmetry and social dilemma type, such that the asymmetry has a more negative effect in linear dilemmas than in step-level dilemmas.
An alternative prediction comes from the logic of appropriateness (Weber, Kopelman & Messick, 2004). When deciding how much to cooperate or defect, participants ask themselves “what does a person like me do in a situation like this?” From this perspective, cues about the “appropriate” amount to cooperate are critical. In the symmetric, step-level social dilemma, the threshold (equally divided among participants) provides a natural reference point for the appropriate amount to cooperate. In the other three conditions, the asymmetry in endowments or lack of a threshold mean that the “appropriate” amount to cooperate is less obvious, and people may (selfishly) cooperate less as a result.
There will be an interaction between (a)symmetry and social dilemma type, such that the asymmetry has a more negative effect in step-level social dilemmas than in linear social dilemmas.
We conducted a laboratory experiment at the University of British Columbia (Vancouver, Canada) in which 120 participants took part in one of the 16 experimental sessions (with 6 or 9 participants in each session, according to the number that signed up).
The participants played 20 to 40 rounds of a contextualized Public Bad Game in groups of three participants.1 Three-person groups are practical while still allowing for group dynamics that characterize real-world problems.2 The groups were shuffled after every block of 10 rounds. The experiment had a 2 (game type: linear vs. step-level) x 2 (symmetry: symmetric vs. asymmetric actors) between-participants design. In the symmetric condition, all participants started each round with 30 pollution tokens, while in the asymmetric condition one participant per group received 20 tokens, one participant received 30 tokens and one participant received 40 tokens at the beginning of each round.3 Participants were asked to imagine that they were the owner of a company that was located at the shore of a lake, along with two other businesses, and that these businesses together were responsible for the maintenance of the lake. They were asked how many tokens they wanted to keep (‘process in an environmentally friendly way’) and the number they wanted to deposit to a common pool (‘dump in the lake’). For every token kept, the participant paid costs of $1 million. In the linear game, every token deposited cost the group $2 million.4 In the step-level game, the group paid the costs of $180 million only when they together deposited 46 tokens (50% of the total amount of tokens or more.5 If they deposited 45 tokens or less, they did not have to pay the group costs. The group costs were equally split over the group members. At the end of the experiment, the participants received $15 minus the $0.10 for every $50 million cost in the game. Thus, the game was incentive compatible. The average payment was $11.45.
Participants were recruited via posters in university buildings, messages on Facebook and emails to subscribers of an email list. We used the software Z-tree for playing the social dilemma game (Fischbacher, 2007). Each session lasted for 50 minutes. 83 participants (69.2%) were female, age ranged between 18 and 60 (Mage = 24.3, SDage = 7.8).
The participants were seated in a private cubicle with a computer, from where they could not see the other participants. At the start of the session, the experimenter read instructions out loud that informed the participants about the duration and procedure of the study (Supplementary materials). The participants read on-screen instructions explaining the game and they answered three comprehension questions. If they failed to give the right answer twice, the experimenter verbally explained the steps to calculate the answers. All participants were able to correctly answer the questions after getting the verbal explanation. Next, the experimenter showed an example of the interface of Z-tree on the big screen in front of the room, and all the participants were directed to the starting screen of Z-tree on their individual computer terminals.
After playing the game, the participants answered five demographic questions (gender, age, level and field of education and nationality) and a number of questions on numeracy (Schwartz, Woloshin, Black & Welch, 1997), environmental attitudes (Dunlap, Van Liere, Mertig & Jones, 2000), social value orientation (Murphy, Ackermann & Handgraaf, 2011), consideration of future consequences (Strathman, Gleicher, Boninger & Edwards, 1994) and temporal discounting (Kirby, Petry & Bickel, 1999).
Two pilot sessions were conducted to make sure that the parameters we chose led to variance in cooperation rates (i.e., avoiding ceiling and floor effects).
In some groups reading the instructions and answering the comprehension questions took longer than in other groups, and as the session time was limited to 50 minutes, not every group played the same number of blocks. On average fewer rounds (M = 38.57, SD = 3.53) were played in the asymmetric than the symmetric conditions (M = 30.26, SD = 8.26; F(1, 118) = 53.08, p < .001). The reason for this is that participants in that conditions took more time for reading the instructions and answering the comprehension questions, probably because the asymmetric games were more complex. One group played only half of the third block due to a lack of time.
To test the hypotheses, we performed a multilevel linear regression with the average fraction of tokens kept by a participant in a block as the dependent variable. (Thus, higher numbers indicate more cooperation.) We included the type of game (linear or step-level), the symmetry of the participant endowments (symmetric or asymmetric), and the interaction as independent variables.
Decisions are nested in participants, while participants and groups are nested in session. Participants and groups are crossed: the same participant was a member of multiple groups, because after every block the groups were shuffled. We built the statistical model step-by-step and compared the AIC and deviance of nested models to assess the model fit of the nested models. First, we estimated an intercept only model (AIC = 38.92, Deviance = 26.7, df = 419). Adding random intercepts of participants (AIC 0.4 = −95.1, ΔDeviance = 127.8, p < 0.001), groups (AIC = −156.8, ΔDeviance = 63.7, p < 0.001), and sessions (AIC = −168.8, ΔDeviance = 14.0 , p < 0.001) one-by-one, significantly improved the model fit. In the next step we added the independent variables game type (linear or step-level), symmetry of the participants, and the interaction between the two (AIC = −174.4, ΔDeviance = 11.6, p = 0.009).
In a second model we also included the block number (1–4) as an independent variable, as well as the interaction with the treatment variables (AIC = −200.9, ΔDeviance = 34.5, p < 0.001). Allowing the slope of the block number to vary across participants, groups and sessions did not improve the model fit (AIC = −189.3.1, ΔDeviance = 0.4, p = 0.999). The final model with random intercepts for participants, groups and sessions and with game type, asymmetry, block number, and all interactions between these three variables is reported in Table 1, models 1 and 2.
In the step-level games, the fraction of tokens kept is not the only measure of successful cooperation. We also explored if the extent to which the groups managed to stay under the threshold differs across the conditions. To do so, we ran a multilevel regression with the fraction of rounds in which a group managed to stay under the threshold as the dependent variable. Compared to the intercept only model (AIC = 83.7, Deviance = 12.7), the model with random intercepts for sessions had a better fit (AIC = 72.5, ΔDeviance = 53.8, p < 0.001). In the next step we added asymmetry and the block number (AIC = 70.7, ΔDeviance = 7.8 , p = 0.050). Allowing the slope of block to vary across sessions did not improve the model fit (AIC = 74.6, ΔDeviance = 0.1 , p = 0.951). The final model with a random intercept for session and asymmetry and block number as the independent variables is reported in Table 1, model 3.
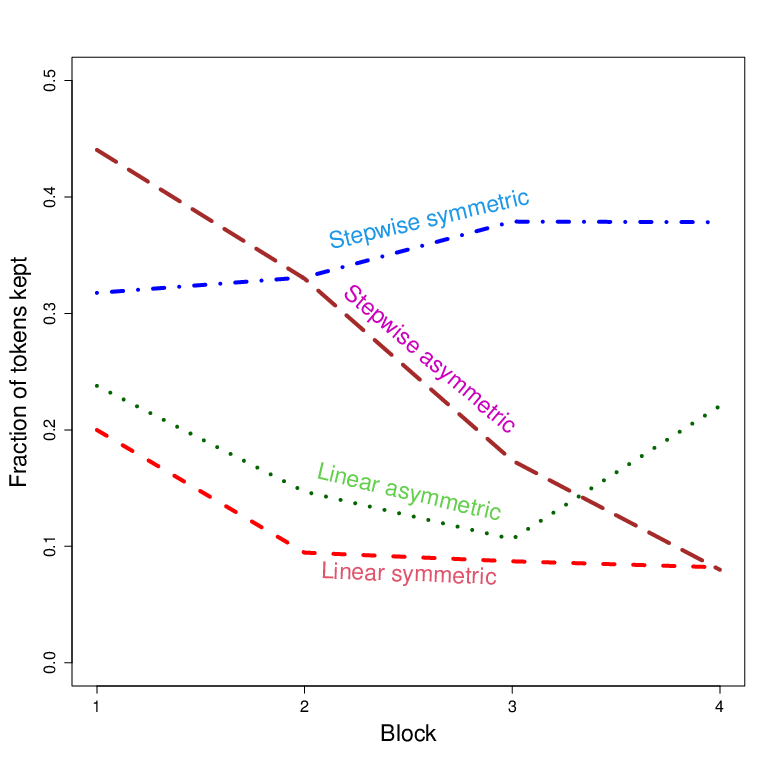
Figure 1 shows the average number of tokens kept by participants in the different conditions. Cooperation seems to start highest in the step-level conditions, but strongly decreased in the step-level asymmetric condition. In the other conditions cooperation was relatively stable over time.
Table 1: Results cross-classified multilevel regression on fraction of tokens kept: mean and (s.e.).
Table 1 contains the results of the regressions. Supporting hypothesis 1, the participants kept more tokens in the step-level condition than in the linear condition. There is no significant difference between the symmetric and the asymmetric conditions, and there is no difference in the effect of asymmetry in the linear game than in the step-level game, so we reject both hypotheses 2a and b.
Over the blocks, cooperation slightly decreased in both linear conditions (b = −0.034, p = 0.011), was more or less stable in the step-level symmetric condition (b = 0.023, p = 0.19) and strongly decreased in the step-level asymmetric condition (b = −0.118, p < .001).
Figure 1: Average fraction of tokens kept across conditions and blocks.
Model 3 shows that in the step-level conditions, groups were equally likely to stay under the threshold in the first block across the conditions, but over the blocks this probability decreased in the asymmetric condition, while it was stable in the symmetric condition.
In the theory section we discussed two mechanism that could explain the difference between the linear and the step-level conditions. According to our first mechanism, individuals in the step-level condition would have an incentive to cooperate, because the costs of non-cooperation could exceed the costs of cooperation. The willingness to cooperate more than a ‘fair share’ (half of their endowment, or 15 tokens) can thus expected to be higher in the step-level game if that was necessary for the group to stay under the threshold.
To test if this indeed the case, we ran a regression with a binary variable that indicates whether a subject kept more than half of their endowment as the dependent variable. As an independent variable we included a dummy variable that indicated if in the previous round a contribution of more than half of a subject’s endowment was critical for staying under the threshold. This thus depended on the number of tokens kept by the group members of the subject. We added random intercepts for subjects and groups and we controlled for block, round number (1-10) and asymmetry. We first ran the model separately for the linear and the step-level condition. After that we run the model on all subjects and we add the interaction between game type and the dummy that indicated if a higher contribution was critical. As expected, we find that individuals in the step-level condition were more likely to keep more than half of their tokens if necessary (b = 0.093, t(2044) = 6.082, p < 0.001), while we do not find evidence for that in the linear games (b = 0.024, t(1675) = 1.384, p = 0.167). This difference in the effect between the linear and the step-level game is significant (b = 0.069, t(3725) = 2.962, p = 0.003).6 We thus find evidence that individuals are more willing to cooperate in the step-level condition because it is in their own interest.
Based the self-interest argument, we also hypothesized that asymmetry between individuals would have a smaller effect in step-level games (H2a). In the linear games there would be no reason for individuals to cooperate more if they have a larger endowment, because it is always in their interest to defect. However, in the step-level game, it may be in the interest of individuals with a large endowment to cooperate more in absolute or relative terms, to insure that the group does not exceed the threshold. We know that in the step-level condition subjects were more likely to keep more than half of their endowment if that would have helped the group stay under the threshold in the previous round. However, this mechanism can explain only why asymmetry has a smaller effect on cooperation in the step-level game if there is a difference in the frequency with which it is necessary to keep more than half of one’s endowment. We tested this mechanism using a regression in the step-level conditions with the need to keep more than half of the endowment as the dependent variable and the asymmetry condition as the independent variable. We again controlled for round and block, and we included random intercepts for subjects and groups. The results show that the situation that subject needs to keep more than half of their endowment to avoid exceeding the threshold does not occur more often in the asymmetric condition (b = 0.018, t(2045) = 0.382, p = 0.702). This result implies that although subjects were willing to keep more tokens if necessary, the frequency with which this was necessary was the same in the symmetric and asymmetric step-level game. This means that the effect of asymmetry on cooperation is not smaller in the step-level condition because it is in the interest of the high-endowed to cooperate at a higher level.
The second mechanism that we discussed and that may explain why there is more cooperation in the step-level condition than in the linear condition, is that the threshold provides a clear reference point. The ambiguity caused by a lack of a reference point is expected to decrease over the rounds, as subjects over time get informed about the strategies of their fellow group members. To test this mechanism, we studied variation in contributions across the conditions and over the rounds, since ambiguity is expected to lead to more variation in cooperation. Per group and per round we calculated the standard deviation of the absolute number of tokens and of the fraction of tokens kept by the three group members. Figure 2 shows the average standard deviation within the groups over the rounds
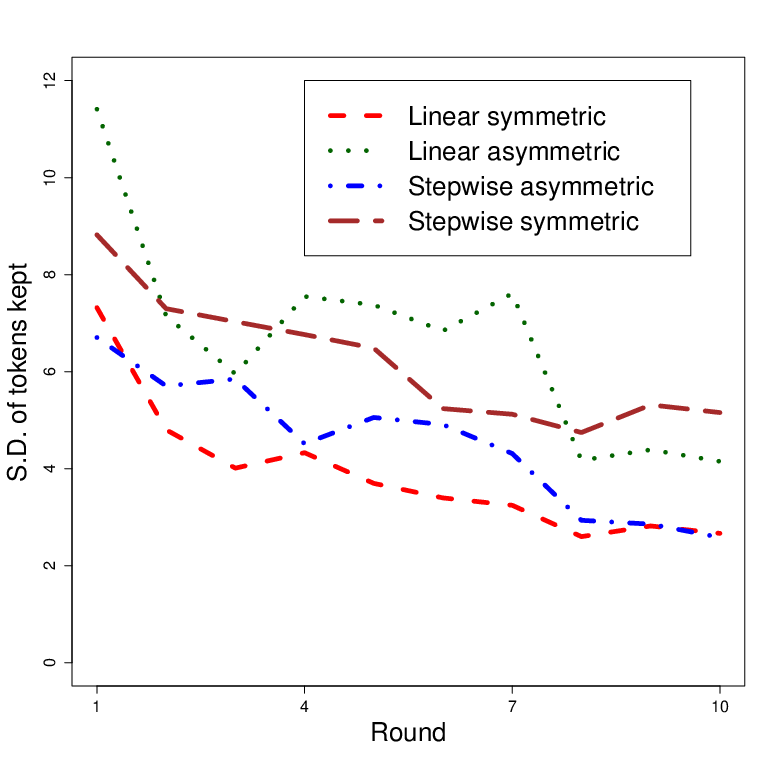
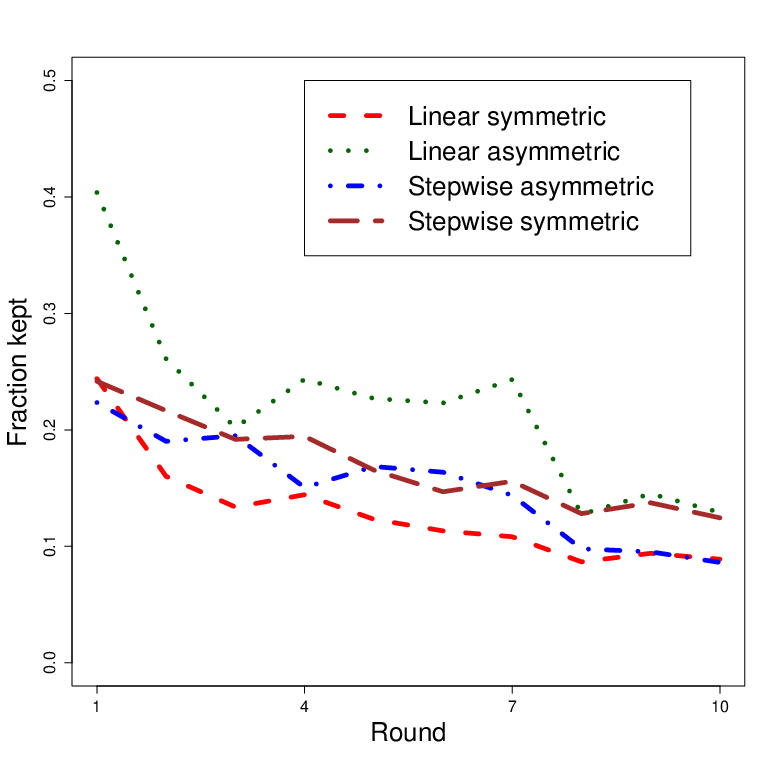
Figure 2: Standard deviation of number of tokens kept (left panel) and fraction of tokens kept (right panel) per round and condition.
A regression with the standard deviation within each group per round as the dependent variable and the treatment variables as independent variables and with controls for the round and block number confirms that asymmetry in endowments increases the standard deviation within groups (b = 1.765, t(1380) = 5.35, p < 0.001) and that the standard deviation decreases over the rounds (b = −0.445, t(1380) = −7.98, p < 0.001). However, we do not find that there is more variance in the step-level condition than in the linear condition (b = 0.381, t(1380) = 1.18, p = 0.240). The difference between the two conditions in cooperation can thus not be explained by a difference in ambiguity with regard to the appropriate level of cooperation. These findings are robust to using the standard deviation in the fraction of tokens kept, instead of in the absolute number of tokens kept.
We also argued that the additional ambiguity introduced by asymmetry is expected to have a limited influence in the linear games, whereas it may distort the positive effect of the clear threshold in linear games. We do not find that asymmetry has a larger effect on the standard deviation per group in the step-level condition than in the linear condition when we include an interaction between game type and asymmetry (b = -1.027, t(1379) = −1.57, p = 0.117). When looking at the standard deviation in the fraction of tokens kept we even find that the negative effect of the asymmetry of endowments is larger in the linear condition than in the step-level condition (b = −0.069, t(1379) = −3.28, p = 0.001). These findings imply that we do not find support for the mechanism that the introduction of asymmetry has a stronger effect in the step-level game.
Supporting H1, there was more cooperation in the step-level social dilemma than in the linear social dilemma. We argued that there could be two mechanisms underlying this difference. First, in the step-level game it may be in the self-interest of individuals to cooperate, while that is never the case in the linear game. Second, the threshold provides a reference point for the appropriate level of cooperation. We find evidence for the first mechanism, but not for the second.
We did not find an effect of asymmetry in endowments across group members in the linear social dilemma. In the step-level social dilemma we found that cooperation over time decreased strongly in the asymmetric game, but not in the symmetric game. The difference in the effect of asymmetry on cooperation between the linear and the step-level game was not significant, so we reject hypotheses 2a and 2b. To exclude the possibility that this the lack of an interaction between game type and asymmetry was the result of two distinct mechanisms with opposite effects, we made an effort to empirically disentangle these mechanisms. We did not find evidence that that asymmetry had a smaller effect in the step-level game because it was in the self-interest of individuals to cooperate. Although we found that asymmetry in general led to ambiguity, we did not find that this effect was stronger in the step-level condition. The lack of the existence of the interaction can thus not be explained by these two opposing mechanisms.
Another mechanism that could affect the interaction between game type and asymmetry is that in the asymmetric step-level dilemma, it may not always be in the self-interest of individuals with a large endowment to cooperate, even if their cooperation is necessary for staying under the threshold. In some cases the costs of full cooperation (i.e., keeping the full endowment) may exceed the group costs divided over the individuals. In the setup that we used this was never the case: the individual costs of cooperation could not exceed the individual share of the group cost.7
This study had a number of limitations. First, the threshold level of 50% of possible contributions is a very focal level of contributions in social dilemma games. This is a very salient threshold and it is easy for groups to coordinate their contributions to reach this threshold. In a second experiment we therefore asked whether the difference between step-level and linear games is robust to different threshold levels.
Second, participants would always lose money by playing more rounds. Since the duration of the experiment was fixed, in the first experiment participants had an incentive to play slowly. In the second experiment we addressed this limitation by calculating their payment with the average number of tokens collected in all rounds, rather than the total number of tokens.
In a second experiment we addressed these limitations and tested whether the high cooperation levels observed in the step-level conditions of the first experiment replicate. We also explored the extent to which the high cooperation level found in the step-level social dilemmas is robust to the specific level of the threshold chosen in the experiment. This explorations provides insight in the mechanisms underlying the high cooperation level.
In the first experiment we found that cooperation started off high but quickly broke down in the step-level asymmetric social dilemmas. That result suggests that perhaps groups can maintain a high cooperation level only if the threshold is easy to coordinate on. In the second study we focus on step-level social dilemmas, and vary whether the individuals in a group are symmetric or not, to test whether the finding that asymmetry over time decreases cooperation in the step-level social dilemma is robust.
Second, we test whether the large difference in cooperation rate between the linear game and the step-level game in Study 1 is caused by the very salient and easy to coordinate threshold that was used. In the second study we use a more complicated threshold that does not allow the participants to use a simple heuristic to decide how much they should cooperate to reach the best outcome. The best outcome for the group occurs when the number of tokens kept is exactly the amount that is required to stay under the threshold. Every additional tokens that is kept incurs only costs for the individual, while it does not help the group. For the individual it is best to keep as few tokens as possible, while still staying under the threshold. With a threshold that cannot be met when all group members keep an equal amount of tokens, some individuals will have to keep more tokens than others. For the individual it is attractive to be the one who keeps least tokens. However, if all group members think in the same way, they will all try to be the group member that keeps least tokens. The consequence may be that groups more often exceed the threshold. Therefore, we hypothesize that:
In a step-level social dilemma, there is less cooperation when groups cannot exactly meet the threshold if all group members cooperate an equal amount.
If the high cooperation level in the symmetric step-level games can only be maintained if all participants know how much they should cooperate to reach the threshold and if this amount is the same for all group members, cooperation should break down when this is not the case. Since both symmetry within groups and an easy to coordinate threshold are necessary conditions for this requirement, we expect that cooperation breaks down if one of these two is lacking. We hypothesize that:
Both symmetry and an easy-to-coordinate threshold are necessary to maintain a high cooperation level. Cooperation breaks down if one of these elements is missing.
The second study was conducted at the same university as Study 1 and the procedure is similar to Study 1. 129 people participated in the experiment in 19 sessions of 6 or 9 participants each. All groups played a step-level game. We used a 2 (symmetric versus asymmetric) by 2 (easy-to-coordinate versus difficult-to-coordinate threshold) between-participants design. The easy-to-coordinate threshold was 45, just as in the first experiment. If the participants together kept 45 tokens or more, they did not have to pay the group threshold cost. In the difficult-to-coordinate condition participants had to pay the group cost if they together kept 43 tokens or less.
The payments were similar to the first study, with the exception that participants got paid according to the average number of tokens earned in the game per round, instead of the total number of tokens, to avoid the incentive to play slowly. On average participants received $12.53.
We analyzed the data in the same way as in Study 1. We first estimated an intercept only model with the fraction of tokens kept as the dependent variable (AIC = −229.0, Deviance = 18.9, df = 509). Adding random intercepts of participants (AIC = −321.5, ΔDeviance = 346.4, p < 0.001) and groups (AIC = −379.2, ΔDeviance = 59.7, p < 0.001) significantly improved the model fit. Adding random intercepts for sessions did not improve the model fit (AIC = −377.2, ΔDeviance = −0.0, p =1.000). In the next step we added the treatment variables (AIC = −373.8, ΔDeviance = −0.6, p = 0.896) and block and all interactions (AIC = −381.6, ΔDeviance = 15.8, p < 0.003). Allowing the slope of block to vary across participants significantly improved the model fit (AIC = −387.5, ΔDeviance = −9.9, p = 0.007). Allowing the slope of block to vary across groups did not improve the model fit (AIC = −386.0, ΔDeviance = −2.5, p = 0.29). The final models with random intercepts for participants and groups and with the treatment variables and block as the independent variables and with random slopes for block for participants are reported in Table 2, model 1 and 2.
We ran a multilevel regression with the fraction of round in which a group managed to stay under the threshold as the dependent variable. Compared to the intercept only model (AIC =131.8, Deviance = 21.1, df = 169), the model with random intercepts for sessions did not have a better fit (AIC = 133.1, ΔDeviance = −106.0, p > 0.999). In the final model we added the variables asymmetry and block number to the model without random intercepts (AIC = 136.1, ΔDeviance = 0.2, p > 0.978). This model is reported in Table 2, model 3.
Table 2: Results cross-classified multilevel regression on fraction of tokens kept: mean and (s.e.).
Figure 3 shows the average number of tokens kept by the participants in the different conditions. The average level of cooperation was similar in the four conditions. In the easy-to-coordinate threshold conditions cooperation seems to decrease slightly over time, while it was more or less stable in the difficult-to-coordinate conditions.
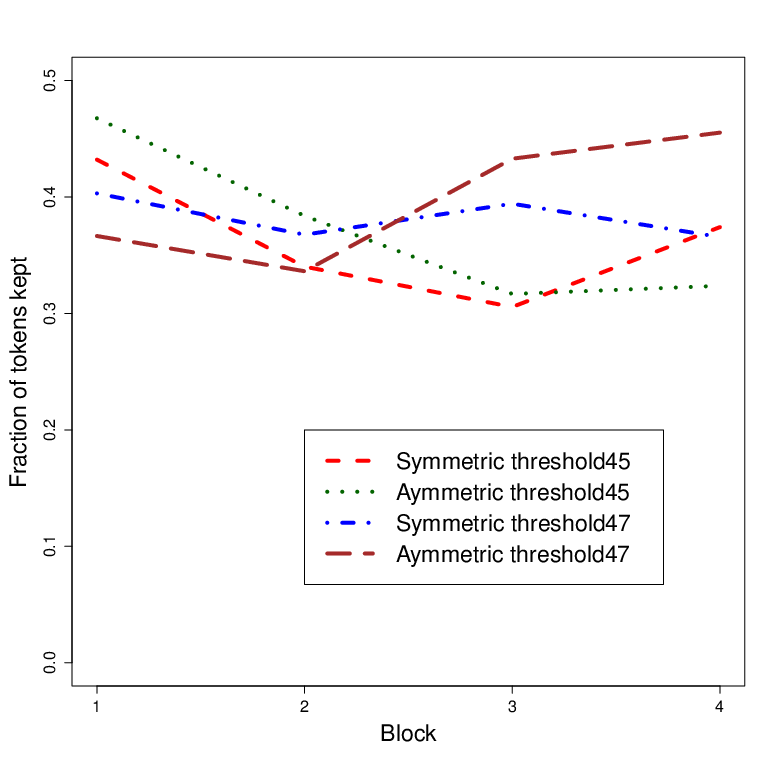
Figure 3: Average fraction of tokens kept across conditions and blocks.
Table 2 contains the results of the regressions. Model 1 shows that there is no difference in the cooperation levels between the four conditions, so we reject hypotheses 3 and 4. Model 2 shows that the fraction of tokens kept does not change over the blocks in both symmetric conditions and the asymmetric dilemma with an easy-to-coordinate threshold. In the asymmetric condition with a difficult-to-coordinate threshold, cooperation increased over the blocks. We do not find evidence for the hypothesis that asymmetry in endowments decreases cooperation in step-level social dilemmas, nor for the hypothesis that cooperation is lower when there is ambiguity with respect to how much each participant should cooperate to exactly reach the threshold. The average level of cooperation was similar to the average level of cooperation in the symmetric step-level social dilemma of Study 1. There was no difference between the conditions in the number of times groups managed to stay under the threshold (model 3).
Using a t-test at the level of the group we compared the cooperation levels in the step-level games of Study 1 with those of Study 2. Overall, cooperation is higher in the step-level games than in the linear games (mean difference = 0.220, t(308) = 9.562, p < 0.001). Cooperation in the step-level symmetric game in Study 1 was similar to the average cooperation level in Study 2 (mean difference = 0.032, t(212) = 1.229, p = 0.221). The average cooperation level in the asymmetric step-level game in Study 1 was lower than the average cooperation level in 2 (mean difference = 0.093, t(200) = −3.024, p = 0.003).
In the second study we found no difference between symmetric and asymmetric step-level social dilemmas. We also found that cooperation does not drop if it is more difficult for group members to decide how much they should cooperate to avoid going over the threshold.
The average cooperation levels in the step-level dilemma in the second study were similar to the cooperation levels in the symmetric step-level games in Study 1.
While many societal problems are framed as linear social dilemmas in research and practice, the relation between cooperation and the outcome is in reality often has a different shape. The aim of this paper is to explore whether groups are better at minimizing collective losses when every small contribution has an equal effect, or when there is there is a collective target that must be reached. In a first laboratory experiment we compared cooperation in linear social dilemmas with step-level social dilemmas. We also investigated whether asymmetry between group members, which is often found to be a complicating factor in solving social dilemmas, has a different effect on cooperation in linear social dilemmas than in step-level social dilemmas. We found that cooperation is higher in the step-level social dilemma, but only when all group members are equal. In a second study we further explored the conditions under which cooperation may be higher in step-level social dilemmas. We varied the level of the threshold to investigate whether cooperation can be high in step-level social dilemmas only when there is no ambiguity in the amount each participant should cooperate to exactly reach the threshold. In the second experiment we found that neither asymmetry in endowments nor an ambiguous threshold decrease cooperation.
Overall, these results suggest that cooperation can be higher in step-level social dilemmas than in linear social dilemmas, and that this difference may be robust to ambiguity with respect to the optimal cooperation level. The difference between the two types of games seems to be caused by a difference in the incentive structures for individuals. While in linear social dilemmas the dominant strategy is to defect, that is not necessarily the case in step-level social dilemmas. In the latter, individuals can under certain conditions increase their personal payoff by cooperating, if their cooperation is necessary to avoid the collective loss, and if costs of the collective loss for the individual are larger than the costs of cooperation. The level of cooperation in the second experiment is comparable to cooperation in the symmetric step-level social dilemma in the first experiment, and much higher than cooperation in the linear social dilemmas of the first experiment.
One question that remains is why cooperation broke down in the asymmetric step-level social dilemma in the first study, but not in the second study. One explanation for the contrasting finding is that the results of the last blocks of the first study in that condition may not be reliable, since only six groups reached the final blocks in that condition.
This research suggests that people are more likely to cooperate in a social dilemma when there is a single target that can be reached only when multiple group members cooperate than when they know that every small contribution has a small benefit to the group, regardless of the overall level of cooperation. Future research should explore the robustness of this difference to other differences in the structure of the social dilemma. One important factor may be the level of the threshold.
When staying under the threshold does not require more cooperation than the average level of cooperation in linear social dilemmas, the step-level structure of the dilemma is not expected to increase cooperation. When groups perceive the level of cooperation that is required to stay under the threshold as too high, they may not be motivated to try to stay under it, because the relative benefits of staying under it are smaller, while the risk that the group still exceeds the threshold is larger. To better understand drivers of cooperation and differences across individuals, future studies could also include more measures on the motivations of individuals to cooperate. Examples of constructs that might affect cooperation are the perceived fairness of different cooperation levels, perceived criticality and the perceived influence on other players.
Overall, this research suggests that groups are better able to maximize group benefits when they face a large, sudden cost rather than small, gradual costs of defection.
Abele, S., Stasser, G., & Chartier, C. (2010). Conflict and coordination in the provision of public goods: A conceptual analysis of continuous and step-level games. Personality and Social Psychology Review, 14(4), 385–401.
Attari, S. Z., Krantz, D. H., & Weber, E. U. (2014). Reasons for cooperation and defection in real-world social dilemmas. Judgment and Decision Making, 9(4), 316–334.
Balliet, D. (2010). Communication and cooperation in social dilemmas: A meta-analytic review. Journal of Conflict Resolution, 54(1), 39–57.
Balliet, D., Li, N. P., Macfarlan, S. J., & Van Vugt, M. (2011). Sex differences in cooperation: a meta-analytic review of social dilemmas. Psychological Bulletin, 137(6), 881-909.
Balliet, D., Parks, C., & Joireman, J. (2009). Social value orientation and cooperation in social dilemmas: A meta-analysis. Group Processes & Intergroup Relations, 12(4), 533–547.
Baron, J. (2008). Thinking and Deciding, 4th ed. Cambridge University Press.
Bchir, M. A., & Willinger, M. (2013). Does a membership fee foster successful public good provision? An experimental investigation of the provision of a step-level collective good. Public Choice, 157(1–2), 25–39.
Biel, A., & Gärling, T. (1995). The role of uncertainty in resource dilemmas. Journal of Environmental Psychology, 15(3), 221–233.
Buchan, N. R., Croson, R. T. A., & Johnson, E. J. (2004). When do fair beliefs influence bargaining behavior? Experimental bargaining in Japan and the United States. Journal of Consumer Research, 31(1), 181–190.
Cooper, D. J., & Stockman, C. K. (2002). Learning to punish: experimental evidence from a sequential step-level public goods game. Experimental Economics, 5(1), 39–51.
Croson, R. T. A., & Marks, M. B. (2000). Step returns in threshold public goods: A meta-and experimental analysis. Experimental Economics, 2(3), 239–259.
Dunlap, R. E., Van Liere, K. D., Mertig, A. G., & Jones, R. E. (2000). New trends in measuring environmental attitudes: measuring endorsement of the new ecological paradigm: a revised NEP scale. Journal of Social Issues, 56(3), 425–442.
Fehr, E., & Gächter, S. (2000). Cooperation and punishment in public goods experiments. American Economic Review, 90(4), 980–994.
Fischbacher, U. (2007). z-Tree: Zurich toolbox for ready-made economic experiments. Experimental Economics, 10(2), 171–178.
Kirby, K. N., Petry, N. M., & Bickel, W. K. (1999). Heroin addicts have higher discount rates for delayed rewards than non-drug-using controls. Journal of Experimental Psychology: General, 128(1), 78–87.
Murphy, R. O., Ackermann, K. A., & Handgraaf, M. (2011). Measuring social value orientation. Judgment and Decision Making, 6(8), 771–781.
Myers, R. A., Rosenberg, A. A., Mace, P. M., Barrowman, N., & Restrepo, V. R. (1994). In search of thresholds for recruitment overfishing. ICES Journal of Marine Science: Journal Du Conseil, 51(2), 191–205.
Rapoport, A., & Suleiman, R. (1993). Incremental contribution in step-level public goods games with asymmetric players. Organizational Behavior and Human Decision Processes, 55(2), 171–194.
Sally, D. (1995). Conversation and Cooperation in Social Dilemmas A Meta-Analysis of Experiments from 1958 to 1992. Rationality and Society, 7(1), 58–92.
Schwartz, L. M., Woloshin, S., Black, W. C., & Welch, H. G. (1997). The role of numeracy in understanding the benefit of screening mammography. Annals of Internal Medicine, 127(11), 966–972.
Simpson, B. (2006). Social identity and cooperation in social dilemmas. Rationality and Society, 18(4), 443–470.
Strathman, A., Gleicher, F., Boninger, D. S., & Edwards, C. S. (1994). The consideration of future consequences: Weighing immediate and distant outcomes of behavior. Journal of Personality and Social Psychology, 66(4), 742–752.
Suleiman, R., & Rapoport, A. (1992). Provision of step-level public goods with continuous contribution. Journal of Behavioral Decision Making, 5(2), 133–153.
van Dijk, E., de Kwaadsteniet, E. W., & De Cremer, D. (2009). Tacit coordination in social dilemmas: the importance of having a common understanding. Journal of Personality and Social Psychology, 96(3), 665–678.
Van Dijk, E., & Grodzka, M. (1992). The influence of endowments asymmetry and information level on the contribution to a public step good. Journal of Economic Psychology, 13(2), 329–342.
Van Dijk, E., & Wilke, H. (1993). Differential interests, equity, and public good provision. Journal of Experimental Social Psychology, 29(1), 1–16.
Van Dijk, E., & Wilke, H. (1995). Coordination rules in asymmetric social dilemmas: A comparison between public good dilemmas and resource dilemmas. Journal of Experimental Social Psychology, 31(1), 1–27.
Van Dijk, E., & Wilke, H. (2000). Decision-induced focusing in social dilemmas: give-some, keep-some, take-some, and leave-some dilemmas. Journal of Personality and Social Psychology, 78(1), 92–104.
Weber, J. M., Kopelman, S., & Messick, D. M. (2004). A conceptual review of decision making in social dilemmas: Applying a logic of appropriateness. Personality and Social Psychology Review, 8(3), 281–307.
Zelmer, J. (2003). Linear public goods experiments: A meta-analysis. Experimental Economics, 6(3), 299–310.
Support for this research was provided by the National Science Foundation, grant SES-0951516 and the Social Sciences and Humanities Research Council of Canada. The authors thank Andrew Lai, Kelly Yang, Yoonji Shim, and Anthony Yam for their assistance in running the experiment.
Copyright: © 2021. The authors license this article under the terms of the Creative Commons Attribution 3.0 License.
This document was translated from LATEX by HEVEA.