Judgment and Decision Making, Vol. 13, No. 1, January 2018, pp. 42-60
Cross-national in-group favoritism in prosocial behavior: Evidence from Latin and North AmericaSusann Fiedler* # Dshamilja Marie Hellmann# # Angela Rachael Dorrough$ Andreas Glöckner$ $ |
As individuals from different nations increasingly interact with
each other, research on national in-group favoritism becomes
particularly vital. In a cross-national, large-scale study (N = 915)
including representative samples from four Latin American nations
(Chile, Peru, Colombia, Venezuela) and the USA, we explore
differences regarding nationality-based in-group
favoritism. In-group favoritism is assessed through differences in
prosocial behavior toward persons from the own nation as compared
to persons from other nations in fully incentivized one-shot
dictator games. We find strong evidence for national in-group
favoritism for the overall sample, but also significant differences
among national subsamples. Latin Americans show more national
in-group favoritism compared to US Americans (interacting with Latin
Americans). While US Americans mainly follow an equal split norm
(for both in- and out-group interactions), Latin Americans do so
only in in-group interactions. The magnitude of in-group favoritism
increases with social distance toward the out-group.
Keywords: in-group favoritism, prosociality, social distance, cross-cultural differences, Latin America
1 Introduction
Within the scope of globalization and international migration, the
perception of national borders is shifting and individuals
increasingly interact with people of different
nationalities. Consequently, understanding the behavior of individuals
toward members of national in- and out-groups becomes more and more
important. Up to this point, relatively little is known concerning the
determinants of cross-cultural in-group favoritism and potential
differences among nations; most laboratory studies are conducted
within single nations. We investigate the magnitude of in-group
favoritism in prosocial behavior in a fully incentivized,
cross-national context, including national samples from four Latin
American nations (Chile, Peru, Colombia, and Venezuela) and the USA (N
= 915) that are representative for the respective nation in terms of
age and sex.
In-group favoritism represents a well-established and often replicated
phenomenon in social psychology and behavioral economics (see Balliet,
Wu & De Dreu, 2014 for a recent meta-analysis on this topic) and has
been investigated in a wide range of behaviors and scenarios:
Individuals ascribe more positive characteristics to in- than
out-group members (Mullen, Brown & Smith, 1992), tend to make more
internal (external) attributions for positive in-group (out-group)
behavior (Pettigrew, 1979; Popan, Kenworthy, Barden & Griffiths,
2010), and are more motivated to accomplish in-group goals at work
(Ellemers, De Gilder & Haslam, 2004). Particularly in the context of
prosocial behavior and cooperative decision-making, it has been
repeatedly demonstrated that individuals consistently favor their
in-group: People show more helping behavior toward in- rather than
toward out-group members in violent situations (M. Levine, Cassidy,
Brazier & Reicher, 2002) or after natural disasters (M. Levine &
Thompson, 2004; Cuddy, Rock & Norton, 2007; Kogut & Ritov, 2007)
and are more willing to accept personal costs to benefit in- compared
to out-group members in social dilemma tasks (Balliet et al., 2014;
Goette, Huffman & Meier, 2006; Simpson, 2006; Bornstein &
Ben-Yossef, 1994). In-group membership of an interaction partner
appears to increase prosocial behavior even in young children (Fehr,
Bernhard & Rockenbach, 2008) and non-human species (e.g., De Waal,
Leimgruber & Greenberg, 2008). The most prominent theoretical
approach to the phenomenon of in-group favoritism is social identity
theory. Within this approach, it is assumed that the motivating
principle underlying in-group favoritism is the need to attain and
preserve a positive self-concept by maximizing the positive
distinctiveness of the in-group in contrast to an out-group (Tajfel &
Turner, 1979; Hewstone, Rubin & Willis, 2002). One way to achieve
this distinctiveness is to show behavior that positively
differentiates the in-group from the out-group (i.e., in-group favoring
behavior) (Balliet et al., 2014).
In-group bias can be positive or detrimental for human interaction. On
the one hand, such positive bias toward in-group members can help
the in-group by increasing its cohesion, performance, and
the individual fitness of its members (Darwin, 1874). On the other
hand, however, such intergroup biases can bear the risk of intense
feelings of deprivation and resentment in out-groups, leading to
intergroup discrimination and hostility between groups (Sherif &
Sherif, 1953). In sum, in-group bias seems to be a combination of
“in-group love” and “out-group hate” with the first being of primary
importance (e.g., Halevy, Weisel & Bornstein, 2012). In the
cross-national context, intergroup bias may have far-reaching
consequences, such as the systematic segregation of minorities or the
emergence of nationalistic tendencies. These violent outcomes are
especially dangerous in times of massive migration, because they may
reduce openness to individuals from other nations and thus prevent
successful integration.
Individuals from different nations vary in many respects, one of which
is the degree of prosocial behavior they display (Cnaan et al., 2012;
R. V. Levine, Norenzayan & Philbrick, 2001; Luria, Cnaan & Boehm,
2014). In light of these findings, it is not surprising that
individuals from different nations also show varying baseline levels
of in-group favoritism in survey questions (Van de Vliert,
2010). Nations appear to differ in the extent to which they show more
prosocial behavior toward national in-group members than to out-group
members; some nations seem to display reduced national in-group
favoritism or none at all (Liu et al., 2011; Fershtman, Gneezy & Verboven,
2005; Castro, 2008; Tanaka & Camerer, 2013; Dorrough & Glöckner,
2016; for a meta-analysis see R. Fischer & Derham, 2016).
The present study further investigates national in-group favoritism in
prosocial behavior. We explore (research question [RQ] 1) whether
effects of in-group favoritism generalize to a cross-national context
and non-student samples in a fully incentivized task (for a discussion
of problems using student samples only, see Falk, Meier & Zehnder,
2013; Henrich, Heine & Norenzayan, 2010). Our core dependent variable
is the degree of preferring persons from the own nation over persons
from other nations if nothing but the nationality is mutually known,
which we refer to as national in-group favoritism. Specifically, we
use representative samples of five nations and a dictator game (DG),
in which people can give shares of their own money to anonymous other
people (see Engel, 2011 for a meta-study on behavior in
DGs). Furthermore, we explore differences concerning national in-group
favoritism among nations (RQ2) and analyze factors that determine
the degree of national in-group favoritism (RQ3). We focus on two sets
of factors to explain observable behavior: (1) interaction
characteristics, in particular perceived social distance between
interaction partners (RQ3a), cultural distance between nations (RQ3b),
and context of the interaction that might activate a shared common
in-group (RQ3c), as well as (2) individual characteristics such as
social preferences (RQ3d), as well as age, sex, education and income as
possible contaminating (control) factors.
1.1 Theoretical predictions and previous findings concerning our research questions
1.1.1 Social and cultural distance
In the context of national in-group favoritism, an important
characteristic of the interactions is the relation between individual
interaction partners and that between nations. Based on previous
research, prosocial behavior can be expected to increase if the social
distance between interaction partners is reduced so that people feel
closer to each other (Hoffman, McCabe & Smith, 1996; Weisel & Böhm,
2015). There is evidence that at the same degree of social distance,
subjects behave significantly more prosocially toward relatives
(in-group) than toward non-relatives (out-group) suggesting that
prosocial behavior is determined by group membership in addition to
social distance (Rachlin & Jones, 2008). In the present study we
investigated whether national in-group favoritism goes beyond effects
that are conveyed by perceived social distance only, and whether the
effect of social distance on behavior varies between in-group and
out-group situations (RQ3a). Building on the finding that cultural
(dis)similarity influences individuals’ helping intentions and
behavior (Siem & Stürmer, 2012), we additionally investigated the
effect of cultural distance between nations on prosocial behavior
(RQ3b). Therefore we calculated a cultural distance index based on the
nation’s scores on the Hofstede’s cultural dimensions: individualism,
power distance, masculinity, uncertainty avoidance,
long-term orientation, and indulgence (Hofstede, Hofstede & Minkov,
2010).
1.1.2 Activation of a common superordinate identity
As a further potentially important characteristic of the interaction,
we investigated the specific group context, which could trigger
multiple (one or more) national identities. According to the Common
In-group Identity Model (Gaertner & Dovidio, 2000), intergroup bias
can be reduced if individuals are induced to perceive themselves no
longer as members of separate groups, but as members of one common,
more inclusive superordinate group. We assume that a common
supranational in-group identity can become salient in interactions
with national out-groups that share some common characteristics with
the in-group, if another nation is included that does not share this
characteristic. To be able to test this assumption, we aimed to select
a set of nations that included on the one hand culturally similar
nations and on the other hand a very dissimilar nation whose mere
presence should draw attention to the cultural similarity of the
former. To this end, we investigated interactions among subjects
from four Latin American countries (Chile, Peru, Colombia, and
Venezuela) that have many cultural characteristics in common (e.g.,
language, long colonial history) and furthermore also share a common
supranational Latin in-group identity. Additionally we included
subjects from the USA, a nation which is culturally different from
Latin American nations in many respects. Specifically, we varied the
context of the interactions by including versus excluding the USA in
the presented set of national out-groups in that Latin Americans
either interacted with an US out-group member or not. Based on the
Common In-group Identity Model (Gaertner & Dovidio, 2000) and the
finding that similarity increases cooperation in individuals
(I. Fischer, 2009; Mussweiler & Ockenfels, 2013), we assumed that
Latin Americans will feel closer – i.e., more culturally similar –
toward Latin American out-groups when the USA is present in the set
of national out-groups. In turn, this should result in a decrease of
in-group favoritism in interactions with Latin American out-group
members (RQ3c).
1.1.3 Social Value Orientation
With respect to individual characteristics, we considered social
preferences measured as social value orientation – the tendency to
engage in behavior that is beneficial to others, even though it is
costly for the self (Murphy & Ackermann, 2014; Liebrand &
McClintock, 1988) – as a potential predictor for the extent of national
in-group favoritism (RQ3d). Social preferences have been shown to be a
valid predictor for prosocial behavior in general (Balliet, Parks &
Joireman, 2009; but see Renkewitz, Fuchs & Fiedler, 2011 for a
potential publication bias) and exhibit substantial variations in
their global distribution across nations (Becker et al., 2015). Prior
research that investigated the link between individuals’ social
preferences and in-group favoritism revealed inconsistent
results. Past studies report that social preferences affect in-group
favoritism with prosocial individuals displaying stronger in-group
favoritism than proselfs (e.g., De Dreu, 2010; De Dreu, Dussel &
Velden, 2015). However, a recent study does not support the influence
of social preferences on in-group favoritism but only on prosocial
behavior in general, irrespective of the interaction partner’s group
membership (Thielmann & Böhm, 2016). Given this mixed empirical
evidence, we will test the relationship between social preferences and
in-group favoritism in a cross-cultural context. Besides social
preferences, we assess socio-demographic (i.e., age, sex, education)
and socio-economic variables (i.e., income) as well as personal
contact with people from the respective national out-groups.
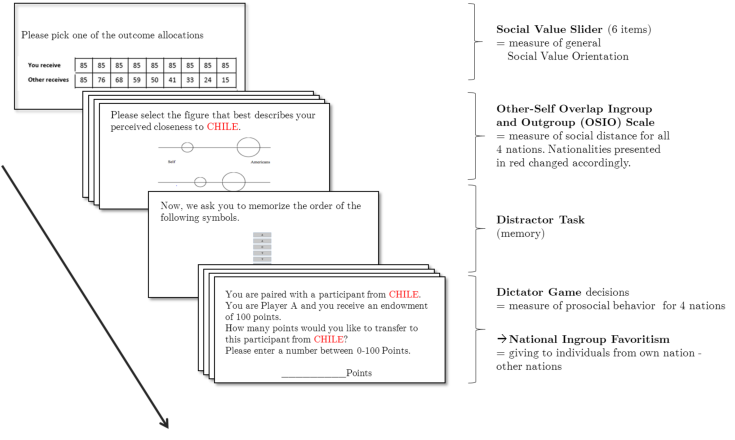
| Figure 1: Experimental Procedure. Between-subjects manipulation for
subjects outside US: (I) own nation + 3 Latin American countries
vs. (II) own nation + 2 Latin American countries + US. OSIO
questionnaire and Dictator Game were counterbalanced within the
experiment. Nationality of the interaction partner that was
manipulated in this study is highlighted in red for demonstrative
purposes only; no such highlighting was used in the actual
experiment. |
2 Methods
To address RQ3c we needed a group of similar countries with a
superordinate common identity and one rather dissimilar nation, which
was supposed to make the common identity of the similar countries
salient. As explained in the introduction of our article, the
selection of four Latin American and one US American samples fits this
demand. We based our selection of the specific Latin American
countries on the availability from the panel provider Toluna that
realized the recruitment of subjects. The sample size was
determined before data collection and was based on sample availability
and monetary resources. Further data, analysis scripts and materials
(e.g., instructions for all national subsamples) are available at:
osf.io/76bzq.
2.1 Subjects and Design
915 subjects (49% female; 18–84 years of age, M =
40.47) from five different nations took part in the experiment. The
set of nations included four Latin American countries, namely Chile
(N = 201), Peru (N = 202), Colombia (N =
207), and Venezuela (N = 206), as well as the USA (N
= 99). Socio-demographic and socio-economic information for each
national subsample are provided in Appendix, Table
A1. Subjects were recruited via the professional online panel
provider Toluna (http://www.toluna-group.com/de) and
were population representative according to age and sex for the
respective countries. Age filtering was based on four age categories
(i.e., 18–24; 25–39; 40–54; 55–99). Subjects who failed to
comply with the criteria concerning nationality or the nation specific
age and sex criteria were excluded from further participation.
The experiment was based on a non-fully crossed 5 (nationality of
dictator) x 5 (nationality of receiver) mixed within-between subjects
design. The nationality of the dictator constituted our first
quasi-experimental between-subjects factor. The nationality of the
receiver was manipulated within subjects, but each individual was
paired with four persons only (i.e., one person from the own nation
and three persons from other nations). For the subjects from Latin
America, the within-subjects factor of receiver nations also
included the manipulation whether the three other persons were all
from Latin America or also included a person from the USA, which we
expected to activate the common in-group for Latin Americans. US
subjects interacted with a national in-group member and persons
from three (out of four) Latin American out-group nations in randomized
order.
It took subjects about 15 minutes to complete the experiment and
payments were contingent on behavior ranging from USD 1.75 to 2.90
(average USD 2.47). This comprised a base payment of USD 1.75, plus an
incentivized bonus payment of USD 0 to 1.16. The subjects’ payment
was neutrally framed as points using a conversion rate of 1 point
≈ USD 0.01, so that subjects from all national
subsamples faced identical calculation problems when making their
decisions.
2.2 Materials
The core dependent measure national in-group favoritism concerning
prosocial behavior was assessed using a dictator game (DG), and the
predictors social preferences and social distance were measured using
the Social Value Slider (SVS) measure (Murphy, Ackermann & Handgraaf,
2011) and the Overlap of Self-In-group (OSI) and Overlap of
Self-Out-group (OSO) Scales (Aron, Aron & Smollan, 1992),
respectively. The within-subjects manipulations of the receiver nation
were realized by playing the DG with a person from four different
nations (including the own nation), from which only the nationality
was known. OSO was assessed for all three other nations, whereas
group-independent social value orientation and OSI were assessed only
once. The overall procedure including the individual materials is
depicted in Figure 1. Cultural distance was not directly assessed in
the experiment, but calculated from previous work as the Euclidean
distance between nations based on the six-dimensional model by
Hofstede et al. (2010).
2.2.1 Dictator Game (DG)
In the dictator game, subjects received an initial endowment of 100
points (≈ USD 1), from which they could give the respective receiver any
amount in steps of 1 point (including 0 points). Subjects were
informed that either one randomly selected decision made by themselves
as the dictator or a decision made by another subject for them as the
receiver could be relevant for their payment. After reading the
instructions, but before starting the task, subjects had to answer
four comprehension questions concerning the structure of the task. For
each of these questions, subjects had three attempts to give a correct
response. Subjects who failed to answer any of these questions were
screened out and excluded from further participation.
2.2.2 The Overlap of Self-In-group and Self-Out-group Scale
As a subjective measure of social distance, we used the Overlap of
Self-In-group (OSI) and the Overlap of Self-Out-group (OSO) Scales,
which are often employed in research on intergroup relations (Aron et
al., 1992). For each national out-group member subjects were paired
with, they had to indicate the degree of perceived social distance. As
an illustration of social distance, subjects were presented with seven
pictures of two increasingly overlapping circles: one representing
themselves, and the other representing the respective
national group. Subjects were asked to select the figure that best
described their perceived distance to national in- (OSI) and out-group
members (OSO). Both scales are usually coded as closeness scores, but
for the purpose of enhancing comparison to the cultural distance
measure of Hofstede we calculated a social distance measure by
reversing the coding. More specifically, as one of our main predictors
of in-group favoritism, we calculated the difference in perceived
social distance toward in- and out-group members. Higher positive
values indicate higher social distance between in- and out-group.
2.2.3 Social Value Slider (SVS)
The Social Value Slider measure (Murphy et al., 2011) constitutes a
standard measure for social preferences, consisting of six decomposed
dictator games. For each of the six tasks, subjects had to choose
between nine possible self-other payoff combinations. From these six
items an angle can be computed reflecting a person’s Social Value
orientation. Subjects knew that one of these decisions could be
relevant for their bonus payments, according to a randomly drawn
decision they made themselves or which was made by one of the subjects
with whom they were matched.
2.3 Procedure
The overall procedure is depicted in Figure 1. The study started with
the SVS measure. Subsequently, subjects were informed that they would
interact with individuals from four nations, who were anonymously drawn
from national samples being representative for the respective nation
in terms of age and sex. Prosocial behavior was assessed using the DG
by indicating the willingness to share money with randomly selected
individuals from the four nations and social distance using OSI and OSO
(the latter for three nations). Subjects were first paired with a
randomly selected fellow countryman (national in-group), and the
nationality of the further partners was randomly selected from the
other nations (national out-groups) while not encountering nations
twice. On this random assignment we imposed the restrictions that, for
dictators from Latin America, receivers from the USA were included in
exactly half of the cases (which explains the reduced number of US
subjects) and were always included as second (out of three) out-group
partners. Thus, we could investigate the effect of having a more
homogeneous (i.e., Latin American nations only) vs. a more
heterogeneous out-group by including a very different nation. The same
ordering of nations as in the DG was applied for OSI and OSO. The
order of both measures was counterbalanced, and a distractor task was
included in between to avoid spillover effects. The distractor
consisted of a simple learning task, in which subjects had to memorize
the order of three varying symbols and subsequently place them in the
order learned before.
We told subjects in advance that the bonus payment would be yielded by
one randomly selected decision during the experiment (one item of the
SVS measure or one of the four decisions made in the DG), either made
by the subjects themselves (active role) or by another subject they
were paired with (passive role). At the end of the study, the points
accumulated were converted into the respective local currency and
transferred to the subjects’ account. The nationality of the
interaction partner was the only information that was provided so that
anonymity was preserved and no conclusions about the identity of the
subjects could be drawn. Furthermore, knowledge was symmetric, in that
both partners were informed about the other’s nationality. All
instructions were provided in the respective national languages to
avoid a foreign-language effect on choice behavior (Costa, Foucart,
Arnon, Aparici & Apesteguia, 2014). The English version was
translated into Spanish by native speakers, and the quality of the
translation was assured through a back-translation procedure (Brislin,
1970) into English by a professional on-line translation service
(http://www.onehourtranslation.com).
To assess the degree of personal contact with people from the
respective national out-groups, subjects answered four contact
questions at the end of the study, namely whether they traveled
frequently, had ever worked, had ever lived in the respective
out-group nations, or whether they had family or close friends from
these nations.
Cultural values were retrieved for the nations included according to
Hofstede dimensions (Hofstede et al., 2010). From these values,
cultural distance scores were calculated based on the Euclidian
distance between nations, as described in the Appendix (where Table A2
shows the respective cultural values of all relevant nations).
3 Results
3.1 National in-group favoritism
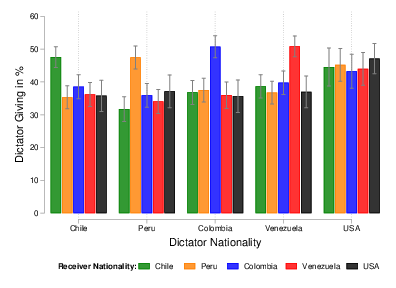
We find strong evidence for national in-group favoritism for the
overall sample, in that subjects gave on average about 11.68 points more to
national in-groups than to national out-groups (RQ1; t(1828) = 10.78, p
< .001). We observe
clear patterns of in-group favoritism for dictators from Chile, Peru,
Colombia, and Venezuela, and reduced in-group favoritism for dictators
from the USA (Figure 2).
| Figure 2: Dictator Game giving (as percentages) for all nation combinations of dictators and receivers. The x-axis depicts the dictator nationality, whereas the bar colors represent the receiver nationality. Error bars represent 95% confidence intervals. |
| Table 1: Uni- and multivariate analyses for the predictors of in-group favoritism (excluding US-sample). |
| | Univariate without controls | | Univariate with controls | | Full model |
Predictors | | | | | | | | | | | |
Social distancea | 1.59*** (6.04) | | | | | 1.53*** (5.60) | | | | | 1.64*** (5.97) |
Hofstede cultural distanceb | | −0.39 (−1.55) | | | | | −0.56* (−2.15) | | | | −0.76** (−3.01) |
Social Value Orientation | | | −0.06 (−1.03) | | | | | −0.06 (−0.97) | | | −0.08 (−1.46) |
Only Latin out-groups | | | | −0.89 (−0.57) | | | | | −0.96 (−0.62) | | −0.82 (−0.53) |
| Control factors | | | | | | | | | | |
Dictator nation | NO | NO | NO | NO | | YES | YES | YES | YES | | YES |
Receiver nation | NO | NO | NO | NO | | YES | YES | YES | YES | | YES |
Demographic controls (income, age, sex, education) | NO | NO | NO | NO | | YES | YES | YES | YES | | YES |
Constant | 11.73*** (14.98) | 13.06*** (16.81) | 12.92*** (16.76) | 12.95*** (16.72) | | 11.02*** (6.56) | 12.64*** (7.51) | 12.16*** (7.25) | 12.30*** (7.32) | | 11.46*** (6.80) |
N | 2078 | 2081 | 2081 | 2081 | | 2078 | 2081 | 2081 | 2081 | | 2078 |
| Note: z statistics in parentheses;
*** p < .001, ** p < .01, * p < .05. All analyses are mixed effects regressions with random slopes and random intercepts for all variables listed under predictors. |
| a Social distance is calculated as the difference in indicated social distance between in- and out-group members, all predictors and demographic controls are mean centered, nation controls are included as dummy variables. |
| b A standard method to compute cultural distance based on Hofstede’s model is the Euclidean distance variant of Kogut and Singh (1988). Cultural distance (CD) is thereby defined through a mathematical formula, where Ikj is country j’s score on the kth cultural dimension, Iki is the score of country i on this dimension, and Vk is the variance of the score of the dimension:
|
3.2 Differences in national in-group favoritism between
nations
To explore potential differences in the extent of in-group favoritism
between the different nations (RQ2), we compared in-group favoritism
between the national subsamples. We find highly significant
(p < .001) in-group favoritism for all four Latin American
nations — Chile (11.0 points), Peru (13.1 points), Colombia (14.1 points), and
Venezuela (12.7 points) — but only a small effect for the USA (2.8 points,
p = .032). Post-hoc contrasts between all nations show that
the extent of in-group favoritism differs significantly between the
USA and the four Latin American nations (all four p´s
< .03, Bonferroni-corrected for 10 tests). The Latin
American nations did not differ significantly from each other.
3.3 Predictors for the magnitude of national in-group favoritism
To test our research questions RQ3a-d, we analyzed differences
concerning in-group favoritism in detail. Specifically, we
investigated how the magnitude of national in-group favoritism is
affected by perceived social distance to the national out-group (RQ3a),
cultural distance to the national out-group (RQ3b), activation of a
common identity by including another out-group (i.e., person from the
US included vs. not included) (RQ3c), and social value orientation
(RQ3d). We used in-group favoritism scores as our core
dependent measures, which were calculated as the difference between DG
giving to the in-group minus DG giving to the out-group. For each
subject, three scores were calculated, since each of them interacted
with three persons from national out-groups and one from the
in-group. Higher scores indicate larger in-group favoritism and a
value of zero indicated no in-group favoritism at all. Note, that
comparing effects of further factors on this dependent variable
naturally excludes the simple in-group/out-group bias between persons
from the own vs. other nation (captured by the variables’ average /
the constant). It therefore allows to distinctively investigate the
influence of further factors on national in-group favoritism that goes
beyond this dichotomy.
The results from univariate and multivariate (Table 1) regression
analyses of the relation between the above mentioned predictors
(RQ3a-d) and national in-group favoritism provide consistent results
and analyses including also the US American sample are provided in the
Appendix (Table A3). Both sets of analyses are thereby based on
hierarchical linear regression models including random intercepts to
account for differences between subjects and random slopes for the
relevant predictors (i.e., Social Distance, Cultural Distance and
Social Value Orientation). As a robustness check, analyses are
conducted both including and excluding US subjects, since they might
be considered qualitatively different from the Latin American
subjects, as also indicated by the analysis on RQ2 reported in the
previous section. In the multiple regression presented in Table 1, our
core dependent variable is the in-group favoritism score, and all
coefficients for predictor variables are presented in the table. The
regression included dictator and receiver nationality (fixed effects)
as controls. Correlations between the predictors and control variables
were generally low (Appendix Table A6) and the coefficients of the
main predictors were essentially the same with and without inclusion
of the demographic controls. In addition, none of the demographic
variables was significantly correlated with in-group favoritism in tests across subjects. The highest correlation was .056 for education (coded numerically, p = .090), but education did not correlate with the main predictors at all.
In the multivariate analyses (Tables 1 & A3, full model;
Table A4) in-group favoritism scores were regressed
on the nationality of the dictator and the receiver, social distance to
the receiver (as a difference of social distance between in- and
out-group), the Hofstede cultural distance between the interacting
nationalities, social value orientation (SVSangle) as
well as the presence of the US as one of the out-groups (i.e., Only Latin out-groups).
Consistent over all analyses, social distance to the national out-group is a
strong predictor for the magnitude of national in-group favoritism
(RQ3a). Simply put, the more distant I feel toward an out-group
compared to an in-group member, the more I favor the in-group over the
out-group member. Note, that this effect is found in an analysis that
excluded the trivial effect that the in-group is generally perceived
to be socially closer than the out-group. This is simply due to the
fact that the comparison in this analysis is between different
out-groups only. Hence, the effect of social distance on the magnitude
of national in-group favoritism goes beyond the mere dichotomous
difference between own country vs. not. Further analyses revealed
that the extent of perceived social distance to the out-group (i.e., OSIO Out-group) was linked to
self-reported contact, β = −0.82, z =
−13.50, p <.001 (see Appendix Table A5,
columns 3 & 4; here and in the following β refers to unstandardized coefficients). Social distance decreased with increasing contact (or vice
versa).
| Table 2: Multivariate analyses for the predictors of DG giving in in-group and out-group interactions both including/excluding subjects from the US. |
| | In-group | | Out-groupb |
| without US | with US | | without US | with US |
Predictors | | | | |
Social distancea | 0.72 (1.38) | 0.71 (1.49) | | −1.55*** (−5.57) | −1.86*** (−7.55) |
Hofstede cultural distance | | | | 0.71** (2.85) | 0.71** (2.99) |
Social Value Orientation | 0.24*** (4.18) | 0.28*** (5.17) | | 0.36*** (5.90) | 0.43*** (7.40) |
Only Latin out-groups | −2.73 (−1.64) | | | −1.26 (−0.82) | |
| Control factors | | | |
Dictator nation | NO | NO | | YES | YES |
Receiver nation | NO | NO | | YES | YES |
Demographics (income, age, sex, education) | YES | YES | | YES | YES |
Constant | 47.73*** (32.51) | 47.39*** (36.18) | | 36.59*** (21.69) | 37.22*** (22.93) |
N | 816 | 915 | | 2078 | 2741 |
| Note: z statistics in parentheses;
*** p < .001, ** p < .01. |
| a Social distance is calculated as the difference in indicated social distance between in- and out-group members, all predictors and demographic controls are mean centered. |
| b Mixed effects regression with random slopes and random intercepts for all variables listed under predictors.
|
Furthermore, the magnitude of national in-group favoritism decreases
with increasing cultural distance between in-group and out-group
(RQ3b). Hence, when comparing behavior toward various out-groups,
more culturally similar out-groups to my own culture receive even less
than less similar ones. The effect, however, is weaker than that
of social distance and is not significant in one of the univariate
analysis (i.e., excluding US subjects, see Table 1, column 2). Note,
however, that cultural distance is derived from scores based on
earlier studies and thus may not reflect so accurately how such
distance is perceived by our subjects.
Against our predictions, having an encounter with an US American
out-group member (vs. only interacting with Latin American out-groups)
did not reduce in-group favoritism toward other Latin American
countries (RQ3c). To understand this unexpected result better, we
analyzed whether the presence of a US out-group decreases social
distance between individuals from different Latin American countries,
by activating a supranational Latin American in-group as
intended. Results reveal that Latin Americans did not feel closer
toward Latin American out-group partners in the presence of a US
American out-group, β = 0.11, z = 0.90,
p = .37 (see Appendix Table A5, column 3), which would be required for an effect on in-group
favoritism to emerge.
Finally, results concerning the effect of social value orientation on
national in-group favoritism differ between the analyses including
only the Latin American sample (Table 1) vs. the full study population including
the US subjects (see Appendix Table A3 and A4) and they are even weaker in the univariate analyses
(see Appendix Table A3). Generally, the magnitude of in-group favoritism tends
to decrease with increasing social value orientation. People who are
more prosocial give more to the out-group, thus reducing the gap.
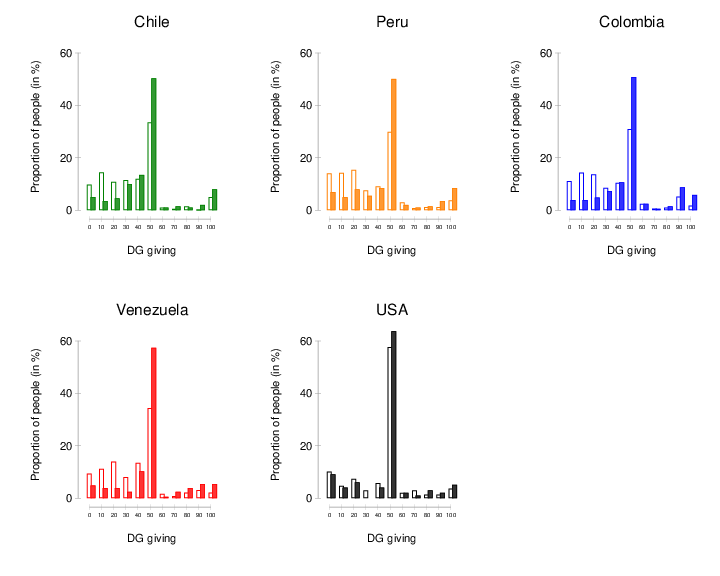
| Figure 3: Histograms showing distributions of dictator-game giving
(as percentages) for each national subsample in in-group
(filled-colored bars) and out-group (white bars) interactions. The
x-axis is the amount given (100 points maximum). |
3.4 Further analyses
To investigate the determinants for differences in in-group favoritism
in more detail, we analyzed national differences in DG giving to the
in- and out-group separately. Results show that the differences in
in-group favoritism are mainly driven by DG giving in interactions
with the out-group (see Figure 2 & Table A4, column 3–6).
Specifically, dictators from the USA gave relatively more to out-group
members, as compared to dictators from Latin American nations (see
Figure 2). There were no such nation-specific differences in DG giving
in in-group interactions. Figure 3 shows the distributions of DG
giving to in-group (colored bars) and out-group (white bars) members
split by dictator nation. When interacting with in-group members, the
relative majority of dictators (ranging from 49–63%, depending on
the dictator nation) chose an equal split. For dictators from the USA,
only a 6% decrease of this equal split rate is observed when facing
members of the out-group. However, this drop is much more pronounced
(18–21%) for all Latin American countries, and this drop seems to be
the driving factor for the observed differences in in-group
favoritism.
Finally, we investigated the predictive value of Social Value
Orientation, social and cultural distance on the extent of giving
behavior in the DG. As shown in Table 2, and as repeatedly shown in
previous research, social preference is a clear predictor for DG
giving behavior in in-group as well as out-group interactions. An
ideal individualist (SVSangle = 0°) contributed on
average 12.6% less in in-group and 16.6% less in out-group
interactions than an ideal cooperator (SVSangle =
45°). Remarkably, the coefficient of SVSangle for
giving behavior in the DG was between 2.6 to 4.6 times higher in the
US sample compared to the individual Latin American samples. A
multilevel linear random effects regression with random intercepts and
slopes for SVSangle as well as its interaction with
dictator country (Latin vs. USA) supports this finding, ß =
−0.62, z = −3.86, p = <.001, for the
interaction (not corrected for other interactions that might have been
examined).
Social distance (measured as differences in distance to the
in-group − out-group) predicts DG giving negatively in the out-group,
indicating that people give less to out-groups that are perceived as
more socially distant. No significant effect of social distance is
found for the in-group. Cultural distance has positive predictive
value for DG giving in out-group situations in such a way that the
tendency for being prosocial (i.e., giving money) increases with
cultural distance.
4 Discussion
In a cross-national study including population representative samples
according to age and sex from four Latin American nations and the USA,
we investigated in-group favoritism in a cross-national
context. Overall, we observed a substantial amount of national
in-group favoritism, in that subjects showed significantly more
prosocial behavior toward national in-group compared to national
out-group members. When analyzing each national subsample separately,
we observed strong in-group favoritism in all Latin American
subsamples, as well as (although to a lesser extent) in the US
American subsample. Hence, the classic phenomenon of in-group
favoritism is also found for prosocial behavior in the context of
cross-cultural interactions involving real incentives and non-student
populations. This result is particularly noteworthy, since the general
level of prosocial behavior shown by our subjects was somewhat higher
than the level shown by students in standard lab studies. For
instance, the equal-split proportions toward both in- and out-groups
for all nations (see Figure 3) were well above the average rate of
17% reported in a recent comprehensive meta-analysis (Engel, 2011).
Additional exploratory analyses regarding potential national
differences revealed strong heterogeneity concerning the magnitude of
in-group favoritism in prosocial behavior between nations. We observed
that in-group favoritism was strongly reduced in the US American
subsample, which could be potentially explained by diverging social
norms within the different nations (for cultural variation in social
norms, see Morris, Hong, Chiu & Liu, 2015; Roos, Gelfand, Nau & Lun,
2015). Latin American subjects followed an equal-split norm strongly
in in-group interactions and did so less when interacting with
out-group members. In contrast, US Americans followed the same norm in
both in- and out-group interactions.
There are several potential explanations for the reduction in in-group
favoritism for the US, compared to the Latin American samples. This
difference could be due to the imbalance of group status between Latin
and US Americans, with the latter possibly not wanting to take
advantage of their superior position. In our selection of subsamples,
Latin Americans represented economically lower status groups, compared
to US Americans (e.g., in terms of purchasing power or gross domestic
product). The possible role of economic status is particularly
relevant, since research suggests that cultural differences often also
reflect differences on socio-economic factors (Vignoles et al.,
2016). Our results are in line with the finding that high status
groups decide more equitably and consequently show a lower degree of
in-group favoritism when interacting with members of low status groups
(Tanaka & Camerer, 2013). These results are also in line with the
idea of inequality aversion, in that individuals care for an
egalitarian distribution of resources (Fehr & Schmidt, 1999) and the
concept of sympathy for the poor (Piston, 2014). Recent evidence
indicates that richer nations show more prosocial behavior toward
nations that are worse off financially (Dorrough & Glöckner,
2016). Additionally, as the USA also have a higher globalization index
than Latin American nations (Lockwood & Redoano, 2005), the result
fits findings showing that higher country-level globalization is
linked to an increase in cooperation toward national out-groups
(Buchan et al., 2009). In relation to these explanations, it must be
pointed out, however, that we only examined one single high-status or
strongly globalized nation. A larger plurality of respective nations
is needed in further investigations.
Furthermore, we identified several driving factors for national
in-group favoritism. With regard to interaction characteristics, the
social distance between individuals and the Hofstede cultural distance
between nations turned out to be predictive for the degree of in-group
favoritism. In line with common sense intuition and previous findings
(e.g., Hoffman et al., 1996), out-group members that are perceived as
socially close were treated in a similar fashion to in-group members,
which in turn led to a decrease in the extent of in-group
favoritism. Still, interacting with an in- as compared to an out-group
member had additional predictive value beyond perceived social
distance as we measured it. We can, however, not preclude that our measure, although being well established in the field, may have missed, or measured
with substantial error, relevant aspects of social distance
as a general concept.
Concerning cultural distance, we found that, contrary to previous
results (Siem & Stürmer, 2012) and some evolutionary-based arguments
(Alexander, 1974), the extent of in-group favoritism decreased with
increasing cultural distance. However, this result is in line with the
finding that the stronger the rivalry between groups, the more people
choose to avoid helping the out-group (Weisel & Böhm, 2015) as well
as a prediction derived from Social Identity Theory. According to this
theory, groups have a motivation to differentiate their in-group
positively from a particularly similar out-group, resulting in an
increase in in-group favoritism (Brown,1984). For the Latin American
nations included in our study, this might be caused by a competition
for shared (natural) resources or for the true origin of cultural
commonalities (e.g., the long-standing battle whether Peru or Chile
may claim Pisco as their national drink) between neighboring
nations. However, future research should investigate this relationship
with a larger sample of nations. Furthermore, in addition to the
Hofstede values which are often criticized for their lack of validity
(e.g., Schmitz & Weber, 2014) one could add an assessment of
perceived cultural distance as a more subjective measure (see e.g.,
Demes & Geeraert, 2014).
Considering the group context as an additional interaction
characteristic, we would have expected that the presence of a
dissimilar country (USA) would activate the superordinate identity of
being Latino leading to less perceived social distance and in-group
favoritism between Latin American countries. The analysis showed that
the manipulation (presence of an US American out-group vs. Latin
American out-groups only) was not strong enough to influence the
perceived social distance among Latin American out-groups and
consequently had no effect on the extent of in-group favoritism.
For future research it would thus be particularly important to make
the common supranational identity more salient (e.g., by focusing on
common Latin American characteristics) and measure the degree of
common supranational identity (e.g., by asking subjects to what degree
they identify with Latin America). Curtis (2014), for example,
specifically asked subjects to rate the degree they identify with
Europe vs. their country of origin. Results show that European Union
citizens who highly identify with Europe, as opposed to their nation,
hold more favorable views toward immigrants of European Union origin,
indicating that a supranational identity reduces bias and facilitates
intergroup cooperation. Another possible explanation for the absence
of the expected effect might be that Latin American subjects had a
high degree of contact (45%) with US Americans, and thus the USA
might not be the ideal candidate for a contrasting out-group. Thus,
for future studies aiming to understand the concept of multiple
identities, it would be advisable to recruit national subsamples with
less intergroup contact. In line with Allport’s contact hypothesis
(Allport, 1954; Dovidio, Gaertner & Kawakami, 2003) contact with the
national out-group was identified as one predictor of reduced social
distance, as well as in-group favoritism. However, the direction of
causality is in this context somewhat unclear since affinity might
drive contact or vice versa.
With regard to individual characteristics, we show in some of the
analyses that the magnitude of in-group favoritism decreases with
increasing social value orientation. As the effect is relatively small
and volatile further research is needed to validate this
finding. However, we replicate the standard finding that social
preference is a clear predictor for DG giving behavior in that
individualists showed significantly less prosocial behavior, compared
to cooperative individuals, in both in- and out-group
interactions. Notably, the predictive power of social preferences for
prosocial behavior (i.e., DG giving) was stronger in the US compared
to the Latin American sample. This finding could be a valuable
starting point for future research to understand the role of
individual preferences for decision-making in the context of cultural
differences (Buchan, Johnson & Croson, 2006; e.g., individualism vs.
collectivism, see Al-Zahrani & Kaplowitz, 1993).
Overall, the results of this large-scale study provide an important
contribution to the discussion of cross-national intergroup
behavior. Using population representative samples according to age and
sex and an incentivized design, we showed distinct differences in the
extent of in-group favoritism and potentially the underlying national
fairness norms in Latin America and the US. Furthermore, we identify
interaction characteristics such as social distance and individual
characteristics, such as social preferences, that determine national
in-group favoritism. Whereas our study reveals general predictors for
national in-group favoritism in prosocial behavior, future research
could investigate specific cultural determinants such as a nation’s
level of individualism or uncertainty avoidance (see e.g., R. Fischer
& Derham, 2016). To do so, these studies should include a more
diverse set of nations that vary with regard to important cultural
dimensions.
Besides the limited number of countries considered, our research could
be criticized for the fact that in our study only one of many
decisions and one of two roles (active vs. passive) were randomly
chosen for experimental payoff. This procedure represents a variant of
the well-established strategy method (e.g., Fischbacher, Gächter &
Quercia, 2012) and is an economic way of collecting data. However, the
fact that subjects were informed that they could have both roles might
have activated reciprocity concerns that should be precluded in
dictator games (Büchner, Coricelli & Greiner, 2007). Although we do
not see a straightforward way how this design feature might have
caused our differential results, future studies could assign only one
of both roles to preclude this factor as potential confound.
Our work has practical implications for globalization and migration,
in that it identifies some of the determinants of in-group favoritism,
such as perceived social distance which is associated with
contact. Increasing social encounters and contact with refugees (e.g.,
in sports associations, neighborhood initiatives, kindergartens and
schools) may lead individuals to draw broader group boundaries,
perceive less social distance to national out-groups, and treat them
more similarly to national in-group members. This might help reduce
the extent of national in-group favoritism and contribute to the
current societal challenge of an integration of migrants from various
nations. Further systematic research is, however, required to
test these ideas.
References
Al-Zahrani, S. S., & Kaplowitz, S. A. (1993). Attributional biases in
individualistic and collectivistic cultures: A comparison of Americans
with Saudis. Social Psychology Quarterly, 223–233. http://dx.doi.org/10.2307/2786780.
Alexander, R. D. (1974). The evolution of social behavior.
Annual Review of Ecology and Systematics,5(1), 325–383.
http://dx.doi.org/10.1146/annurev.es.05.110174.001545.
Allport, G. W. (1954). The nature of prejudice. Cambridge,
MA: Addison-Wesley.
Aron, A., Aron, E. N., & Smollan, D. (1992). Inclusion of Other in the
Self Scale and the structure of interpersonal closeness.
Journal of Personality and Social Psychology, 63(4), 596–612.
http://dx.doi.org/10.1037/0022-3514.63.4.596.
Balliet, D., Parks, C., & Joireman, J. (2009). Social value orientation
and cooperation in social dilemmas: a meta-analysis. Group
Processes & Intergroup Relations, 12(4), 533–547.
http://dx.doi.org/10.1177/1368430209105040.
Balliet, D., Wu, J., & De Dreu, C. K. (2014). Ingroup favoritism in
cooperation: a meta-analysis. Psychological Bulletin, 140(6),
1556–1581. http://dx.doi.org/10.1037/a0037737.
Becker, A., Dohmen, T. J., Enke, B., Falk, A., Huffman, D., & Sunde, U.
(2015). The nature and predictive power of preferences: global
evidence. IZA Discussion Paper No. 9504. Available at SSRN: https://ssrn.com/abstract=2696302.
Bornstein, G., & Ben-Yossef, M. (1994). Cooperation in intergroup and
single-group social dilemmas. Journal of Experimental Social
Psychology, 30(1), 52–67. https://doi.org/10.1006/jesp.1994.1003.
Brislin, R. W. (1970). Back-translation for cross-cultural research.
Journal of Cross-Cultural Psychology, 1(3), 185–216.
http://dx.doi.org/10.1177/135910457000100301.
Brown, R. J. (1984). The effects of intergroup similarity and
cooperative vs. competitive orientation on intergroup discrimination.
British Journal of Social Psychology, 23(1), 21–33.
http://dx.doi.org/10.1111/j.2044-8309.1984.tb00605.x.
Buchan, N. R., Grimalda, G., Wilson, R., Brewer, M., Fatas, E., &
Foddy, M. (2009). Globalization and human cooperation.
Proceedings of the National Academy of Sciences, 106(11),
4138–4142. http://dx.doi.org/10.1073/pnas.0809522106.
Buchan, N. R., Johnson, E. J., & Croson, R. T. A. (2006).
Let’s get personal: An international examination of
the influence of communication, culture and social distance on other
regarding preferences. Journal of Economic Behavior &
Organization, 60(3), 373–398. http://dx.doi.org/10.1016/j.jebo.2004.03.017.
Büchner, S., Coricelli, G., & Greiner, B. (2007). Self-centered and
other- regarding behavior in the solidarity game. Journal of
Economic Behavior and Organization, 62(2), 293–303. http://dx.doi.org/10.1016/j.jebo.2004.12.006.
Castro, M. F. (2008). Where are you from? Cultural differences in public
good experiments. The Journal of Socio-Economics, 37(6),
2319–2329. http://dx.doi.org/10.1016/j.socec.2008.04.002.
Cnaan, R. A., Pessi, A. B., Zrinscak, S., Handy, F., Brudney, J. L.,
Grönlund, H., …Kang, C. (2012). Student values, religiosity, and
pro-social behaviour: A cross-national perspective. Diaconia,
3(1), 2–25. http://dx.doi.org/10.13109/diac.2012.3.1.2.
Costa, A., Foucart, A., Arnon, I., Aparici, M., & Apesteguia, J.
(2014). “Piensa” twice: on the foreign
language effect in decision making. Cognition, 130(2),
236–254. http://dx.doi.org/10.1016/j.cognition.2013.11.010.
Cuddy, A. J., Rock, M. S., & Norton, M. I. (2007). Aid in the aftermath
of Hurricane Katrina: Inferences of secondary emotions and intergroup
helping. Group Processes & Intergroup Relations, 10(1),
107–118. http://dx.doi.org/10.1177/1368430207071344.
Curtis, K. A. (2014). Inclusive versus exclusive: A cross-national comparison of the effects of subnational, national, and supranational identity. European Union Politics, 15(4), 521-546. http://dx.doi.org/10.1177/1465116514528058.
Darwin, C. R. (1874). The descent of man: And selection in
relation to sex (Vol. 1). London: Murray.
De Dreu, C. K. W. (2010). Social value orientation moderates ingroup
love but not outgroup hate in competitive intergroup conflict.
Group Processes & Intergroup Relations, 13(6), 701–713.
http://dx.doi.org/10.1177/1368430210377332.
De Dreu, C. K. W., Dussel, D. B., & Velden, F. S. (2015). In intergroup
conflict, self-sacrifice is stronger among pro-social individuals, and
parochial altruism emerges especially among cognitively taxed
individuals. Frontiers in Psychology, 6, 572.
http://dx.doi.org/10.3389/fpsyg.2015.00572.
De Waal, F. B., Leimgruber, K., & Greenberg, A. R. (2008). Giving is
self-rewarding for monkeys. Proceedings of the National Academy
of Sciences, 105(36), 13685–13689. http://dx.doi.org/10.1073/pnas.0807060105.
Demes, K. A., & Geeraert, N. (2014). Measures matter: Scales for
adaptation, cultural distance, and acculturation orientation revisited.
Journal of Cross-Cultural Psychology, 45(1), 91–109.
http://dx.doi.org/10.1177/0022022113487590.
Dorrough, A. R., & Glöckner, A. (2016). Multinational investigation of
cross-societal cooperation. Proceedings of the National Academy
of Sciences, 113(39), 10836–10841. http://dx.doi.org/10.1073/pnas.1601294113.
Dovidio, J. F., Gaertner, S. L., & Kawakami, K. (2003). Intergroup
contact: The past, present, and the future. Group Processes &
Intergroup Relations, 6(1), 5–21. http://dx.doi.org/10.1177/1368430203006001009.
Ellemers, N., De Gilder, D., & Haslam, S. A. (2004). Motivating
individuals and groups at work: A social identity perspective on
leadership and group performance. Academy of Management Review,
29(3), 459–478. http://dx.doi.org/10.2307/20159054.
Engel, C. (2011). Dictator games: a meta study. Experimental
Economics, 14(4), 583–610. http://dx.doi.org/10.1007/s10683-011-9283-7.
Falk, A., Meier, S., & Zehnder, C. (2013). Do lab experiments
misrepresent social preferences? The case of self-selected student
samples. Journal of the European Economic Association, 11(4),
839–852. http://dx.doi.org/10.1111/jeea.12019.
Fehr, E., Bernhard, H., & Rockenbach, B. (2008). Egalitarianism in
young children. Nature, 454(7208), 1079–1083.
http://dx.doi.org/10.1038/nature07155.
Fehr, E., & Schmidt, K. M. (1999). A theory of fairness, competition,
and cooperation. Quarterly journal of Economics, 114(3), 817–868.
http://dx.doi.org/10.1162/003355399556151.
Fershtman, C., Gneezy, U., & Verboven, F. (2005). Discrimination and
nepotism: the efficiency of the anonymity rule. The Journal of
Legal Studies, 34(2), 371–396. http://dx.doi.org/10.1086/429846.
Fischbacher, U., Gächter, S., & Quercia, S. (2012). The behavioral
validity of the strategy method in public good
experiments. Journal of Economic Psychology, 33(4), 897–913. http://dx.doi.org/10.1016/j.joep.2012.04.002.
Fischer, I. (2009). Friend or foe: subjective expected relative
similarity as a determinant of cooperation. Journal of
Experimental Psychology: General, 138(3), 341–350.
http://dx.doi.org/10.1037/a0016073.
Fischer, R., & Derham, C. (2016). Is in-group bias culture-dependent? A
meta-analysis across 18 societies. SpringerPlus, 5(1), 70.
http://dx.doi.org/10.1186/s40064-015-1663-6.
Gaertner, S. L., & Dovidio, J. F. (2000). Reducing intergroup
bias: The common ingroup identity model. Philadelphia, PA: Psychology Press/Taylor & Francis.
Goette, L., Huffman, D., & Meier, S. (2006). The impact of group
membership on cooperation and norm enforcement: Evidence using random
assignment to real social groups. American Economic Review,
96(2), 212–216. http://dx.doi.org/10.1257/000282806777211658.
Halevy, N., Weisel, O., & Bornstein, G. (2012). “In-group love” and
“out-group hate” in repeated interaction between groups.
Journal of Behavioral Decision Making, 25(2), 188–195.
http://dx.doi.org/10.1002/bdm.726.
Henrich, J., Heine, S. J., & Norenzayan, A. (2010). The weirdest people
in the world? Behavioral and Brain Sciences, 33(2–3), 61–83.
http://dx.doi.org/10.1017/S0140525X0999152X.
Hewstone, M., Rubin, M., & Willis, H. (2002). Intergroup bias. Annual
Review of Psychology, 53(1), 575–604. http://dx.doi.org/10.1146/annurev.psych.53.100901.135109.
Hoffman, E., McCabe, K., & Smith, V. L. (1996). Social distance and
other-regarding behavior in dictator games. The American
Economic Review, 89(1), 340–341. http://dx.doi.org/10.1257/aer.89.1.340.
Hofstede, G., Hofstede, J., & Minkov, M. (2010). Cultures and
Organizations: Software of the Mind. (Vol. 3). New York: McGraw-Hill.
Kogut, T., & Ritov, I. (2007). “One of us”: Outstanding willingness
to help save a single identified compatriot. Organizational
Behavior and Human Decision Processes, 104(2),
150-157. doi:10.1016/j.obhdp.2007.04.006.
Kogut, B., & Singh, H. (1988). The effect of national culture on the choice of entry mode. Journal of international business studies, 19(3), 411–432. http://dx.doi.org/10.1057/palgrave.jibs.8490394.
Levine, M., Cassidy, C., Brazier, G., & Reicher, S. (2002).
Self-categorization and bystander non-intervention: Two experimental
studies. Journal of Applied Social Psychology, 32(7),
1452–1463. http://dx.doi.org/0.1111/j.1559-1816.2002.tb01446.x.
Levine, M., & Thompson, K. (2004). Identity, place, and bystander
intervention: Social categories and helping after natural disasters.
The Journal of Social Psychology, 144(3), 229–245.
http://dx.doi.org/10.3200/SOCP.144.3.229-245.
Levine, R. V., Norenzayan, A., & Philbrick, K. (2001). Cross-Cultural
Differences in Helping Strangers. Journal of Cross-Cultural
Psychology, 32(5). http://dx.doi.org/10.1177/0022022101032005002.
Liebrand, W. B., & McClintock, C. G. (1988). The ring measure of
social values a computerized procedure for assessing individual
differences in information processing and social value
orientation. European Journal of Personality, 2(3),
217–230. http://dx.doi.org/10.1002/per.2410020304.
Liu, J. H., Yamagishi, T., Wang, F., Schug, J., Lin, Y., Yu, S., . . .
Huang, L. (2011). Unbalanced triangle in the social dilemma of trust:
Internet studies of real-time, real money social exchange between
China, Japan, and Taiwan. Asian Journal of Social Psychology,
14(4), 246–257. http://dx.doi.org/10.1111/j.1467-839X.2011.01353.x.
Lockwood, B., & Redoano, M. (2005). The CSGR Globalisation Index
Website, CSGR Working Paper 155/05. Retrieved from
http://www2.warwick.ac.uk/fac/soc/csgr/index.
Luria, G., Cnaan, R. A., & Boehm, A. (2014). National culture and
prosocial behaviors: Results from 66 countries. Nonprofit and
Voluntary Sector Quarterly, 44(5), 1041–1065.
http://dx.doi.org/10.1177/0899764014554456.
Morris, M. W., Hong, Y., Chiu, C., & Liu, Z. (2015). Normology:
Integrating insights about social norms to understand cultural
dynamics. Organizational Behavior and Human Decision Processes,
129, 1–13. http://dx.doi.org/10.1016/j.obhdp.2015.03.001.
Mullen, B., Brown, R., & Smith, C. (1992). Ingroup bias as a function
of salience, relevance, and status: An integration. European
Journal of Social Psychology, 22(2), 103–122.
http://dx.doi.org/10.1002/ejsp.2420220202.
Murphy, R. O., & Ackermann, K. A. (2014). Social value orientation:
theoretical and measurement issues in the study of social preferences.
Personality and Social Psychology Review, 18(1), 13–41.
http://dx.doi.org/10.1177/1088868313501745.
Murphy, R. O., Ackermann, K. A., & Handgraaf, M. J. (2011). Measuring
social value orientation. Judgment and Decision Making, 6(8),
771–781. http://dx.doi.org/10.2139/ssrn.1804189.
Mussweiler, T., & Ockenfels, A. (2013). Similarity increases altruistic
punishment in humans. Proceedings of the National Academy of
Sciences, 110(48), 19318–19323. http://dx.doi.org/10.1073/pnas.1215443110.
Pettigrew, T. F. (1979). The ultimate attribution error: Extending
Allport’s cognitive analysis of prejudice.
Personality and Social Psychology Bulletin, 5(4), 461–476.
http://dx.doi.org/10.1177/014616727900500407.
Piston, S. C. (2014). Sympathy for the poor, resentment of the rich, and their political consequences (Doctoral dissertation). Retrieved from: https://deepblue.lib.umich.edu/bitstream/handle/2027.42/109000/spiston_1.pdf.
Popan, J. R., Kenworthy, J. B., Barden, M. A., & Griffiths, J. (2010).
Intergroup bias in weight controllability attributions. Group
Processes & Intergroup Relations, 13(3), 319–328.
http://dx.doi.org/10.1177/1368430209350474.
Rachlin, H., & Jones, B. A. (2008). Altruism among relatives and
non-relatives. Behavioural Processes, 79(2), 120–123. https://doi.org/10.1016/j.beproc.2008.06.002.
Renkewitz, F., Fuchs, H. M., & Fiedler, S. (2011). Is there evidence of
publication biases in JDM research. Judgment and Decision
Making, 6(8), 870–881.
Roos, P., Gelfand, M., Nau, D., & Lun, J. (2015). Societal threat and
cultural variation in the strength of social norms: An evolutionary
basis. Organizational Behavior and Human Decision Processes,
129, 14–23. http://dx.doi.org/10.1016/j.obhdp.2015.01.003.
Schmitz, L., & Weber, W. (2014). Are Hofstede’s
dimensions valid? A test for measurement invariance of uncertainty
avoidance. Interculture Journal, 13(22), 11–26.
Sherif, M., & Sherif, C. W. (1953). Groups in harmony and
tension; an integration of studies of intergroup relations (Vol. 13).
Oxford, England: Harper & Brothers.
Siem, B., & Stürmer, S. (2012). Cross-cultural volunteerism:
Examining the effects of intercultural (dis) similarities on
volunteers’ motivations to support international
students. Basic and Applied Social Psychology, 34(6),
544–557. https://doi.org/10.1080/01973533.2012.727316.
Simpson, B. (2006). Social identity and cooperation in social dilemmas.
Rationality and Society, 18(4), 443–470.
http://dx.doi.org/10.1177/1043463106066381.
Tajfel, H., & Turner, J. C. (1979). An integrative theory of intergroup conflict. In W. G. Austin & S. Worchel (Eds.), The social psychology of intergroup relations (pp. 33-47). Monterey, CA: Brooks/Cole.
Tanaka, T., & Camerer, C. F. (2013). Trait perceptions influence
economic out-group bias: Lab and field evidence from Vietnam.
Experimental Economics, 19(3), 1–22.
http://dx.doi.org/10.1007/s10683-015-9452-1.
Thielmann, I., & Böhm, R. (2016). Who does (not) participate in
intergroup conflict? Social Psychological and Personality
Science, 7(8), 778–787. http://dx.doi.org/10.1177/1948550616660160.
Van de Vliert, E. (2010). Climato-economic origins of variation in
ingroup favoritism. Journal of Cross-Cultural Psychology,
42(3), 494–515. http://dx.doi.org/10.1177/0022022110381120.
Vignoles, V. L., Owe, E., Becker, M., Smith, P. B., Easterbrook, M. J.,
Brown, R., …Cadena, M. P. (2016). Beyond the ‘east–west’dichotomy:
Global variation in cultural models of selfhood. Journal of
Experimental Psychology, 145(8), 966–1000. http://dx.doi.org/10.1037/xge0000175.
Weisel, O., & Böhm, R. (2015). “Ingroup love” and “outgroup hate” in
intergroup conflict between natural groups. Journal of
Experimental Social Psychology, 60, 110–120.
http://dx.doi.org/10.1016/j.jesp.2015.04.008.
5 Appendix
| Table A1: Socio-demographic and socio-economic information for each national subsample. |
| | Chile | Peru | Colombia | Venezuela | USA |
Female | 49% | 48% | 49% | 50% | 51% |
Age | 42.3 (15.4) | 38.3 (13.6) | 39.4 (14.4) | 39.1 (14.2) | 46.3 (16.3) |
Primary School | − | − | − | 0.5% | 1% |
High School | 30.4% | 17.8% | 23.7% | 21.8% | 31.3% |
University | 69.7% | 82.2% | 76.3% | 77.7% | 69.7% |
Real income in $ | 1084.6 (908.4) | 634.9 (620.4) | 503.6 (493.7) | 1234.2 (1077.7) | 1655.3 (1305.3) |
| Note: The table presents mean values and standard deviations in
parentheses. Education was measured using a 3-point scale with 1 =
primary school, 2 = high school, 3 = university. Income was measured
using a 7-point scale which was converted into each local currency
with 1 < USD 250, 2 = USD 251–500, 3= USD 501–1000, 4 =
USD 1001–1500, 5 = USD 1501–2000, 5= USD 2001–3000, 7 >
USD 3001. Real income was calculated using the mean of each income
bracket as the estimate of real income and USD 3500 for the highest
category 7 (assuming an equal size of this category as for the
previous ones).
|
| Table A2: Scores of the Hofstede dimensions for all national subsamples. |
| | Power Distance | Individualism | Masculinity | Uncertainty Avoidance | Long Term Orientation | Indulgence |
|
Chile | 63 | 23 | 28 | 86 | 31 | 68 |
| Peru | 64 | 16 | 42 | 87 | 25 | 46 |
| Venezuela | 81 | 12 | 73 | 76 | 16 | 100 |
| Colombia | 67 | 13 | 64 | 80 | 13 | 83 |
| USA | 40 | 91 | 62 | 46 | 26 | 68 |
| Table A3: Uni- and multivariate analyses for the predictors of in-group
favoritism (including US-sample). |
| | Univariate without controls | | Univariate with controls | | Full Model |
Predictors | | | | | | | | | |
Social distancea | 1.72*** (7.28) | | | | 1.78*** (7.40) | | | | 1.91*** (7.90) |
Hofstede cultural distanceb | | −0.55** (−2.63) | | | | −0.50* (−2.06) | | | −0.74** (−3.18) |
Social Value Orientation | | | −0.09 (−1.82) | | | | −0.08 (−1.60) | | −0.10+ (−1.96) |
| Control factors | | | | | | | | |
Dictator nation | NO | NO | NO | | YES | YES | YES | | YES |
Receiver nation | NO | NO | NO | | YES | YES | YES | | YES |
Demographic controls (income, age, sex, education) | NO | NO | NO | | YES | YES | YES | | YES |
Constant | 10.42*** (14.65) | 12.17*** (17.01) | 11.71*** (16.83) | | 10.55*** (6.73) | 12.09*** (7.68) | 11.74*** (7.50) | | 10.78*** (6.85)
|
N | 2741 | 2745 | 2745 | | 2741 | 2745 | 2745 | | 2741 |
| Note: z statistics in parentheses;
*** p < .001, ** p < .01, * p < .05, + p < .1. All analyses are mixed effects regression with random slopes and random intercepts for all variables listed under predictors. |
| a Social distance is calculated as the difference in indicated social distance between in- and out-group members, all predictors and demographic controls are mean centered, nation controls are included as dummy variables. |
| b A standard method to compute cultural distance based on Hofstede’s model is the Euclidean distance variant of Kogut and Singh (1988). Cultural distance (CD) is thereby defined through a mathematical formula, where Ikj is country j’s score on the kth cultural dimension, Iki is the score of country i on this dimension, and Vk is the variance of the score of the dimension:
|
| Table A4: Multivariate analyses for the predictors of In-group favoritism and DG giving in in- and out-group interactions both including / excluding subjects from the US with inclusion of control variables |
| | In-group favoritismb,c | | DG In-group | | DG Out-group b,c |
| | Without US | With US | | Without US | With US | | Without US | With US |
|
Dictator nationa | | | | | | | | |
| Chile | −1.01 (−0.73) | 0.94 (0.68) | | −1.03 (−0.69) | −0.49 (−0.32) | | −0.10 (−0.07) | −1.39 (0.98) |
| Peru | 0.60 (0.44) | 2.32 (1.64) | | −0.91 (−0.61) | −0.36 (−0.23) | | −1.75 (−1.27) | −2.87* (1.97) |
| Colombia | 0.20 (0.14) | 2.34 (1.65) | | 1.14 (0.77) | 1.56 (0.98) | | 0.88 (0.64) | −0.74 (−0.51) |
| Venezuela | 0.21 (0.15) | 2.36 (1.74) | | 0.80 (0.53) | 1.29 (0.84) | | 0.96 (0.70) | −0.62 (−0.45) |
| USA | | −7.97*** (−4.01) | | | −2.00 (−0.94) | | | 5.62** (2.74) |
| Predictors | | | | | | | | |
| Social distanceb | 1.64*** (5.97) | 1.91*** (7.90) | | 0.60 (1.12) | 0.55 (1.13) | | −1.55*** (-5.57) | −1.86*** (7.55) |
| Hofstede cultural distance | −0.76** (−3.01) | −0.74** (−3.18) | | | | | 0.71** (2.85) | 0.71** (2.99) |
| Social Value Orientation | −0.08 (−1.46) | −0.10+ (−1.96) | | 0.24*** (4.02) | 0.28*** (5.06) | | 0.36*** (5.90) | 0.43*** (7.40) |
| Only Latin out-groups | −0.82 (−0.53) | | | −2.69 (−1.61) | | | −1.26 (−0.82) | |
| Demographic controls | | | | | | | |
| Female | −1.76 (−1.10) | −2.10 (−1.47) | | −2.10 (−1.22) | −1.94 (−1.21) | | 0.29 (0.18) | 0.93 (0.63) |
| Age | 0.04 (0.66) | 0.05 (0.94) | | 0.05 (0.90) | 0.07 (1.21) | | 0.01 (0.09) | 0.01 (0.10) |
| High School | 6.61 (0.30) | −0.90 (−0.06) | | 3.60 (0.15) | −0.91 (−0.05) | | −3.69 (−0.17) | 0.42 (0.03) |
| University | 9.34 (0.42) | 1.96 (0.13) | | 5.84 (0.25) | 1.23 (0.07) | | −3.91 (−0.18) | −0.11 (−0.01) |
| Income | 0.01 (0.36) | −0.01 (−0.02) | | 0.01 (0.30) | 0.01 (0.05) | | 0.01 (0.08) | 0.01 (0.30) |
| Control receiver nation | YES | YES | | NO | NO | | YES | YES |
| Constant | 12.48*** (13.59) | 9.84*** (11.44) | | 48.01*** (32.22) | 47.49*** (35.72) | | 36.69*** (39.92) | 38.61*** (43.71) |
| N | 2078 | 2741 | | 816 | 915 | | 2078 | 2741 |
| Note: z statistics in parentheses;
*** p < .001, ** p < .01, * p < .05, + p < .1. |
| a Indicators for dictator nationality are effect coded (centered variables) and represent comparisons against the grand mean. To be able to report deviations for all countries, coefficients for the omitted category are estimated in a second run of the analysis in which a different country was omitted. All predictors and demographic controls are mean centered. |
| b Social distance is calculated as the difference in indicated social distance between in- and out-group members. |
| c Mixed effects regression with random slopes and random intercepts for all variables listed under predictors.
|
| Table A5: Multivariate analyses for the predictors of perceived social distance toward in- and out-group members both including/excluding dictators and receivers from the US with inclusion of sociodemographic controls, nationality of the dictator, nationality of the receiver, and contact. |
| | OSIO In-group | | OSIO Out-groupb,c |
| Without US | With US | | Without US | With US |
Dictator nationa | | | | | |
Chile | 0.38*** (3.92) | 0.26* (2.50) | | −0.31*** (−2.75) | −0.38** (−3.13) |
Peru | 0.26** (2.64) | 0.11 (1.11) | | −0.05 (−0.40) | −0.07 (−0.55) |
Colombia | −0.37*** (−3.77) | −0.50*** (−4.64) | | 0.34** (3.03) | 0.33** (2.63) |
Venezuela | −0.27** (−2.75) | −0.42*** (−4.01) | | 0.01 (0.12) | −0.01 (−0.07) |
USA | | 0.55*** (3.78) | | | 0.13 (0.71) |
Predictors | | | | | |
Hofstede cultural distance | | | | 0.03 (1.28) | 0.04 (1.71) |
Social Value Orientation | −0.01** (−2.91) | −0.01** (−2.71) | | 0.01 (1.24) | 0.01 (1.03) |
Only Latin out-groups | −0.06 (−0.58) | | | 0.12 (0.90) | |
| Demographic controls | | | | |
Female | −0.01 (−0.06) | −0.07 (−0.64) | | 0.48*** (3.64) | 0.53*** (4.20) |
Age | 0.01 (0.33) | −0.01 (−0.89) | | −0.01 (−1.88) | −0.01 (−0.37) |
High school | 0.39 (0.25) | −1.05 (−0.91) | | 2.70 (1.52) | 2.89* (2.16) |
University | 0.42 (0.27) | −0.96 (−0.84) | | 2.48 (1.40) | 2.70* (2.02) |
Income | −0.01 (−0.86) | −0.01 (−0.90) | | 0.01* (2.02) | 0.01 (1.83) |
Contact | | | | −0.85*** (−11.59) | −0.82*** (−13.50) |
Control receiver nation | NO | NO | | YES | YES |
Constant | 1.87*** (34.00) | 2.01*** (36.04) | | 3.08*** (39.99) | 3.08*** (40.24) |
N | 816 | 915 | | 2078 | 2741 |
| Note: z statistics in parentheses;
*** p < .001, ** p < .01, * p < .05. |
| a Indicators for dictator nationality are effect coded (centered variables) and represent comparisons against the grand mean. To be able to report deviations for all countries, coefficients for the omitted category are estimated in a second run of the analysis in which a different country was omitted. All predictors and demographic controls are mean centered. |
| b Social distance is calculated as the difference in indicated social distance between in- and out-group members. |
| c Mixed effects regression with random slopes and random intercepts for all variables listed under predictors.
|
| Table A6: Correlation of predictors. |
| | Social distancea | Hofstede cultural distancea | Social Value Orientation | Female | Age | Income | High School |
|
Hofstede cultural distance | 0.52*** | | | | | | |
| Social Value Orientation | 0.03 | 0.01 | | | | | |
| Female | 0.10*** | 0.01 | 0.02 | | | | |
| Age | -0.02 | 0.03 | -0.07*** | -0.20*** | | | |
| Income | 0.01 | 0.07*** | -0.04 | -0.14*** | 0.28*** | | |
| High school | 0.02 | 0.01 | 0.02 | -0.03 | -0.02 | -0.13*** | |
| University | -0.02 | -0.02 | -0.02 | 0.03 | 0.03 | 0.13*** | -0.99*** |
| abased on repeated measures. |
| *** p < .001.
|
This document was translated from LATEX by
HEVEA.